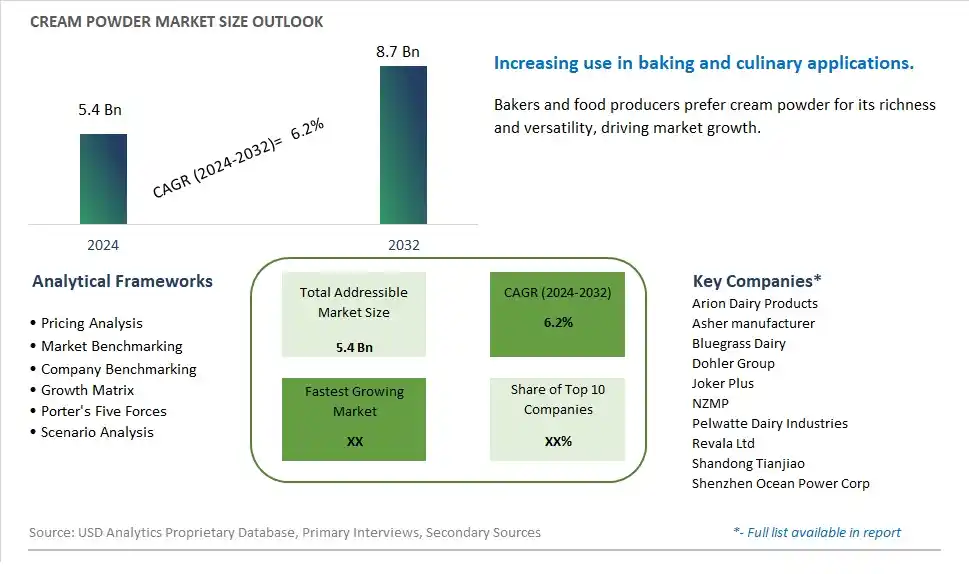
Global Cream Powder Market Size is valued at $5.4 Billion in 2024 and is forecast to register a growth rate (CAGR) of 6.2% to reach $8.7 Billion by 2032.
The global Cream Powder Market Comprehensive Study analyzes and forecasts the market size across 6 regions and 24 countries for diverse segments -By Type (High Fat Powder, Lipid Powder), By Application (Desserts, Ice Cream, Cake, Confectionery, Others)
An Introduction to Cream Powder Market
In 2024, the Cream Powder market is witnessing significant growth, driven by the increasing demand for convenient and shelf-stable dairy ingredients. Cream powder, made from dehydrated cream, is valued for its rich flavor, high-fat content, and versatility in culinary applications. The market is supported by the growing trend towards convenient and high-quality cooking ingredients. Advances in dairy processing and drying technologies are enhancing the quality, flavor, and nutritional profile of cream powder. The market is also benefiting from the trend towards clean-label and minimally processed products, appealing to health-conscious consumers seeking reliable and nutritious dairy ingredients.
Cream Powder Competitive Landscape
The market report analyses the leading companies in the industry including Arion Dairy Products, Asher manufacturer, Bluegrass Dairy, Dohler Group, Joker Plus, NZMP, Pelwatte Dairy Industries, Revala Ltd, Shandong Tianjiao, Shenzhen Ocean Power Corp, and Others.
Cream Powder Market Dynamics
Cream Powder Market Trend: Shift Towards Convenience and Shelf Stability
One prominent market trend in the cream powder industry is the increasing shift towards convenience and shelf stability. Consumers are looking for easy-to-use and long-lasting alternatives to fresh cream, especially in baking and dessert applications. Cream powder offers the advantage of extended shelf life, easier storage, and convenient transportation, making it a preferred choice for both consumers and food manufacturers.
Cream Powder Market Driver: Demand for Dairy Alternatives and Vegan Options
A significant market driver for cream powder is the rising demand for dairy alternatives and vegan options. As more consumers adopt plant-based diets or seek dairy-free alternatives due to lactose intolerance or ethical reasons, there is a growing market for powdered cream products made from non-dairy sources such as soy, coconut, or almond. This demand for vegan-friendly cream powders is driving innovation and product development within the industry.
Cream Powder Market Opportunity: Expansion into Emerging Markets and Applications
An exciting potential opportunity in the cream powder market lies in expanding into emerging markets and applications. With globalization and changing consumer preferences, there is a growing demand for cream powders in various food segments beyond traditional bakery and confectionery products. Opportunities exist in sectors like ready-to-drink beverages, instant soups and sauces, dairy-based desserts, and even in the foodservice industry. By exploring new markets and applications, cream powder manufacturers can unlock new revenue streams and drive growth in the industry.
Cream Powder Market Share Analysis: High Fat Powder segment generated the highest revenue share in the industry
The largest segment in the Cream Powder market is High Fat Powder. High Fat Powder refers to cream powder with a higher fat content, used in various food and beverage applications such as bakery products, confectionery, dairy products, and sauces. Its dominance can be attributed to several factors. Firstly, high fat content contributes to a rich and creamy texture, making it a preferred choice for manufacturers seeking to enhance the taste and mouthfeel of their products. Further, the versatility of high fat powder allows it to be used in a wide range of applications, from enhancing the creaminess of desserts to adding richness to savory dishes. Further, the growing demand for premium and indulgent food products among consumers has further propelled the popularity of high fat powder in the market. With these factors driving its growth, the High Fat Powder segment is expected to maintain its leading position and witness fast-paced expansion in the Cream Powder market in the coming years.
Cream Powder Market Share Analysis: Desserts is the fastest growing segment over the forecast period to 2032
Among the various applications in the Cream Powder market, the Desserts segment stands out as the fastest-growing. The Desserts segment includes a wide range of products such as puddings, custards, mousse, and other creamy desserts. The surge in demand for ready-to-eat desserts and convenience foods has significantly contributed to the rapid growth of this segment. Consumers today seek indulgent and delicious dessert options that can be easily prepared at home or purchased from stores. Cream powder, with its ability to enhance the creaminess and richness of desserts, has become a key ingredient for manufacturers and home cooks alike. Further, the rising popularity of dessert cafes and dessert-focused restaurants has further fueled the demand for cream powder in dessert preparation. As a result, the Desserts segment is expected to experience substantial growth and emerge as a major driving force in the Cream Powder market landscape by 2032.
Cream Powder Market Segmentation
By Type
High Fat Powder
Lipid Powder
By Application
Desserts
Ice Cream
Cake
Confectionery
Others
Countries Analyzed
North America (US, Canada, Mexico)
Europe (Germany, UK, France, Spain, Italy, Russia, Rest of Europe)
Asia Pacific (China, India, Japan, South Korea, Australia, South East Asia, Rest of Asia)
South America (Brazil, Argentina, Rest of South America)
Middle East and Africa (Saudi Arabia, UAE, Rest of Middle East, South Africa, Egypt, Rest of Africa)
Cream Powder Companies Profiled in the Study
Arion Dairy Products
Asher manufacturer
Bluegrass Dairy
Dohler Group
Joker Plus
NZMP
Pelwatte Dairy Industries
Revala Ltd
Shandong Tianjiao
Shenzhen Ocean Power Corp
*- List Not Exhaustive
Chapter 1. TABLE OF CONTENTS
Chapter 2. Introduction to Cream Powder Market
2.1. Market Overview
2.2. Key Statistics and Report Highlights
2.3. Scope of the Comprehensive Study
2.3.1. Market Definition
2.3.2 Countries and Regions Covered
2.3.3 Research Objective
2.3.4 Units, Currency, and Conversions
2.3.5 Industry Value Chain
2.4. Key Market Segments
2.5. Key Companies
2.6. Study Period
Chapter 3. Strategic Analysis Review
3.1. Cream Powder Pricing Analysis and Forecast
3.2. Porter’s Five Forces
3.3. Market Ecosystem
3.4. SWOT Analysis
3.5. Regulatory Scenario
3.3. Effects of Inflation, Russia-Ukraine War, moderating economic growth, and other macroeconomic factors
Chapter 4. Competitive Landscape
4.1. Market Share Analysis
4.1.1. Global Cream Powder Market Share by Company, 2023
4.1.2. Product Offerings of Leading Cream Powder Companies
4.2. Market Entropy
4.2.1. New Product Launches in the Industry
4.2.2. Mergers, Acquisitions, Joint ventures, and Partnerships
4.3. Key Strategies and Best Practices
Chapter 5. Global Market Projections: Best, Reference, and Low Case Scenarios
5.1. Growth Analysis- Case Scenario Definitions
5.2. Low Growth Case Scenario Forecasts
5.3. Reference Growth Case Scenario Forecasts
5.4. High Growth Case Scenario Forecasts
Chapter 6. Market Dynamics
6.1. Cream Powder Market Drivers
6.2. Cream Powder Market Challenges
6.6. Cream Powder Market Opportunities
6.4. Cream Powder Market Trends
Chapter 7. Global Cream Powder Market Outlook Trends
7.1. Global Cream Powder Revenue (USD Million) and CAGR (%) by Type (2021-2032)
7.2. Global Cream Powder Revenue (USD Million) and CAGR (%) by Application (2021-2032)
7.3. Global Cream Powder Revenue (USD Million) and CAGR (%) by Product (2021-2032)
By Type
High Fat Powder
Lipid Powder
By Application
Desserts
Ice Cream
Cake
Confectionery
Others
Chapter 8. Global Cream Powder Regional Analysis and Outlook
8.1. Global Cream Powder Revenue (USD Million) By Regions (2021- 2032)
8.2. North America Cream Powder Revenue (USD Million) by Country (2021-2032)
8.2.1. United States Cream Powder Regional Analysis and Outlook
8.2.2. Canada Cream Powder Regional Analysis and Outlook
8.2.3. Mexico Cream Powder Regional Analysis and Outlook
8.3. Europe Cream Powder Revenue (USD Million), by Country (2021-2032)
8.3.1. Germany Cream Powder Regional Analysis and Outlook
8.3.2. France Cream Powder Regional Analysis and Outlook
8.3.3. United Kingdom Cream Powder Regional Analysis and Outlook
8.3.4. Spain Cream Powder Regional Analysis and Outlook
8.3.5. Italy Cream Powder Regional Analysis and Outlook
8.3.6. Russia Cream Powder Regional Analysis and Outlook
8.3.7. Rest of Europe Cream Powder Regional Analysis and Outlook
8.4. Asia Pacific Cream Powder Revenue (USD Million) by Country (2021-2032)
8.4.1. China Cream Powder Regional Analysis and Outlook
8.4.2. Japan Cream Powder Regional Analysis and Outlook
8.4.3. India Cream Powder Regional Analysis and Outlook
8.4.4. South Korea Cream Powder Regional Analysis and Outlook
8.4.5. Australia Cream Powder Regional Analysis and Outlook
8.4.6. South East Asia Cream Powder Regional Analysis and Outlook
8.4.7. Rest of Asia Pacific Cream Powder Regional Analysis and Outlook
8.5. South America Cream Powder Revenue (USD Million), by Country (2021-2032)
8.5.1. Brazil Cream Powder Regional Analysis and Outlook
8.5.2. Argentina Cream Powder Regional Analysis and Outlook
8.5.3. Rest of South America Cream Powder Regional Analysis and Outlook
8.6. Middle East and Africa Cream Powder Revenue (USD Million) by Country (2021-2032)
8.6.1. Middle East Cream Powder Regional Analysis and Outlook
8.6.2. Africa Cream Powder Regional Analysis and Outlook
Chapter 9. North America Cream Powder Analysis and Outlook
9.1. North America Cream Powder Revenue (USD Million) by Segments (2021-2032)
9.1.1. North America Cream Powder Revenue (USD Million) by Type (2021-2032)
9.1.2. North America Cream Powder Revenue (USD Million) by Application (2021-2032)
9.1.3. North America Cream Powder Revenue (USD Million) by Product (2021-2032)
By Type
High Fat Powder
Lipid Powder
By Application
Desserts
Ice Cream
Cake
Confectionery
Others
Chapter 10. Europe Cream Powder Analysis and Outlook
10.1. Europe Cream Powder Revenue (USD Million), by Segments (USD Million) (2021-2032)
10.1.1. Europe Cream Powder Revenue (USD Million) by Type (2021-2032)
10.1.2. Europe Cream Powder Revenue (USD Million) by Application (2021-2032)
10.1.3. Europe Cream Powder Revenue (USD Million) by Product (2021-2032)
By Type
High Fat Powder
Lipid Powder
By Application
Desserts
Ice Cream
Cake
Confectionery
Others
Chapter 11. Asia Pacific Cream Powder Analysis and Outlook
11.1. Asia Pacific Cream Powder Revenue (USD Million), and Revenue (USD Million) by Segments (2021-2032)
11.1.1. Asia Pacific Cream Powder Revenue (USD Million) by Type (2021-2032)
11.1.2. Asia Pacific Cream Powder Revenue (USD Million) by Application (2021-2032)
11.1.3. Asia Pacific Cream Powder Revenue (USD Million) by Product (2021-2032)
By Type
High Fat Powder
Lipid Powder
By Application
Desserts
Ice Cream
Cake
Confectionery
Others
Chapter 12. South America Cream Powder Analysis and Outlook
12.1. South America Cream Powder Revenue (USD Million), by Segments (2021-2032)
12.1.1. South America Cream Powder Revenue (USD Million) by Type (2021-2032)
12.1.2. South America Cream Powder Revenue (USD Million) by Application (2021-2032)
12.1.3. South America Cream Powder Revenue (USD Million) by Product (2021-2032)
By Type
High Fat Powder
Lipid Powder
By Application
Desserts
Ice Cream
Cake
Confectionery
Others
Chapter 13. Middle East and Africa Cream Powder Analysis and Outlook
13.1. Middle East and Africa Cream Powder Revenue (USD Million), by Segments (2021-2032)
13.1.1. Middle East and Africa Cream Powder Revenue (USD Million) by Type (2021-2032)
13.1.2. Middle East and Africa Cream Powder Revenue (USD Million) by Application (2021-2032)
13.1.3. Middle East and Africa Cream Powder Revenue (USD Million) by Product (2021-2032)
By Type
High Fat Powder
Lipid Powder
By Application
Desserts
Ice Cream
Cake
Confectionery
Others
Chapter 14. Cream Powder Company Profiles
14.1 Business Overview
14.2 Product Profiles
14.3 SWOT Profiles
14.5 Recent Developments
14.6 Financial Profile
List of Companies
Arion Dairy Products
Asher manufacturer
Bluegrass Dairy
Dohler Group
Joker Plus
NZMP
Pelwatte Dairy Industries
Revala Ltd
Shandong Tianjiao
Shenzhen Ocean Power Corp
15. Methodology and Data Sources
15.1 Customization Offerings
15.2 Subscription Services
15.3 Related Reports
15.4 Publisher Expertise
LIST OF TABLES
Table 1 Market Segmentation Analysis
Table 2 Global Cream Powder Market Share of Leading Companies, 2023
Table 3 Product Offerings of Leading Companies
Table 4 Low Growth Scenario Forecasts
Table 5 Reference Case Growth Scenario
Table 6 High Growth Case Scenario
Table 7 Global Cream Powder Revenue (USD Million) And CAGR (%) By Type (2021-2032)
Table 8 Global Cream Powder Revenue (USD Million) And CAGR (%) By Application (2021-2032)
Table 9 Global Cream Powder Revenue (USD Million) And CAGR (%) By Product (2021-2032)
Table 10 Global Cream Powder Market Revenue (USD Million) By Regions (2021-2032)
Table 11 Global Cream Powder Market Share (%) By Regions (2021-2032)
Table 12 North America Cream Powder Revenue (USD Million) By Country (2021-2032)
Table 13 Europe Cream Powder Revenue (USD Million) By Country (2021-2032)
Table 14 Asia Pacific Cream Powder Revenue (USD Million) By Country (2021-2032)
Table 15 South America Cream Powder Revenue (USD Million) By Country (2021-2032)
Table 16 Middle East and Africa Cream Powder Revenue (USD Million) By Region (2021-2032)
Table 17 North America Cream Powder Revenue (USD Million) By Type (2021-2032)
Table 18 North America Cream Powder Revenue (USD Million) By Application (2021-2032)
Table 19 North America Cream Powder Revenue (USD Million) By Product (2021-2032)
Table 20 Europe Cream Powder Revenue (USD Million) By Type (2021-2032)
Table 21 Europe Cream Powder Revenue (USD Million) By Application (2021-2032)
Table 22 Europe Cream Powder Revenue (USD Million) By Product (2021-2032)
Table 23 Asia Pacific Cream Powder Revenue (USD Million) By Type (2021-2032)
Table 24 Asia Pacific Cream Powder Revenue (USD Million) By Application (2021-2032)
Table 25 Asia Pacific Cream Powder Revenue (USD Million) By Product (2021-2032)
Table 26 South America Cream Powder Revenue (USD Million) By Type (2021-2032)
Table 27 South America Cream Powder Revenue (USD Million) By Application (2021-2032)
Table 28 South America Cream Powder Revenue (USD Million) By Product (2021-2032)
Table 29 Middle East and Africa Cream Powder Revenue (USD Million) By Type (2021-2032)
Table 30 Middle East and Africa Cream Powder Revenue (USD Million) By Application (2021-2032)
Table 31 Middle East and Africa Cream Powder Revenue (USD Million) By Product (2021-2032)
LIST OF FIGURES
Figure 1. Market Scope
Figure 2. Pricing Forecasts Per Unit, 2023- 2032
Figure 3. Porter’s Five Forces
Figure 4. Global Cream Powder Market Revenue (USD Million) By Regions (2021-2032)
Figure 5. Global Cream Powder Market Share (%) By Regions (2023)
Figure 6. North America Cream Powder Revenue (USD Million) By Country (2021-2032)
Figure 7. United States Cream Powder Revenue (USD Million) By Country (2021-2032)
Figure 8. Canada Cream Powder Revenue (USD Million) By Country (2021-2032)
Figure 9. Mexico Cream Powder Revenue (USD Million) By Country (2021-2032)
Figure 10. Europe Cream Powder Revenue (USD Million) By Country (2021-2032)
Figure 11. Germany Cream Powder Revenue (USD Million) By Country (2021-2032)
Figure 12. France Cream Powder Revenue (USD Million) By Country (2021-2032)
Figure 13. United Kingdom Cream Powder Revenue (USD Million) By Country (2021-2032)
Figure 14. Spain Cream Powder Revenue (USD Million) By Country (2021-2032)
Figure 15. Italy Cream Powder Revenue (USD Million) By Country (2021-2032)
Figure 16. Russia Cream Powder Revenue (USD Million) By Country (2021-2032)
Figure 17. Rest of Europe Cream Powder Revenue (USD Million) By Country (2021-2032)
Figure 11. Asia Pacific Cream Powder Revenue (USD Million) By Country (2021-2032)
Figure 12. China Cream Powder Revenue (USD Million) By Country (2021-2032)
Figure 13. Japan Cream Powder Revenue (USD Million) By Country (2021-2032)
Figure 14. India Cream Powder Revenue (USD Million) By Country (2021-2032)
Figure 15. South Korea Cream Powder Revenue (USD Million) By Country (2021-2032)
Figure 16. Australia Cream Powder Revenue (USD Million) By Country (2021-2032)
Figure 17. South East Asia Cream Powder Revenue (USD Million) By Country (2021-2032)
Figure 18. South America Cream Powder Revenue (USD Million) By Country (2021-2032)
Figure 19. Brazil Cream Powder Revenue (USD Million) By Country (2021-2032)
Figure 20. Argentina Cream Powder Revenue (USD Million) By Country (2021-2032)
Figure 21. Rest of Asia Pacific Cream Powder Revenue (USD Million) By Country (2021-2032)
Figure 22. Middle East and Africa Cream Powder Revenue (USD Million) By Region (2021-2032)
Figure 23. Saudi Arabia Cream Powder Revenue (USD Million) By Region (2021-2032)
Figure 24. The UAE Cream Powder Revenue (USD Million) By Region (2021-2032)
Figure 25. Rest of Middle East Cream Powder Revenue (USD Million) By Region (2021-2032)
Figure 26. South Africa Cream Powder Revenue (USD Million) By Region (2021-2032)
Figure 27. Africa Cream Powder Revenue (USD Million) By Region (2021-2032)
Figure 28. North America Cream Powder Revenue (USD Million) By Type (2021-2032)
Figure 29. North America Cream Powder Revenue (USD Million) By Application (2021-2032)
Figure 30. North America Cream Powder Revenue (USD Million) By Product (2021-2032)
Figure 31. Europe Cream Powder Revenue (USD Million) By Type (2021-2032)
Figure 32. Europe Cream Powder Revenue (USD Million) By Application (2021-2032)
Figure 33. Europe Cream Powder Revenue (USD Million) By Product (2021-2032)
Figure 34. Asia Pacific Cream Powder Revenue (USD Million) By Type (2021-2032)
Figure 35. Asia Pacific Cream Powder Revenue (USD Million) By Application (2021-2032)
Figure 36. Asia Pacific Cream Powder Revenue (USD Million) By Product (2021-2032)
Figure 37. South America Cream Powder Revenue (USD Million) By Type (2021-2032)
Figure 38. South America Cream Powder Revenue (USD Million) By Application (2021-2032)
Figure 39. South America Cream Powder Revenue (USD Million) By Product (2021-2032)
Figure 40. Middle East and Africa Cream Powder Revenue (USD Million) By Type (2021-2032)
Figure 41. Middle East and Africa Cream Powder Revenue (USD Million) By Application (2021-2032)
Figure 42. Middle East and Africa Cream Powder Revenue (USD Million) By Product (2021-2032)
By Type
High Fat Powder
Lipid Powder
By Application
Desserts
Ice Cream
Cake
Confectionery
Others
Countries Analyzed
North America (US, Canada, Mexico)
Europe (Germany, UK, France, Spain, Italy, Russia, Rest of Europe)
Asia Pacific (China, India, Japan, South Korea, Australia, South East Asia, Rest of Asia)
South America (Brazil, Argentina, Rest of South America)
Middle East and Africa (Saudi Arabia, UAE, Rest of Middle East, South Africa, Egypt, Rest of Africa)
