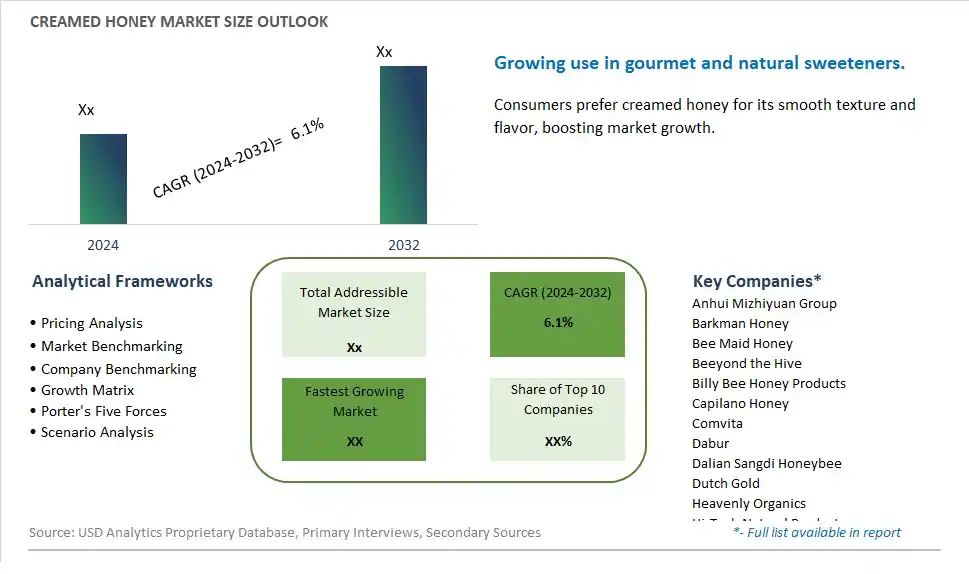
Global Creamed Honey Market Size is valued at $XX Million in 2024 and is forecast to register a growth rate (CAGR) of 6.1% to reach $XX Million by 2032.
The global Creamed Honey Market Comprehensive Study analyzes and forecasts the market size across 6 regions and 24 countries for diverse segments -By Type (Bottle, Jar, Tube, Tub, Others), By Application (Supermarkets/Hypermarkets, Convenience Stores, Specialty Stores, Others)
An Introduction to Creamed Honey Market
In 2024, the Creamed Honey market is witnessing significant growth, driven by the increasing demand for premium and versatile honey products. Creamed honey, also known as whipped or spun honey, is valued for its smooth, spreadable texture and rich flavor. The market is supported by the growing trend towards natural sweeteners and gourmet food products. Advances in honey processing and packaging technologies are enhancing the quality, flavor, and shelf life of creamed honey. The market is also benefiting from the trend towards clean-label and sustainably sourced honey, appealing to consumers seeking high-quality and authentic honey products.
Creamed Honey Competitive Landscape
The market report analyses the leading companies in the industry including Anhui Mizhiyuan Group, Barkman Honey, Bee Maid Honey, Beeyond the Hive, Billy Bee Honey Products, Capilano Honey, Comvita, Dabur, Dalian Sangdi Honeybee, Dutch Gold, Heavenly Organics, Hi-Tech Natural Products, Langnese, Little Bee Impex, Madhava Honey, Manuka Health, Nature Nate's, New Zealand Honey Co., Rowse, Y.S. Organic Bee Farms, and Others.
Creamed Honey Market Dynamics
Creamed Honey Market Trend: Increased Preference for Natural and Healthy Sweeteners
One prominent market trend in the creamed honey market is the increased preference for natural and healthy sweeteners. Consumers are becoming more conscious of their sugar intake and are opting for alternatives that offer nutritional benefits along with sweetness. Creamed honey, with its smooth texture and rich flavor, is gaining popularity as a healthier alternative to refined sugar and artificial sweeteners.
Creamed Honey Market Driver: Growing Interest in Locally Sourced and Artisanal Products
A significant market driver for creamed honey is the growing interest in locally sourced and artisanal products. Consumers are seeking unique and authentic food experiences, and they are willing to support local producers who offer high-quality, small-batch products like creamed honey. This demand for artisanal goods is driving the growth of specialty food markets and creating opportunities for honey producers to differentiate their offerings based on quality and origin.
Creamed Honey Market Opportunity: Diversification of Product Line and Flavors
An exciting potential opportunity in the creamed honey market lies in diversifying product lines and introducing new flavors. While traditional creamed honey is popular, there is an opportunity to innovate and cater to changing consumer preferences by offering flavored variants such as cinnamon-infused, lavender, or spicy chili creamed honey. Additionally, exploring organic and raw honey options can appeal to health-conscious consumers looking for premium honey products. By expanding the product range, creamed honey producers can capture a wider market share and attract new customer segments.
Creamed Honey Market Share Analysis: Jar segment generated the highest revenue share in the industry
In the Creamed Honey market, the "Jar" segment stands out as the largest and most dominant. Jars have been a traditional and preferred packaging option for honey products due to their convenience, easy storage, and attractive presentation. Consumers often associate jars with premium quality and authenticity, making them a popular choice for honey packaging across various retail channels. The growth of the Jar segment is further fueled by the rising demand for natural and specialty honey products, including creamed honey variants. Creamed honey, known for its smooth and spreadable texture, is gaining popularity among health-conscious consumers and those seeking unique flavor experiences. As a result, the Jar segment is expected to experience continued growth, driven by increasing consumer preference for premium honey products packaged in convenient and appealing jars.
Creamed Honey Market Share Analysis: Specialty Stores is the fastest growing segment over the forecast period to 2032
Among the various applications in the Creamed Honey market, the "Specialty Stores" segment is experiencing significant and rapid growth, making it the fastest-growing segment to 2032. Specialty stores cater to a niche market of discerning consumers who prioritize high-quality, artisanal, and unique food products like creamed honey. These stores often curate a diverse range of premium honey products, including different flavors and packaging options, to meet the evolving preferences of their clientele. The growth of the Specialty Stores segment is propelled by the increasing demand for specialty and gourmet food items, driven by factors such as health consciousness, desire for natural and organic products, and a growing interest in unique flavor profiles. As consumers seek out exclusive and distinctive honey products, specialty stores emerge as key distribution channels contributing significantly to the expansion of the creamed honey market.
Creamed Honey Market Segmentation
By Type
Bottle
Jar
Tube
Tub
Others
By Application
Supermarkets/Hypermarkets
Convenience Stores
Specialty Stores
Others
Countries Analyzed
North America (US, Canada, Mexico)
Europe (Germany, UK, France, Spain, Italy, Russia, Rest of Europe)
Asia Pacific (China, India, Japan, South Korea, Australia, South East Asia, Rest of Asia)
South America (Brazil, Argentina, Rest of South America)
Middle East and Africa (Saudi Arabia, UAE, Rest of Middle East, South Africa, Egypt, Rest of Africa)
Creamed Honey Companies Profiled in the Study
Anhui Mizhiyuan Group
Barkman Honey
Bee Maid Honey
Beeyond the Hive
Billy Bee Honey Products
Capilano Honey
Comvita
Dabur
Dalian Sangdi Honeybee
Dutch Gold
Heavenly Organics
Hi-Tech Natural Products
Langnese
Little Bee Impex
Madhava Honey
Manuka Health
Nature Nate's
New Zealand Honey Co.
Rowse
Y.S. Organic Bee Farms
*- List Not Exhaustive
Chapter 1. TABLE OF CONTENTS
Chapter 2. Introduction to Creamed Honey Market
2.1. Market Overview
2.2. Key Statistics and Report Highlights
2.3. Scope of the Comprehensive Study
2.3.1. Market Definition
2.3.2 Countries and Regions Covered
2.3.3 Research Objective
2.3.4 Units, Currency, and Conversions
2.3.5 Industry Value Chain
2.4. Key Market Segments
2.5. Key Companies
2.6. Study Period
Chapter 3. Strategic Analysis Review
3.1. Creamed Honey Pricing Analysis and Forecast
3.2. Porter’s Five Forces
3.3. Market Ecosystem
3.4. SWOT Analysis
3.5. Regulatory Scenario
3.3. Effects of Inflation, Russia-Ukraine War, moderating economic growth, and other macroeconomic factors
Chapter 4. Competitive Landscape
4.1. Market Share Analysis
4.1.1. Global Creamed Honey Market Share by Company, 2023
4.1.2. Product Offerings of Leading Creamed Honey Companies
4.2. Market Entropy
4.2.1. New Product Launches in the Industry
4.2.2. Mergers, Acquisitions, Joint ventures, and Partnerships
4.3. Key Strategies and Best Practices
Chapter 5. Global Market Projections: Best, Reference, and Low Case Scenarios
5.1. Growth Analysis- Case Scenario Definitions
5.2. Low Growth Case Scenario Forecasts
5.3. Reference Growth Case Scenario Forecasts
5.4. High Growth Case Scenario Forecasts
Chapter 6. Market Dynamics
6.1. Creamed Honey Market Drivers
6.2. Creamed Honey Market Challenges
6.6. Creamed Honey Market Opportunities
6.4. Creamed Honey Market Trends
Chapter 7. Global Creamed Honey Market Outlook Trends
7.1. Global Creamed Honey Revenue (USD Million) and CAGR (%) by Type (2021-2032)
7.2. Global Creamed Honey Revenue (USD Million) and CAGR (%) by Application (2021-2032)
7.3. Global Creamed Honey Revenue (USD Million) and CAGR (%) by Product (2021-2032)
By Type
Bottle
Jar
Tube
Tub
Others
By Application
Supermarkets/Hypermarkets
Convenience Stores
Specialty Stores
Others
Chapter 8. Global Creamed Honey Regional Analysis and Outlook
8.1. Global Creamed Honey Revenue (USD Million) By Regions (2021- 2032)
8.2. North America Creamed Honey Revenue (USD Million) by Country (2021-2032)
8.2.1. United States Creamed Honey Regional Analysis and Outlook
8.2.2. Canada Creamed Honey Regional Analysis and Outlook
8.2.3. Mexico Creamed Honey Regional Analysis and Outlook
8.3. Europe Creamed Honey Revenue (USD Million), by Country (2021-2032)
8.3.1. Germany Creamed Honey Regional Analysis and Outlook
8.3.2. France Creamed Honey Regional Analysis and Outlook
8.3.3. United Kingdom Creamed Honey Regional Analysis and Outlook
8.3.4. Spain Creamed Honey Regional Analysis and Outlook
8.3.5. Italy Creamed Honey Regional Analysis and Outlook
8.3.6. Russia Creamed Honey Regional Analysis and Outlook
8.3.7. Rest of Europe Creamed Honey Regional Analysis and Outlook
8.4. Asia Pacific Creamed Honey Revenue (USD Million) by Country (2021-2032)
8.4.1. China Creamed Honey Regional Analysis and Outlook
8.4.2. Japan Creamed Honey Regional Analysis and Outlook
8.4.3. India Creamed Honey Regional Analysis and Outlook
8.4.4. South Korea Creamed Honey Regional Analysis and Outlook
8.4.5. Australia Creamed Honey Regional Analysis and Outlook
8.4.6. South East Asia Creamed Honey Regional Analysis and Outlook
8.4.7. Rest of Asia Pacific Creamed Honey Regional Analysis and Outlook
8.5. South America Creamed Honey Revenue (USD Million), by Country (2021-2032)
8.5.1. Brazil Creamed Honey Regional Analysis and Outlook
8.5.2. Argentina Creamed Honey Regional Analysis and Outlook
8.5.3. Rest of South America Creamed Honey Regional Analysis and Outlook
8.6. Middle East and Africa Creamed Honey Revenue (USD Million) by Country (2021-2032)
8.6.1. Middle East Creamed Honey Regional Analysis and Outlook
8.6.2. Africa Creamed Honey Regional Analysis and Outlook
Chapter 9. North America Creamed Honey Analysis and Outlook
9.1. North America Creamed Honey Revenue (USD Million) by Segments (2021-2032)
9.1.1. North America Creamed Honey Revenue (USD Million) by Type (2021-2032)
9.1.2. North America Creamed Honey Revenue (USD Million) by Application (2021-2032)
9.1.3. North America Creamed Honey Revenue (USD Million) by Product (2021-2032)
By Type
Bottle
Jar
Tube
Tub
Others
By Application
Supermarkets/Hypermarkets
Convenience Stores
Specialty Stores
Others
Chapter 10. Europe Creamed Honey Analysis and Outlook
10.1. Europe Creamed Honey Revenue (USD Million), by Segments (USD Million) (2021-2032)
10.1.1. Europe Creamed Honey Revenue (USD Million) by Type (2021-2032)
10.1.2. Europe Creamed Honey Revenue (USD Million) by Application (2021-2032)
10.1.3. Europe Creamed Honey Revenue (USD Million) by Product (2021-2032)
By Type
Bottle
Jar
Tube
Tub
Others
By Application
Supermarkets/Hypermarkets
Convenience Stores
Specialty Stores
Others
Chapter 11. Asia Pacific Creamed Honey Analysis and Outlook
11.1. Asia Pacific Creamed Honey Revenue (USD Million), and Revenue (USD Million) by Segments (2021-2032)
11.1.1. Asia Pacific Creamed Honey Revenue (USD Million) by Type (2021-2032)
11.1.2. Asia Pacific Creamed Honey Revenue (USD Million) by Application (2021-2032)
11.1.3. Asia Pacific Creamed Honey Revenue (USD Million) by Product (2021-2032)
By Type
Bottle
Jar
Tube
Tub
Others
By Application
Supermarkets/Hypermarkets
Convenience Stores
Specialty Stores
Others
Chapter 12. South America Creamed Honey Analysis and Outlook
12.1. South America Creamed Honey Revenue (USD Million), by Segments (2021-2032)
12.1.1. South America Creamed Honey Revenue (USD Million) by Type (2021-2032)
12.1.2. South America Creamed Honey Revenue (USD Million) by Application (2021-2032)
12.1.3. South America Creamed Honey Revenue (USD Million) by Product (2021-2032)
By Type
Bottle
Jar
Tube
Tub
Others
By Application
Supermarkets/Hypermarkets
Convenience Stores
Specialty Stores
Others
Chapter 13. Middle East and Africa Creamed Honey Analysis and Outlook
13.1. Middle East and Africa Creamed Honey Revenue (USD Million), by Segments (2021-2032)
13.1.1. Middle East and Africa Creamed Honey Revenue (USD Million) by Type (2021-2032)
13.1.2. Middle East and Africa Creamed Honey Revenue (USD Million) by Application (2021-2032)
13.1.3. Middle East and Africa Creamed Honey Revenue (USD Million) by Product (2021-2032)
By Type
Bottle
Jar
Tube
Tub
Others
By Application
Supermarkets/Hypermarkets
Convenience Stores
Specialty Stores
Others
Chapter 14. Creamed Honey Company Profiles
14.1 Business Overview
14.2 Product Profiles
14.3 SWOT Profiles
14.5 Recent Developments
14.6 Financial Profile
List of Companies
Anhui Mizhiyuan Group
Barkman Honey
Bee Maid Honey
Beeyond the Hive
Billy Bee Honey Products
Capilano Honey
Comvita
Dabur
Dalian Sangdi Honeybee
Dutch Gold
Heavenly Organics
Hi-Tech Natural Products
Langnese
Little Bee Impex
Madhava Honey
Manuka Health
Nature Nate's
New Zealand Honey Co.
Rowse
Y.S. Organic Bee Farms
15. Methodology and Data Sources
15.1 Customization Offerings
15.2 Subscription Services
15.3 Related Reports
15.4 Publisher Expertise
LIST OF TABLES
Table 1 Market Segmentation Analysis
Table 2 Global Creamed Honey Market Share of Leading Companies, 2023
Table 3 Product Offerings of Leading Companies
Table 4 Low Growth Scenario Forecasts
Table 5 Reference Case Growth Scenario
Table 6 High Growth Case Scenario
Table 7 Global Creamed Honey Revenue (USD Million) And CAGR (%) By Type (2021-2032)
Table 8 Global Creamed Honey Revenue (USD Million) And CAGR (%) By Application (2021-2032)
Table 9 Global Creamed Honey Revenue (USD Million) And CAGR (%) By Product (2021-2032)
Table 10 Global Creamed Honey Market Revenue (USD Million) By Regions (2021-2032)
Table 11 Global Creamed Honey Market Share (%) By Regions (2021-2032)
Table 12 North America Creamed Honey Revenue (USD Million) By Country (2021-2032)
Table 13 Europe Creamed Honey Revenue (USD Million) By Country (2021-2032)
Table 14 Asia Pacific Creamed Honey Revenue (USD Million) By Country (2021-2032)
Table 15 South America Creamed Honey Revenue (USD Million) By Country (2021-2032)
Table 16 Middle East and Africa Creamed Honey Revenue (USD Million) By Region (2021-2032)
Table 17 North America Creamed Honey Revenue (USD Million) By Type (2021-2032)
Table 18 North America Creamed Honey Revenue (USD Million) By Application (2021-2032)
Table 19 North America Creamed Honey Revenue (USD Million) By Product (2021-2032)
Table 20 Europe Creamed Honey Revenue (USD Million) By Type (2021-2032)
Table 21 Europe Creamed Honey Revenue (USD Million) By Application (2021-2032)
Table 22 Europe Creamed Honey Revenue (USD Million) By Product (2021-2032)
Table 23 Asia Pacific Creamed Honey Revenue (USD Million) By Type (2021-2032)
Table 24 Asia Pacific Creamed Honey Revenue (USD Million) By Application (2021-2032)
Table 25 Asia Pacific Creamed Honey Revenue (USD Million) By Product (2021-2032)
Table 26 South America Creamed Honey Revenue (USD Million) By Type (2021-2032)
Table 27 South America Creamed Honey Revenue (USD Million) By Application (2021-2032)
Table 28 South America Creamed Honey Revenue (USD Million) By Product (2021-2032)
Table 29 Middle East and Africa Creamed Honey Revenue (USD Million) By Type (2021-2032)
Table 30 Middle East and Africa Creamed Honey Revenue (USD Million) By Application (2021-2032)
Table 31 Middle East and Africa Creamed Honey Revenue (USD Million) By Product (2021-2032)
LIST OF FIGURES
Figure 1. Market Scope
Figure 2. Pricing Forecasts Per Unit, 2023- 2032
Figure 3. Porter’s Five Forces
Figure 4. Global Creamed Honey Market Revenue (USD Million) By Regions (2021-2032)
Figure 5. Global Creamed Honey Market Share (%) By Regions (2023)
Figure 6. North America Creamed Honey Revenue (USD Million) By Country (2021-2032)
Figure 7. United States Creamed Honey Revenue (USD Million) By Country (2021-2032)
Figure 8. Canada Creamed Honey Revenue (USD Million) By Country (2021-2032)
Figure 9. Mexico Creamed Honey Revenue (USD Million) By Country (2021-2032)
Figure 10. Europe Creamed Honey Revenue (USD Million) By Country (2021-2032)
Figure 11. Germany Creamed Honey Revenue (USD Million) By Country (2021-2032)
Figure 12. France Creamed Honey Revenue (USD Million) By Country (2021-2032)
Figure 13. United Kingdom Creamed Honey Revenue (USD Million) By Country (2021-2032)
Figure 14. Spain Creamed Honey Revenue (USD Million) By Country (2021-2032)
Figure 15. Italy Creamed Honey Revenue (USD Million) By Country (2021-2032)
Figure 16. Russia Creamed Honey Revenue (USD Million) By Country (2021-2032)
Figure 17. Rest of Europe Creamed Honey Revenue (USD Million) By Country (2021-2032)
Figure 11. Asia Pacific Creamed Honey Revenue (USD Million) By Country (2021-2032)
Figure 12. China Creamed Honey Revenue (USD Million) By Country (2021-2032)
Figure 13. Japan Creamed Honey Revenue (USD Million) By Country (2021-2032)
Figure 14. India Creamed Honey Revenue (USD Million) By Country (2021-2032)
Figure 15. South Korea Creamed Honey Revenue (USD Million) By Country (2021-2032)
Figure 16. Australia Creamed Honey Revenue (USD Million) By Country (2021-2032)
Figure 17. South East Asia Creamed Honey Revenue (USD Million) By Country (2021-2032)
Figure 18. South America Creamed Honey Revenue (USD Million) By Country (2021-2032)
Figure 19. Brazil Creamed Honey Revenue (USD Million) By Country (2021-2032)
Figure 20. Argentina Creamed Honey Revenue (USD Million) By Country (2021-2032)
Figure 21. Rest of Asia Pacific Creamed Honey Revenue (USD Million) By Country (2021-2032)
Figure 22. Middle East and Africa Creamed Honey Revenue (USD Million) By Region (2021-2032)
Figure 23. Saudi Arabia Creamed Honey Revenue (USD Million) By Region (2021-2032)
Figure 24. The UAE Creamed Honey Revenue (USD Million) By Region (2021-2032)
Figure 25. Rest of Middle East Creamed Honey Revenue (USD Million) By Region (2021-2032)
Figure 26. South Africa Creamed Honey Revenue (USD Million) By Region (2021-2032)
Figure 27. Africa Creamed Honey Revenue (USD Million) By Region (2021-2032)
Figure 28. North America Creamed Honey Revenue (USD Million) By Type (2021-2032)
Figure 29. North America Creamed Honey Revenue (USD Million) By Application (2021-2032)
Figure 30. North America Creamed Honey Revenue (USD Million) By Product (2021-2032)
Figure 31. Europe Creamed Honey Revenue (USD Million) By Type (2021-2032)
Figure 32. Europe Creamed Honey Revenue (USD Million) By Application (2021-2032)
Figure 33. Europe Creamed Honey Revenue (USD Million) By Product (2021-2032)
Figure 34. Asia Pacific Creamed Honey Revenue (USD Million) By Type (2021-2032)
Figure 35. Asia Pacific Creamed Honey Revenue (USD Million) By Application (2021-2032)
Figure 36. Asia Pacific Creamed Honey Revenue (USD Million) By Product (2021-2032)
Figure 37. South America Creamed Honey Revenue (USD Million) By Type (2021-2032)
Figure 38. South America Creamed Honey Revenue (USD Million) By Application (2021-2032)
Figure 39. South America Creamed Honey Revenue (USD Million) By Product (2021-2032)
Figure 40. Middle East and Africa Creamed Honey Revenue (USD Million) By Type (2021-2032)
Figure 41. Middle East and Africa Creamed Honey Revenue (USD Million) By Application (2021-2032)
Figure 42. Middle East and Africa Creamed Honey Revenue (USD Million) By Product (2021-2032)
By Type
Bottle
Jar
Tube
Tub
Others
By Application
Supermarkets/Hypermarkets
Convenience Stores
Specialty Stores
Others
Countries Analyzed
North America (US, Canada, Mexico)
Europe (Germany, UK, France, Spain, Italy, Russia, Rest of Europe)
Asia Pacific (China, India, Japan, South Korea, Australia, South East Asia, Rest of Asia)
South America (Brazil, Argentina, Rest of South America)
Middle East and Africa (Saudi Arabia, UAE, Rest of Middle East, South Africa, Egypt, Rest of Africa)
