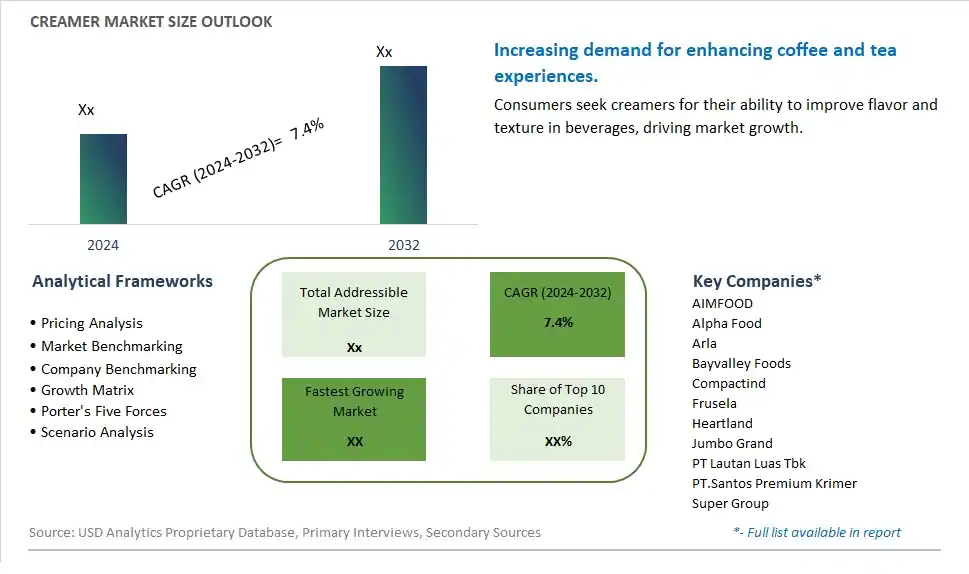
Global Creamer Market Size is valued at $XX Million in 2024 and is forecast to register a growth rate (CAGR) of 7.4% to reach $XX Million by 2032.
The global Creamer Market Comprehensive Study analyzes and forecasts the market size across 6 regions and 24 countries for diverse segments -By Type (Dairy, Non-Dairy), By Form (Powder, Liquid), By Application (Residential, Commercial, Cafes and Cafeteria, Hotels and Restaurants, Others), By Sales Channel (Hypermarkets/Supermarkets, Modern Grocery Stores, Specialty Stores, Convenience Stores, Online Retail, Others)
An Introduction to Creamer Market
The Creamer market in 2024 is expanding steadily, driven by the increasing demand for convenient and high-quality coffee and tea additives. Creamers, available in dairy and non-dairy options, are used to add creaminess and flavor to beverages. The market is supported by the growing trend towards premium and specialty coffee and tea experiences. Advances in formulation and packaging technologies are enhancing the quality, flavor, and shelf life of creamers. The market is also benefiting from the trend towards clean-label, plant-based, and functional creamers, appealing to health-conscious consumers seeking versatile and nutritious beverage enhancers.
Creamer Competitive Landscape
The market report analyses the leading companies in the industry including AIMFOOD, Alpha Food, Arla, Bayvalley Foods, Compactind, Frusela, Heartland, Jumbo Grand, PT Lautan Luas Tbk, PT.Santos Premium Krimer, Super Group, and Others.
Creamer Market Dynamics
Creamer Market Trend: Shift Towards Plant-Based and Non-Dairy Creamers
One prominent market trend in the creamer market is the shift towards plant-based and non-dairy creamers. With an increasing number of consumers adopting vegan or lactose-free diets, there is a growing demand for creamers made from plant-based ingredients such as almond, coconut, soy, or oat milk. This trend is driven by health-conscious consumers seeking alternatives to traditional dairy products.
Creamer Market Driver: Convenience and Customization
A significant market driver for creamers is the emphasis on convenience and customization. Busy lifestyles and on-the-go consumption habits have led consumers to prefer convenient options that can be easily added to coffee, tea, or other beverages. Additionally, the desire for personalized experiences has fueled the demand for creamers with various flavors, textures, and nutritional profiles, allowing consumers to tailor their beverages to their preferences.
Creamer Market Opportunity: Expansion into Functional and Health-Enhancing Creamers
An exciting potential opportunity in the creamer market lies in expanding into functional and health-enhancing creamers. With growing awareness of functional ingredients and their benefits, there is a market for creamers fortified with vitamins, minerals, antioxidants, or other health-boosting additives. Additionally, incorporating ingredients like collagen, probiotics, or adaptogens into creamers can attract health-conscious consumers looking for added wellness benefits in their beverages. By tapping into this trend, creamer manufacturers can differentiate their products and capture a niche market segment focused on health and functionality.
Creamer Market Share Analysis: Non-Dairy Creamers segment generated the highest revenue share in the industry
In the Creamer market segmentation, the "Non-Dairy" segment stands out as the largest and most dominant category. Non-dairy creamers have witnessed a remarkable surge in demand globally due to various factors such as lactose intolerance, vegan preferences, and health-conscious choices. This segment encompasses a wide range of plant-based alternatives such as soy, almond, coconut, and oat creamers, among others. The fast growth of non-dairy creamers is attributed to their ability to mimic the taste and texture of traditional dairy creamers while offering additional benefits like cholesterol-free options, lower calorie content, and suitability for a diverse range of dietary preferences. Further, the increasing availability of innovative flavors and formulations in non-dairy creamers has further fueled their popularity among consumers, leading to their substantial market share within the creamer industry.
Creamer Market Share Analysis: Liquid Creamers is the fastest growing segment over the forecast period to 2032
Within the Creamer market, the "Liquid" segment emerges as the fastest-growing category projected to experience significant expansion by 2032. Liquid creamers have gained traction due to their convenience, versatility, and ability to blend seamlessly with various beverages like coffee, tea, and hot chocolate. The fast-paced lifestyles of modern consumers have led to an increased preference for ready-to-use liquid creamers, offering a quick and hassle-free way to enhance the flavor and texture of their favorite drinks. Furthermore, the liquid format allows for easier customization and flavor variations, catering to evolving consumer preferences for unique taste experiences. As a result, the liquid creamer segment is poised for substantial growth as it continues to capture market share and adapt to changing consumer demands in the creamer industry.
Creamer Market Share Analysis: Commercial Creamers segment generated the highest revenue share in the industry
The "Commercial" segment stands out as the largest within the Creamer market, showcasing robust growth and maintaining a dominant position in terms of market share. This segment caters primarily to establishments such as cafes, cafeterias, hotels, restaurants, and other foodservice businesses. The steady rise in the foodservice industry, driven by increased consumer spending on dining out and the growing trend of convenience-driven food and beverage consumption, has contributed significantly to the expansion of commercial creamer usage. Further, the demand for high-quality and customizable creamer options in commercial settings further propels the growth of this segment. As businesses strive to enhance their offerings and provide a diverse range of beverages to meet customer expectations, commercial creamers play a crucial role in delivering consistency, flavor variety, and convenience. Therefore, the commercial creamer segment is expected to maintain its strong position and continue its upward trajectory in the foreseeable future.
Creamer Market Share Analysis: Online Retail is the fastest growing segment over the forecast period to 2032
The "Online Retail" segment emerges as the fastest-growing sector within the Creamer market, showcasing impressive growth rates as consumers increasingly turn to online platforms for their shopping needs. With the convenience, accessibility, and wide variety of options offered by online retail channels, more consumers are opting to purchase creamers online. This trend is fueled by factors such as the growing digitalization of retail, the convenience of doorstep delivery, and the availability of specialized and niche creamer products that may not be easily found in physical stores. Furthermore, the global shift towards e-commerce, especially accelerated by the Past few years, has significantly contributed to the rapid expansion of the online retail creamer segment. As online shopping continues to gain traction across demographics, including busy professionals, tech-savvy millennials, and health-conscious consumers, the online retail segment is poised for continued robust growth and market penetration in the coming years.
Creamer Market Segmentation
By Type
Dairy
Non-Dairy
By Form
Powder
Liquid
By Application
Residential
Commercial
Cafes and Cafeteria
Hotels and Restaurants
Others
By Sales Channel
Hypermarkets/Supermarkets
Modern Grocery Stores
Specialty Stores
Convenience Stores
Online Retail
Others
Countries Analyzed
North America (US, Canada, Mexico)
Europe (Germany, UK, France, Spain, Italy, Russia, Rest of Europe)
Asia Pacific (China, India, Japan, South Korea, Australia, South East Asia, Rest of Asia)
South America (Brazil, Argentina, Rest of South America)
Middle East and Africa (Saudi Arabia, UAE, Rest of Middle East, South Africa, Egypt, Rest of Africa)
Creamer Companies Profiled in the Study
AIMFOOD
Alpha Food
Arla
Bayvalley Foods
Compactind
Frusela
Heartland
Jumbo Grand
PT Lautan Luas Tbk
PT.Santos Premium Krimer
Super Group
*- List Not Exhaustive
Chapter 1. TABLE OF CONTENTS
Chapter 2. Introduction to Creamer Market
2.1. Market Overview
2.2. Key Statistics and Report Highlights
2.3. Scope of the Comprehensive Study
2.3.1. Market Definition
2.3.2 Countries and Regions Covered
2.3.3 Research Objective
2.3.4 Units, Currency, and Conversions
2.3.5 Industry Value Chain
2.4. Key Market Segments
2.5. Key Companies
2.6. Study Period
Chapter 3. Strategic Analysis Review
3.1. Creamer Pricing Analysis and Forecast
3.2. Porter’s Five Forces
3.3. Market Ecosystem
3.4. SWOT Analysis
3.5. Regulatory Scenario
3.3. Effects of Inflation, Russia-Ukraine War, moderating economic growth, and other macroeconomic factors
Chapter 4. Competitive Landscape
4.1. Market Share Analysis
4.1.1. Global Creamer Market Share by Company, 2023
4.1.2. Product Offerings of Leading Creamer Companies
4.2. Market Entropy
4.2.1. New Product Launches in the Industry
4.2.2. Mergers, Acquisitions, Joint ventures, and Partnerships
4.3. Key Strategies and Best Practices
Chapter 5. Global Market Projections: Best, Reference, and Low Case Scenarios
5.1. Growth Analysis- Case Scenario Definitions
5.2. Low Growth Case Scenario Forecasts
5.3. Reference Growth Case Scenario Forecasts
5.4. High Growth Case Scenario Forecasts
Chapter 6. Market Dynamics
6.1. Creamer Market Drivers
6.2. Creamer Market Challenges
6.6. Creamer Market Opportunities
6.4. Creamer Market Trends
Chapter 7. Global Creamer Market Outlook Trends
7.1. Global Creamer Revenue (USD Million) and CAGR (%) by Type (2021-2032)
7.2. Global Creamer Revenue (USD Million) and CAGR (%) by Application (2021-2032)
7.3. Global Creamer Revenue (USD Million) and CAGR (%) by Product (2021-2032)
By Type
Dairy
Non-Dairy
By Form
Powder
Liquid
By Application
Residential
Commercial
Cafes and Cafeteria
Hotels and Restaurants
Others
By Sales Channel
Hypermarkets/Supermarkets
Modern Grocery Stores
Specialty Stores
Convenience Stores
Online Retail
Others
Chapter 8. Global Creamer Regional Analysis and Outlook
8.1. Global Creamer Revenue (USD Million) By Regions (2021- 2032)
8.2. North America Creamer Revenue (USD Million) by Country (2021-2032)
8.2.1. United States Creamer Regional Analysis and Outlook
8.2.2. Canada Creamer Regional Analysis and Outlook
8.2.3. Mexico Creamer Regional Analysis and Outlook
8.3. Europe Creamer Revenue (USD Million), by Country (2021-2032)
8.3.1. Germany Creamer Regional Analysis and Outlook
8.3.2. France Creamer Regional Analysis and Outlook
8.3.3. United Kingdom Creamer Regional Analysis and Outlook
8.3.4. Spain Creamer Regional Analysis and Outlook
8.3.5. Italy Creamer Regional Analysis and Outlook
8.3.6. Russia Creamer Regional Analysis and Outlook
8.3.7. Rest of Europe Creamer Regional Analysis and Outlook
8.4. Asia Pacific Creamer Revenue (USD Million) by Country (2021-2032)
8.4.1. China Creamer Regional Analysis and Outlook
8.4.2. Japan Creamer Regional Analysis and Outlook
8.4.3. India Creamer Regional Analysis and Outlook
8.4.4. South Korea Creamer Regional Analysis and Outlook
8.4.5. Australia Creamer Regional Analysis and Outlook
8.4.6. South East Asia Creamer Regional Analysis and Outlook
8.4.7. Rest of Asia Pacific Creamer Regional Analysis and Outlook
8.5. South America Creamer Revenue (USD Million), by Country (2021-2032)
8.5.1. Brazil Creamer Regional Analysis and Outlook
8.5.2. Argentina Creamer Regional Analysis and Outlook
8.5.3. Rest of South America Creamer Regional Analysis and Outlook
8.6. Middle East and Africa Creamer Revenue (USD Million) by Country (2021-2032)
8.6.1. Middle East Creamer Regional Analysis and Outlook
8.6.2. Africa Creamer Regional Analysis and Outlook
Chapter 9. North America Creamer Analysis and Outlook
9.1. North America Creamer Revenue (USD Million) by Segments (2021-2032)
9.1.1. North America Creamer Revenue (USD Million) by Type (2021-2032)
9.1.2. North America Creamer Revenue (USD Million) by Application (2021-2032)
9.1.3. North America Creamer Revenue (USD Million) by Product (2021-2032)
By Type
Dairy
Non-Dairy
By Form
Powder
Liquid
By Application
Residential
Commercial
Cafes and Cafeteria
Hotels and Restaurants
Others
By Sales Channel
Hypermarkets/Supermarkets
Modern Grocery Stores
Specialty Stores
Convenience Stores
Online Retail
Others
Chapter 10. Europe Creamer Analysis and Outlook
10.1. Europe Creamer Revenue (USD Million), by Segments (USD Million) (2021-2032)
10.1.1. Europe Creamer Revenue (USD Million) by Type (2021-2032)
10.1.2. Europe Creamer Revenue (USD Million) by Application (2021-2032)
10.1.3. Europe Creamer Revenue (USD Million) by Product (2021-2032)
By Type
Dairy
Non-Dairy
By Form
Powder
Liquid
By Application
Residential
Commercial
Cafes and Cafeteria
Hotels and Restaurants
Others
By Sales Channel
Hypermarkets/Supermarkets
Modern Grocery Stores
Specialty Stores
Convenience Stores
Online Retail
Others
Chapter 11. Asia Pacific Creamer Analysis and Outlook
11.1. Asia Pacific Creamer Revenue (USD Million), and Revenue (USD Million) by Segments (2021-2032)
11.1.1. Asia Pacific Creamer Revenue (USD Million) by Type (2021-2032)
11.1.2. Asia Pacific Creamer Revenue (USD Million) by Application (2021-2032)
11.1.3. Asia Pacific Creamer Revenue (USD Million) by Product (2021-2032)
By Type
Dairy
Non-Dairy
By Form
Powder
Liquid
By Application
Residential
Commercial
Cafes and Cafeteria
Hotels and Restaurants
Others
By Sales Channel
Hypermarkets/Supermarkets
Modern Grocery Stores
Specialty Stores
Convenience Stores
Online Retail
Others
Chapter 12. South America Creamer Analysis and Outlook
12.1. South America Creamer Revenue (USD Million), by Segments (2021-2032)
12.1.1. South America Creamer Revenue (USD Million) by Type (2021-2032)
12.1.2. South America Creamer Revenue (USD Million) by Application (2021-2032)
12.1.3. South America Creamer Revenue (USD Million) by Product (2021-2032)
By Type
Dairy
Non-Dairy
By Form
Powder
Liquid
By Application
Residential
Commercial
Cafes and Cafeteria
Hotels and Restaurants
Others
By Sales Channel
Hypermarkets/Supermarkets
Modern Grocery Stores
Specialty Stores
Convenience Stores
Online Retail
Others
Chapter 13. Middle East and Africa Creamer Analysis and Outlook
13.1. Middle East and Africa Creamer Revenue (USD Million), by Segments (2021-2032)
13.1.1. Middle East and Africa Creamer Revenue (USD Million) by Type (2021-2032)
13.1.2. Middle East and Africa Creamer Revenue (USD Million) by Application (2021-2032)
13.1.3. Middle East and Africa Creamer Revenue (USD Million) by Product (2021-2032)
By Type
Dairy
Non-Dairy
By Form
Powder
Liquid
By Application
Residential
Commercial
Cafes and Cafeteria
Hotels and Restaurants
Others
By Sales Channel
Hypermarkets/Supermarkets
Modern Grocery Stores
Specialty Stores
Convenience Stores
Online Retail
Others
Chapter 14. Creamer Company Profiles
14.1 Business Overview
14.2 Product Profiles
14.3 SWOT Profiles
14.5 Recent Developments
14.6 Financial Profile
List of Companies
AIMFOOD
Alpha Food
Arla
Bayvalley Foods
Compactind
Frusela
Heartland
Jumbo Grand
PT Lautan Luas Tbk
PT.Santos Premium Krimer
Super Group
15. Methodology and Data Sources
15.1 Customization Offerings
15.2 Subscription Services
15.3 Related Reports
15.4 Publisher Expertise
LIST OF TABLES
Table 1 Market Segmentation Analysis
Table 2 Global Creamer Market Share of Leading Companies, 2023
Table 3 Product Offerings of Leading Companies
Table 4 Low Growth Scenario Forecasts
Table 5 Reference Case Growth Scenario
Table 6 High Growth Case Scenario
Table 7 Global Creamer Revenue (USD Million) And CAGR (%) By Type (2021-2032)
Table 8 Global Creamer Revenue (USD Million) And CAGR (%) By Application (2021-2032)
Table 9 Global Creamer Revenue (USD Million) And CAGR (%) By Product (2021-2032)
Table 10 Global Creamer Market Revenue (USD Million) By Regions (2021-2032)
Table 11 Global Creamer Market Share (%) By Regions (2021-2032)
Table 12 North America Creamer Revenue (USD Million) By Country (2021-2032)
Table 13 Europe Creamer Revenue (USD Million) By Country (2021-2032)
Table 14 Asia Pacific Creamer Revenue (USD Million) By Country (2021-2032)
Table 15 South America Creamer Revenue (USD Million) By Country (2021-2032)
Table 16 Middle East and Africa Creamer Revenue (USD Million) By Region (2021-2032)
Table 17 North America Creamer Revenue (USD Million) By Type (2021-2032)
Table 18 North America Creamer Revenue (USD Million) By Application (2021-2032)
Table 19 North America Creamer Revenue (USD Million) By Product (2021-2032)
Table 20 Europe Creamer Revenue (USD Million) By Type (2021-2032)
Table 21 Europe Creamer Revenue (USD Million) By Application (2021-2032)
Table 22 Europe Creamer Revenue (USD Million) By Product (2021-2032)
Table 23 Asia Pacific Creamer Revenue (USD Million) By Type (2021-2032)
Table 24 Asia Pacific Creamer Revenue (USD Million) By Application (2021-2032)
Table 25 Asia Pacific Creamer Revenue (USD Million) By Product (2021-2032)
Table 26 South America Creamer Revenue (USD Million) By Type (2021-2032)
Table 27 South America Creamer Revenue (USD Million) By Application (2021-2032)
Table 28 South America Creamer Revenue (USD Million) By Product (2021-2032)
Table 29 Middle East and Africa Creamer Revenue (USD Million) By Type (2021-2032)
Table 30 Middle East and Africa Creamer Revenue (USD Million) By Application (2021-2032)
Table 31 Middle East and Africa Creamer Revenue (USD Million) By Product (2021-2032)
LIST OF FIGURES
Figure 1. Market Scope
Figure 2. Pricing Forecasts Per Unit, 2023- 2032
Figure 3. Porter’s Five Forces
Figure 4. Global Creamer Market Revenue (USD Million) By Regions (2021-2032)
Figure 5. Global Creamer Market Share (%) By Regions (2023)
Figure 6. North America Creamer Revenue (USD Million) By Country (2021-2032)
Figure 7. United States Creamer Revenue (USD Million) By Country (2021-2032)
Figure 8. Canada Creamer Revenue (USD Million) By Country (2021-2032)
Figure 9. Mexico Creamer Revenue (USD Million) By Country (2021-2032)
Figure 10. Europe Creamer Revenue (USD Million) By Country (2021-2032)
Figure 11. Germany Creamer Revenue (USD Million) By Country (2021-2032)
Figure 12. France Creamer Revenue (USD Million) By Country (2021-2032)
Figure 13. United Kingdom Creamer Revenue (USD Million) By Country (2021-2032)
Figure 14. Spain Creamer Revenue (USD Million) By Country (2021-2032)
Figure 15. Italy Creamer Revenue (USD Million) By Country (2021-2032)
Figure 16. Russia Creamer Revenue (USD Million) By Country (2021-2032)
Figure 17. Rest of Europe Creamer Revenue (USD Million) By Country (2021-2032)
Figure 11. Asia Pacific Creamer Revenue (USD Million) By Country (2021-2032)
Figure 12. China Creamer Revenue (USD Million) By Country (2021-2032)
Figure 13. Japan Creamer Revenue (USD Million) By Country (2021-2032)
Figure 14. India Creamer Revenue (USD Million) By Country (2021-2032)
Figure 15. South Korea Creamer Revenue (USD Million) By Country (2021-2032)
Figure 16. Australia Creamer Revenue (USD Million) By Country (2021-2032)
Figure 17. South East Asia Creamer Revenue (USD Million) By Country (2021-2032)
Figure 18. South America Creamer Revenue (USD Million) By Country (2021-2032)
Figure 19. Brazil Creamer Revenue (USD Million) By Country (2021-2032)
Figure 20. Argentina Creamer Revenue (USD Million) By Country (2021-2032)
Figure 21. Rest of Asia Pacific Creamer Revenue (USD Million) By Country (2021-2032)
Figure 22. Middle East and Africa Creamer Revenue (USD Million) By Region (2021-2032)
Figure 23. Saudi Arabia Creamer Revenue (USD Million) By Region (2021-2032)
Figure 24. The UAE Creamer Revenue (USD Million) By Region (2021-2032)
Figure 25. Rest of Middle East Creamer Revenue (USD Million) By Region (2021-2032)
Figure 26. South Africa Creamer Revenue (USD Million) By Region (2021-2032)
Figure 27. Africa Creamer Revenue (USD Million) By Region (2021-2032)
Figure 28. North America Creamer Revenue (USD Million) By Type (2021-2032)
Figure 29. North America Creamer Revenue (USD Million) By Application (2021-2032)
Figure 30. North America Creamer Revenue (USD Million) By Product (2021-2032)
Figure 31. Europe Creamer Revenue (USD Million) By Type (2021-2032)
Figure 32. Europe Creamer Revenue (USD Million) By Application (2021-2032)
Figure 33. Europe Creamer Revenue (USD Million) By Product (2021-2032)
Figure 34. Asia Pacific Creamer Revenue (USD Million) By Type (2021-2032)
Figure 35. Asia Pacific Creamer Revenue (USD Million) By Application (2021-2032)
Figure 36. Asia Pacific Creamer Revenue (USD Million) By Product (2021-2032)
Figure 37. South America Creamer Revenue (USD Million) By Type (2021-2032)
Figure 38. South America Creamer Revenue (USD Million) By Application (2021-2032)
Figure 39. South America Creamer Revenue (USD Million) By Product (2021-2032)
Figure 40. Middle East and Africa Creamer Revenue (USD Million) By Type (2021-2032)
Figure 41. Middle East and Africa Creamer Revenue (USD Million) By Application (2021-2032)
Figure 42. Middle East and Africa Creamer Revenue (USD Million) By Product (2021-2032)
By Type
Dairy
Non-Dairy
By Form
Powder
Liquid
By Application
Residential
Commercial
Cafes and Cafeteria
Hotels and Restaurants
Others
By Sales Channel
Hypermarkets/Supermarkets
Modern Grocery Stores
Specialty Stores
Convenience Stores
Online Retail
Others
Countries Analyzed
North America (US, Canada, Mexico)
Europe (Germany, UK, France, Spain, Italy, Russia, Rest of Europe)
Asia Pacific (China, India, Japan, South Korea, Australia, South East Asia, Rest of Asia)
South America (Brazil, Argentina, Rest of South America)
Middle East and Africa (Saudi Arabia, UAE, Rest of Middle East, South Africa, Egypt, Rest of Africa)
