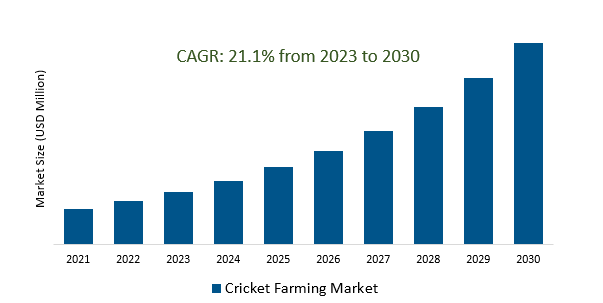
The Global Cricket Farming Market Size is estimated to register 21.1% growth over the forecast period from 2023 to 2030.
The market growth is driven by an increasing health consciousness among consumers is driving the demand for alternative protein sources, including crickets. Cricket-based products are not only rich in protein but also contain essential nutrients such as iron, vitamin B12, and omega-3 fatty acids. This trend is bolstered by an increasing emphasis on clean-label, natural, and minimally processed foods. Leading Companies focusing on Medical and Nutraceutical Applications, Pet Food and Animal Feed, Educational and Outreach Programs, and others to boost market shares in the industry.
Market Overview
The cricket farming market is a burgeoning industry driven by the demand for sustainable protein sources, innovative product development, and regulatory support. Consumers are increasingly turning to cricket-based products due to their eco-friendly and nutritious attributes. This trend is accompanied by the expansion of cricket-based food offerings, culinary innovation, and growing health awareness. Cricket farming's lower environmental footprint and efficient supply chain optimization are contributing to its growth. Moreover, international trade opportunities and a focus on expanding the market globally further underpin the industry's prospects.
Market Dynamics
Market Trends- Crickets offer a promising and environmentally friendly alternative to traditional protein sources, addressing the growing global demand for sustainable food production.
Crickets are gaining recognition as an eco-friendly protein source, offering a sustainable solution to the increasing global demand for food. Cricket farming, with its low environmental impact and high nutritional value, is redefining food production. This article explores the ecological benefits of cricket farming and its potential to alleviate the strain on traditional agriculture, emphasizing how crickets are leading the way in creating a more sustainable and environmentally responsible approach to feeding a growing world population.
Market Driver- The development of innovative cricket-based products, such as protein powders, snacks, and pet food, is fueling the expansion of the cricket farming market.
In response to the global demand for sustainable food, the cricket farming market is experiencing growth driven by the development of innovative cricket-based products, including protein powders, snacks, and even pet food. These products are reshaping the food industry, offering delicious, nutritious, and environmentally responsible alternatives. As consumers seek sustainable food choices, cricket-based options are becoming a promising and diverse sector, meeting both human and pet dietary needs, and contributing to a more eco-conscious future of food production.
Market Opportunity- The development of robust regulatory frameworks and certification standards is crucial for ensuring the safety and quality of cricket-based products and fostering consumer trust, thereby driving the growth of the cricket farming market.
Robust regulatory frameworks and certification standards are indispensable in the cricket farming market, ensuring the safety and quality of cricket-based products, thus bolstering consumer trust and propelling market growth. This article emphasizes the pivotal role of regulations in upholding product integrity, from cricket cultivation to cricket flour production, underscoring their significance in fostering a reliable and sustainable cricket farming industry. Regulations are not hindrances but catalysts for a responsible and trustworthy future of cricket-based food.
Market Share Analysis- Protein Powder Cricket Farming Market will register the fastest growth
The Global Cricket Farming Market is analyzed across Protein Powder, Animal Feed, Cricket Protein Bars, Frozen Crickets, and others. Protein Powder is poised to register the fastest growth. The protein powder cricket farming market is a specialized sector within cricket farming, focusing on producing protein powders derived from crickets. These powders are used in dietary supplements, protein shakes, and nutritional products. As the demand for sustainable and nutritious protein sources grows, this market is gaining prominence, offering a versatile and eco-friendly option for incorporating cricket-based protein into various products. It represents a segment of the cricket farming industry poised for further growth and innovation.
Market Share Analysis- Human Food and Beverages held a significant market share in 2023
The Global Cricket Farming Market is analyzed across various Organizations including Animal Feed and Pet Food Products, Human Food and Beverages, and others. Of these, Human Food and Beverages held a significant market share in 2023. The human food and beverages cricket farming market is dedicated to producing cricket-based food and beverage products for human consumption. This market offers sustainable and nutritious protein sources in response to the growing demand for eco-friendly alternatives. It includes a wide range of products like protein bars, snacks, baked goods, and cricket flour. As consumers increasingly recognize the environmental advantages of cricket farming, this market is experiencing growth and diversification to meet the demand for more sustainable and health-conscious food options.
Cricket Farming Market News
Bisk Farm has introduced a cricket campaign starring Sourav Ganguly, who serves as the brand ambassador for Bisk Farm Rich Marie biscuits. This campaign honors the passionate fans who play a significant role in the success of the Indian cricket team. The campaign prominently features Sourav Ganguly recreating his iconic jersey-waving gesture.
Major League Cricket Set to Debut in July, Bringing Professional Cricket to the U.S., Including San Francisco Team - K QED's Holly J. McDede Reports
Cricket Farming Market Segmentation
By Type
- Protein Powder
- Animal Feed
- Cricket Protein Bars
- Frozen Crickets
- Others
By Application
- Animal Feed and Pet Food Products
- Human Food and Beverages
By Region
- North America (United States, Canada, Mexico)
- Europe (Germany, France, United Kingdom, Spain, Italy, Others)
- Asia Pacific (China, India, Japan, South Korea, Australia, Others)
- Latin America (Brazil, Argentina, Others)
- Middle East and Africa (Saudi Arabia, UAE, Kuwait, Other Middle East, South Africa, Nigeria, Other Africa)
Cricket Farming Market Companies
- Entomo Farms
- All Things Bugs
- Aspire Food Group
- Global Bugs Asia
- Armstrong Cricket Farm Georgia
- EIT Food
- Cricket Lab
- JR Unique Foods
- Protix
- Entogama
- EntoCube OY
*List not exhaustive
Cricket Farming Market Outlook 2023
1 Market Overview
1.1 Introduction to the Cricket Farming Market
1.2 Scope of the Study
1.3 Research Objective
1.3.1 Key Market Scope and Segments
1.3.2 Players Covered
1.3.3 Years Considered
2 Executive Summary
2.1 2023 Cricket Farming Industry- Market Statistics
3 Market Dynamics
3.1 Market Drivers
3.2 Market Challenges
3.3 Market Opportunities
3.4 Market Trends
4 Market Factor Analysis
4.1 Porter’s Five Forces
4.2 Market Entropy
4.2.1 Global Cricket Farming Market Companies with Area Served
4.2.2 Products Offerings Global Cricket Farming Market
5 COVID-19 Impact Analysis and Outlook Scenarios
5.1.1 Covid-19 Impact Analysis
5.1.2 post-COVID-19 Scenario- Low Growth Case
5.1.3 post-COVID-19 Scenario- Reference Growth Case
5.1.4 post-COVID-19 Scenario- Low Growth Case
6 Global Cricket Farming Market Trends
6.1 Global Cricket Farming Revenue (USD Million) and CAGR (%) by Type (2018-2030)
6.2 Global Cricket Farming Revenue (USD Million) and CAGR (%) by Applications (2018-2030)
6.3 Global Cricket Farming Revenue (USD Million) and CAGR (%) by regions (2018-2030)
7 Global Cricket Farming Market Revenue (USD Million) by Type, and Applications (2018-2022)
7.1 Global Cricket Farming Revenue (USD Million) by Type (2018-2022)
7.1.1 Global Cricket Farming Revenue (USD Million), Market Share (%) by Type (2018-2022)
7.2 Global Cricket Farming Revenue (USD Million) by Applications (2018-2022)
7.2.1 Global Cricket Farming Revenue (USD Million), Market Share (%) by Applications (2018-2022)
8 Global Cricket Farming Development Regional Status and Outlook
8.1 Global Cricket Farming Revenue (USD Million) By Regions (2018-2022)
8.2 North America Cricket Farming Revenue (USD Million) by Type, and Application (2018-2022)
8.2.1 North America Cricket Farming Revenue (USD Million) by Country (2018-2022)
8.2.2 North America Cricket Farming Revenue (USD Million) by Type (2018-2022)
8.2.3 North America Cricket Farming Revenue (USD Million) by Applications (2018-2022)
8.3 Europe Cricket Farming Revenue (USD Million), by Type, and Applications (USD Million) (2018-2022)
8.3.1 Europe Cricket Farming Revenue (USD Million), by Country (2018-2022)
8.3.2 Europe Cricket Farming Revenue (USD Million) by Type (2018-2022)
8.3.3 Europe Cricket Farming Revenue (USD Million) by Applications (2018-2022)
8.4 Asia Pacific Cricket Farming Revenue (USD Million), and Revenue (USD Million) by Type, and Applications (2018-2022)
8.4.1 Asia Pacific Cricket Farming Revenue (USD Million) by Country (2018-2022)
8.4.2 Asia Pacific Cricket Farming Revenue (USD Million) by Type (2018-2022)
8.4.3 Asia Pacific Cricket Farming Revenue (USD Million) by Applications (2018-2022)
8.5 South America Cricket Farming Revenue (USD Million), by Type, and Applications (2018-2022)
8.5.1 South America Cricket Farming Revenue (USD Million), by Country (2018-2022)
8.5.2 South America Cricket Farming Revenue (USD Million) by Type (2018-2022)
8.5.3 South America Cricket Farming Revenue (USD Million) by Applications (2018-2022)
8.6 Middle East and Africa Cricket Farming Revenue (USD Million), by Type, Technology, Application, Thickness (2018-2022)
8.6.1 Middle East and Africa Cricket Farming Revenue (USD Million) by Country (2018-2022)
8.6.2 Middle East and Africa Cricket Farming Revenue (USD Million) by Type (2018-2022)
8.6.3 Middle East and Africa Cricket Farming Revenue (USD Million) by Applications (2018-2022)
9 Company Profiles
10 Global Cricket Farming Market Revenue (USD Million), by Type, and Applications (2023-2030)
10.1 Global Cricket Farming Revenue (USD Million) and Market Share (%) by Type (2023-2030)
10.1.1 Global Cricket Farming Revenue (USD Million), and Market Share (%) by Type (2023-2030)
10.2 Global Cricket Farming Revenue (USD Million) and Market Share (%) by Applications (2023-2030)
10.2.1 Global Cricket Farming Revenue (USD Million), and Market Share (%) by Applications (2023-2030)
11 Global Cricket Farming Development Regional Status and Outlook Forecast
11.1 Global Cricket Farming Revenue (USD Million) By Regions (2023-2030)
11.2 North America Cricket Farming Revenue (USD Million) by Type, and Applications (2023-2030)
11.2.1 North America Cricket Farming Revenue (USD) Million by Country (2023-2030)
11.2.2 North America Cricket Farming Revenue (USD Million), by Type (2023-2030)
11.2.3 North America Cricket Farming Revenue (USD Million), Market Share (%) by Applications (2023-2030)
11.3 Europe Cricket Farming Revenue (USD Million), by Type, and Applications (2023-2030)
11.3.1 Europe Cricket Farming Revenue (USD Million), by Country (2023-2030)
11.3.2 Europe Cricket Farming Revenue (USD Million), by Type (2023-2030)
11.3.3 Europe Cricket Farming Revenue (USD Million), by Applications (2023-2030)
11.4 Asia Pacific Cricket Farming Revenue (USD Million) by Type, and Applications (2023-2030)
11.4.1 Asia Pacific Cricket Farming Revenue (USD Million), by Country (2023-2030)
11.4.2 Asia Pacific Cricket Farming Revenue (USD Million), by Type (2023-2030)
11.4.3 Asia Pacific Cricket Farming Revenue (USD Million), by Applications (2023-2030)
11.5 South America Cricket Farming Revenue (USD Million), by Type, and Applications (2023-2030)
11.5.1 South America Cricket Farming Revenue (USD Million), by Country (2023-2030)
11.5.2 South America Cricket Farming Revenue (USD Million), by Type (2023-2030)
11.5.3 South America Cricket Farming Revenue (USD Million), by Applications (2023-2030)
11.6 Middle East and Africa Cricket Farming Revenue (USD Million), by Type, and Applications (2023-2030)
11.6.1 Middle East and Africa Cricket Farming Revenue (USD Million), by region (2023-2030)
11.6.2 Middle East and Africa Cricket Farming Revenue (USD Million), by Type (2023-2030)
11.6.3 Middle East and Africa Cricket Farming Revenue (USD Million), by Applications (2023-2030)
12 Methodology and Data Sources
12.1 Methodology/Research Approach
12.1.1 Research Programs/Design
12.1.2 Market Size Estimation
12.1.3 Market Breakdown and Data Triangulation
12.2 Data Sources
12.2.1 Secondary Sources
12.2.2 Primary Sources
12.3 Disclaimer
List of Tables
Table 1 Market Segmentation Analysis
Table 2 Global Cricket Farming Market Companies with Areas Served
Table 3 Products Offerings Global Cricket Farming Market
Table 4 Low Growth Scenario Forecasts
Table 5 Reference Case Growth Scenario
Table 6 High Growth Case Scenario
Table 7 Global Cricket Farming Revenue (USD Million) And CAGR (%) By Type (2018-2030)
Table 8 Global Cricket Farming Revenue (USD Million) And CAGR (%) By Applications (2018-2030)
Table 9 Global Cricket Farming Revenue (USD Million) And CAGR (%) By Regions (2018-2030)
Table 10 Global Cricket Farming Revenue (USD Million) By Type (2018-2022)
Table 11 Global Cricket Farming Revenue Market Share (%) By Type (2018-2022)
Table 12 Global Cricket Farming Revenue (USD Million) By Applications (2018-2022)
Table 13 Global Cricket Farming Revenue Market Share (%) By Applications (2018-2022)
Table 14 Global Cricket Farming Market Revenue (USD Million) By Regions (2018-2022)
Table 15 Global Cricket Farming Market Share (%) By Regions (2018-2022)
Table 16 North America Cricket Farming Revenue (USD Million) By Country (2018-2022)
Table 17 North America Cricket Farming Revenue (USD Million) By Type (2018-2022)
Table 18 North America Cricket Farming Revenue (USD Million) By Applications (2018-2022)
Table 19 Europe Cricket Farming Revenue (USD Million) By Country (2018-2022)
Table 20 Europe Cricket Farming Revenue (USD Million) By Type (2018-2022)
Table 21 Europe Cricket Farming Revenue (USD Million) By Applications (2018-2022)
Table 22 Asia Pacific Cricket Farming Revenue (USD Million) By Country (2018-2022)
Table 23 Asia Pacific Cricket Farming Revenue (USD Million) By Type (2018-2022)
Table 24 Asia Pacific Cricket Farming Revenue (USD Million) By Applications (2018-2022)
Table 25 South America Cricket Farming Revenue (USD Million) By Country (2018-2022)
Table 26 South America Cricket Farming Revenue (USD Million) By Type (2018-2022)
Table 27 South America Cricket Farming Revenue (USD Million) By Applications (2018-2022)
Table 28 Middle East and Africa Cricket Farming Revenue (USD Million) By Region (2018-2022)
Table 29 Middle East and Africa Cricket Farming Revenue (USD Million) By Type (2018-2022)
Table 30 Middle East and Africa Cricket Farming Revenue (USD Million) By Applications (2018-2022)
Table 31 Financial Analysis
Table 32 Global Cricket Farming Revenue (USD Million) By Type (2023-2030)
Table 33 Global Cricket Farming Revenue Market Share (%) By Type (2023-2030)
Table 34 Global Cricket Farming Revenue (USD Million) By Applications (2023-2030)
Table 35 Global Cricket Farming Revenue Market Share (%) By Applications (2023-2030)
Table 36 Global Cricket Farming Market Revenue (USD Million), And Revenue (USD Million) By Regions (2023-2030)
Table 37 North America Cricket Farming Revenue (USD)By Country (2023-2030)
Table 38 North America Cricket Farming Revenue (USD Million) By Type (2023-2030)
Table 39 North America Cricket Farming Revenue (USD Million) By Applications (2023-2030)
Table 40 Europe Cricket Farming Revenue (USD Million) By Country (2023-2030)
Table 41 Europe Cricket Farming Revenue (USD Million) By Type (2023-2030)
Table 42 Europe Cricket Farming Revenue (USD Million) By Applications (2023-2030)
Table 43 Asia Pacific Cricket Farming Revenue (USD Million) By Country (2023-2030)
Table 44 Asia Pacific Cricket Farming Revenue (USD Million) By Type (2023-2030)
Table 45 Asia Pacific Cricket Farming Revenue (USD Million) By Applications (2023-2030)
Table 46 South America Cricket Farming Revenue (USD Million) By Country (2023-2030)
Table 47 South America Cricket Farming Revenue (USD Million) By Type (2023-2030)
Table 48 South America Cricket Farming Revenue (USD Million) By Applications (2023-2030)
Table 49 Middle East and Africa Cricket Farming Revenue (USD Million) By Region (2023-2030)
Table 50 Middle East and Africa Cricket Farming Revenue (USD Million) By Region (2023-2030)
Table 51 Middle East and Africa Cricket Farming Revenue (USD Million) By Type (2023-2030)
Table 52 Middle East and Africa Cricket Farming Revenue (USD Million) By Applications (2023-2030)
Table 53 Research Programs/Design for This Report
Table 54 Key Data Information from Secondary Sources
Table 55 Key Data Information from Primary Sources
List of Figures
Figure 1 Market Scope
Figure 2 Porter’s Five Forces
Figure 3 Global Cricket Farming Revenue (USD Million) By Type (2018-2022)
Figure 4 Global Cricket Farming Revenue Market Share (%) By Type (2022)
Figure 5 Global Cricket Farming Revenue (USD Million) By Applications (2018-2022)
Figure 6 Global Cricket Farming Revenue Market Share (%) By Applications (2022)
Figure 7 Global Cricket Farming Market Revenue (USD Million) By Regions (2018-2022)
Figure 8 Global Cricket Farming Market Share (%) By Regions (2022)
Figure 9 North America Cricket Farming Revenue (USD Million) By Country (2018-2022)
Figure 10 North America Cricket Farming Revenue (USD Million) By Type (2018-2022)
Figure 11 North America Cricket Farming Revenue (USD Million) By Applications (2018-2022)
Figure 12 Europe Cricket Farming Revenue (USD Million) By Country (2018-2022)
Figure 13 Europe Cricket Farming Revenue (USD Million) By Type (2018-2022)
Figure 14 Europe Cricket Farming Revenue (USD Million) By Applications (2018-2022)
Figure 15 Asia Pacific Cricket Farming Revenue (USD Million) By Country (2018-2022)
Figure 16 Asia Pacific Cricket Farming Revenue (USD Million) By Type (2018-2022)
Figure 17 Asia Pacific Cricket Farming Revenue (USD Million) By Applications (2018-2022)
Figure 18 South America Cricket Farming Revenue (USD Million) By Country (2018-2022)
Figure 19 South America Cricket Farming Revenue (USD Million) By Type (2018-2022)
Figure 20 South America Cricket Farming Revenue (USD Million) By Applications (2018-2022)
Figure 21 Middle East and Africa Cricket Farming Revenue (USD Million) By Region (2018-2022)
Figure 22 Middle East and Africa Cricket Farming Revenue (USD Million) By Type (2018-2022)
Figure 23 Middle East and Africa Cricket Farming Revenue (USD Million) By Applications (2018-2022)
Figure 24 Global Cricket Farming Revenue (USD Million) By Type (2023-2030)
Figure 25 Global Cricket Farming Revenue Market Share (%) By Type (2030)
Figure 26 Global Cricket Farming Revenue (USD Million) By Applications (2023-2030)
Figure 27 Global Cricket Farming Revenue Market Share (%) By Applications (2030)
Figure 28 Global Cricket Farming Market Revenue (USD Million) By Regions (2023-2030)
Figure 29 North America Cricket Farming Revenue (USD Million) By Country (2023-2030)
Figure 30 North America Cricket Farming Revenue (USD Million) By Type (2023-2030)
Figure 31 North America Cricket Farming Revenue (USD Million) By Applications (2023-2030)
Figure 32 Europe Cricket Farming Revenue (USD Million) By Country (2023-2030)
Figure 33 Europe Cricket Farming Revenue (USD Million) By Type (2023-2030)
Figure 34 Europe Cricket Farming Revenue (USD Million) By Applications (2023-2030)
Figure 35 Asia Pacific Cricket Farming Revenue (USD Million) By Country (2023-2030)
Figure 36 Asia Pacific Cricket Farming Revenue (USD Million) By Type (2023-2030)
Figure 37 Asia Pacific Cricket Farming Revenue (USD Million) By Applications (2023-2030)
Figure 38 South America Cricket Farming Revenue (USD Million) By Country (2023-2030)
Figure 39 South America Cricket Farming Revenue (USD Million) By Type (2023-2030)
Figure 40 South America Cricket Farming Revenue (USD Million) By Applications (2023-2030)
Figure 41 Middle East and Africa Cricket Farming Revenue (USD Million) By Region (2023-2030)
Figure 42 Middle East and Africa Cricket Farming Revenue (USD Million) By Region (2023-2030)
Figure 43 Middle East and Africa Cricket Farming Revenue (USD Million) By Type (2023-2030)
Figure 44 Middle East and Africa Cricket Farming Revenue (USD Million) By Applications (2023-2030)
Figure 45 Bottom-Up and Top-Down Approaches for This Report
Figure 46 Data Triangulation
