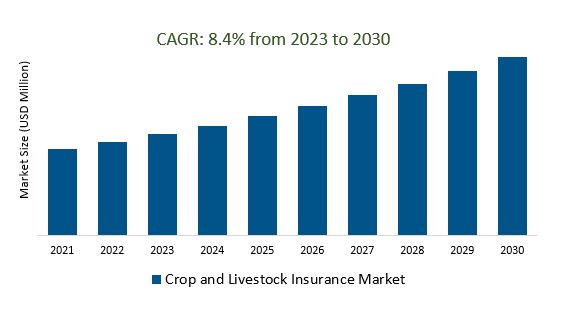
The Global Crop and Livestock Insurance Market Size is estimated to register 8.4% growth over the forecast period from 2023 to 2030.
The Crop and Livestock Insurance market is driven by various factors, including climate change, extreme weather events, government support, market growth in developing countries, increasing awareness of agricultural risks, technological advancements, parametric insurance, data analytics and AI, microinsurance, climate-resilient agriculture, integration with agribusiness, sustainability and ESG factors, blockchain and smart contracts, multi-peril insurance, and resilience-building initiatives. Climate change and extreme weather events are driving demand for crop and livestock insurance, while government policies and subsidies promote their adoption. The market is expanding in developing countries, and farmers are becoming more aware of the benefits of insurance. Technological advancements, such as remote sensing and satellite data, are enhancing risk assessment and enabling more accurate underwriting. Microinsurance products cater to small-scale and subsistence farmers, and sustainability and ESG factors are being explored.
Rising Demand for Crop and Livestock Insurance Amidst Increasing Extreme Weather Events.
The Crop and Livestock Insurance market is witnessing a surge in demand, primarily driven by the escalating frequency and intensity of extreme weather events. As climate change exacerbates, farmers are facing heightened risks to their crops and livestock, making insurance coverage more crucial than ever. This growing demand is prompting insurers to innovate and expand their offerings to provide comprehensive protection to agricultural stakeholders. Additionally, governments and regulatory bodies are recognizing the need for resilient insurance solutions, further boosting market growth. The rising awareness of these risks among farmers underscores the urgency of protecting their investments, which is propelling the Crop and Livestock Insurance sector into a pivotal role in modern agriculture. This market expansion signifies a positive step toward securing food production in the face of environmental challenges.
Enhancing Agricultural Risk Assessment and Insurance Processes through Technological Advancements.
The agricultural sector is experiencing a transformative shift through technological advancements in crop and livestock insurance, leading to more efficient risk assessment and insurance processes. These innovations leverage data analytics, satellite imagery, and IoT devices to monitor and predict crop health, weather patterns, and livestock well-being. This data-driven approach allows insurers to offer more tailored coverage, reducing the financial burden on farmers. Additionally, blockchain technology is enhancing transparency and trust within the insurance ecosystem, streamlining claim settlements. By harnessing the power of AI and machine learning, agricultural risk assessment becomes more accurate, helping farmers make informed decisions and fortifying the resilience of the industry in the face of climate change and unforeseen challenges. In this rapidly evolving landscape, technology is becoming a critical ally in safeguarding global food security.
Agricultural Risk Assessment and Insurance Processes through Technological Advancements is boosting the market.
The integration of cutting-edge technological advancements has become a pivotal driver for enhancing Agricultural Risk Assessment and Insurance Processes. This synergy of innovation is significantly bolstering the Crop and Livestock Insurance Market. Through the utilization of advanced data analytics and remote sensing technologies, insurers are now better equipped to assess and manage the risks associated with agricultural activities. This, in turn, provides more accurate and tailored insurance coverage to farmers and agribusinesses. Moreover, the implementation of smart sensors and IoT devices offers real-time monitoring and rapid response capabilities, minimizing losses due to unforeseen events. In sum, technological progress is revolutionizing the agricultural insurance sector, ensuring its resilience in an ever-changing landscape.
Market Share Analysis:
Crop insurance stands as the cornerstone of risk management within the agricultural sector, holding a commanding presence in the crop and livestock insurance market.
The essential segment provides vital support to farmers, shielding them from potential financial losses resulting from adverse weather conditions, pests, or other unforeseen challenges. By offering a safety net, crop insurance bolsters the confidence of farmers to invest in their crops, adopt modern agricultural practices, and expand their agricultural operations. It fosters stability in the industry, ensuring food security and promoting economic growth. Governments and private insurers collaborate to provide various crop insurance programs, serving as a crucial link in the agricultural value chain, ultimately safeguarding the well-being of both farmers and consumers. This dominance reflects its pivotal role in sustaining agricultural sustainability and ensuring a resilient food supply.
Crop insurance coverage holds a paramount position within the crop and livestock insurance market, reflecting its vital role in safeguarding the agricultural sector.
The dominant segment provides farmers with essential financial protection against the unpredictable whims of nature, including adverse weather events, diseases, and pests. It not only cushions the financial blows suffered by farmers due to crop losses but also offers a safety net that fosters sustainable agricultural practices. By mitigating the inherent risks of farming, crop insurance serves as a linchpin for food security, rural economic stability, and overall agricultural resilience. The prevalence of this coverage underlines its indispensability in today's agriculture, acting as a fundamental support system for farmers as they navigate the uncertainties of the natural world. As farming landscapes evolve, crop insurance's dominance signifies its enduring relevance in ensuring the continuity of agricultural livelihoods.
Agents play a pivotal role as the primary distribution channel within the crop and livestock insurance market.
The prominence arises from their ability to provide personalized guidance and expert advice to farmers and ranchers, ensuring tailored coverage that suits individual needs. These intermediaries act as a bridge between insurance companies and the agricultural community, fostering trust and understanding. They facilitate the often-complex process of selecting the right insurance policies, making it more accessible to the farming sector. Additionally, agents contribute to risk assessment, enabling underwriters to better evaluate the unique challenges faced by each agricultural operation. Their local presence and deep industry knowledge further enhance their indispensability, making them the backbone of this vital insurance market. In essence, agents are the linchpin in sustaining a resilient and efficient crop and livestock insurance ecosystem.
Crop and Livestock Insurance Market Segmentation
By Type
- Crop Insurance
- Live Stock Insurance
By Application
- Crop Insurance Coverage
- Live Stock Coverage
By Distribution Channel
- Agents
- Brokers
- Bancassurance
- Digital and Direct Channels
By Region
- North America (United States, Canada, Mexico)
- Europe (Germany, France, United Kingdom, Spain, Italy, Others)
- Asia Pacific (China, India, Japan, South Korea, Australia, Others)
- Latin America (Brazil, Argentina, Others)
- Middle East and Africa (Saudi Arabia, UAE, Kuwait, Other Middle East, South Africa, Nigeria, Other Africa)
Crop and Livestock Insurance market Companies
- QBE Insurance
- Lloyd's
- AXA
- Chubb
- Elders Insurance
- Nutrien
- Ag Guard Pty Ltd
- Insurance Australia Group
- Sompo
- Aon PLC
- Business Insurance Specialists Pty Ltd
*List not exhaustive
Crop and Livestock Insurance Market Outlook 2023
1 Market Overview
1.1 Introduction to the Crop and Livestock Insurance Market
1.2 Scope of the Study
1.3 Research Objective
1.3.1 Key Market Scope and Segments
1.3.2 Players Covered
1.3.3 Years Considered
2 Executive Summary
2.1 2023 Crop and Livestock Insurance Industry- Market Statistics
3 Market Dynamics
3.1 Market Drivers
3.2 Market Challenges
3.3 Market Opportunities
3.4 Market Trends
4 Market Factor Analysis
4.1 Porter’s Five Forces
4.2 Market Entropy
4.2.1 Global Crop and Livestock Insurance Market Companies with Area Served
4.2.2 Products Offerings Global Crop and Livestock Insurance Market
5 COVID-19 Impact Analysis and Outlook Scenarios
5.1.1 Covid-19 Impact Analysis
5.1.2 post-COVID-19 Scenario- Low Growth Case
5.1.3 post-COVID-19 Scenario- Reference Growth Case
5.1.4 post-COVID-19 Scenario- Low Growth Case
6 Global Crop and Livestock Insurance Market Trends
6.1 Global Crop and Livestock Insurance Revenue (USD Million) and CAGR (%) by Type (2018-2030)
6.2 Global Crop and Livestock Insurance Revenue (USD Million) and CAGR (%) by Applications (2018-2030)
6.3 Global Crop and Livestock Insurance Revenue (USD Million) and CAGR (%) by regions (2018-2030)
7 Global Crop and Livestock Insurance Market Revenue (USD Million) by Type, and Applications (2018-2022)
7.1 Global Crop and Livestock Insurance Revenue (USD Million) by Type (2018-2022)
7.1.1 Global Crop and Livestock Insurance Revenue (USD Million), Market Share (%) by Type (2018-2022)
7.2 Global Crop and Livestock Insurance Revenue (USD Million) by Applications (2018-2022)
7.2.1 Global Crop and Livestock Insurance Revenue (USD Million), Market Share (%) by Applications (2018-2022)
8 Global Crop and Livestock Insurance Development Regional Status and Outlook
8.1 Global Crop and Livestock Insurance Revenue (USD Million) By Regions (2018-2022)
8.2 North America Crop and Livestock Insurance Revenue (USD Million) by Type, and Application (2018-2022)
8.2.1 North America Crop and Livestock Insurance Revenue (USD Million) by Country (2018-2022)
8.2.2 North America Crop and Livestock Insurance Revenue (USD Million) by Type (2018-2022)
8.2.3 North America Crop and Livestock Insurance Revenue (USD Million) by Applications (2018-2022)
8.3 Europe Crop and Livestock Insurance Revenue (USD Million), by Type, and Applications (USD Million) (2018-2022)
8.3.1 Europe Crop and Livestock Insurance Revenue (USD Million), by Country (2018-2022)
8.3.2 Europe Crop and Livestock Insurance Revenue (USD Million) by Type (2018-2022)
8.3.3 Europe Crop and Livestock Insurance Revenue (USD Million) by Applications (2018-2022)
8.4 Asia Pacific Crop and Livestock Insurance Revenue (USD Million), and Revenue (USD Million) by Type, and Applications (2018-2022)
8.4.1 Asia Pacific Crop and Livestock Insurance Revenue (USD Million) by Country (2018-2022)
8.4.2 Asia Pacific Crop and Livestock Insurance Revenue (USD Million) by Type (2018-2022)
8.4.3 Asia Pacific Crop and Livestock Insurance Revenue (USD Million) by Applications (2018-2022)
8.5 South America Crop and Livestock Insurance Revenue (USD Million), by Type, and Applications (2018-2022)
8.5.1 South America Crop and Livestock Insurance Revenue (USD Million), by Country (2018-2022)
8.5.2 South America Crop and Livestock Insurance Revenue (USD Million) by Type (2018-2022)
8.5.3 South America Crop and Livestock Insurance Revenue (USD Million) by Applications (2018-2022)
8.6 Middle East and Africa Crop and Livestock Insurance Revenue (USD Million), by Type, Technology, Application, Thickness (2018-2022)
8.6.1 Middle East and Africa Crop and Livestock Insurance Revenue (USD Million) by Country (2018-2022)
8.6.2 Middle East and Africa Crop and Livestock Insurance Revenue (USD Million) by Type (2018-2022)
8.6.3 Middle East and Africa Crop and Livestock Insurance Revenue (USD Million) by Applications (2018-2022)
9 Company Profiles
10 Global Crop and Livestock Insurance Market Revenue (USD Million), by Type, and Applications (2023-2030)
10.1 Global Crop and Livestock Insurance Revenue (USD Million) and Market Share (%) by Type (2023-2030)
10.1.1 Global Crop and Livestock Insurance Revenue (USD Million), and Market Share (%) by Type (2023-2030)
10.2 Global Crop and Livestock Insurance Revenue (USD Million) and Market Share (%) by Applications (2023-2030)
10.2.1 Global Crop and Livestock Insurance Revenue (USD Million), and Market Share (%) by Applications (2023-2030)
11 Global Crop and Livestock Insurance Development Regional Status and Outlook Forecast
11.1 Global Crop and Livestock Insurance Revenue (USD Million) By Regions (2023-2030)
11.2 North America Crop and Livestock Insurance Revenue (USD Million) by Type, and Applications (2023-2030)
11.2.1 North America Crop and Livestock Insurance Revenue (USD) Million by Country (2023-2030)
11.2.2 North America Crop and Livestock Insurance Revenue (USD Million), by Type (2023-2030)
11.2.3 North America Crop and Livestock Insurance Revenue (USD Million), Market Share (%) by Applications (2023-2030)
11.3 Europe Crop and Livestock Insurance Revenue (USD Million), by Type, and Applications (2023-2030)
11.3.1 Europe Crop and Livestock Insurance Revenue (USD Million), by Country (2023-2030)
11.3.2 Europe Crop and Livestock Insurance Revenue (USD Million), by Type (2023-2030)
11.3.3 Europe Crop and Livestock Insurance Revenue (USD Million), by Applications (2023-2030)
11.4 Asia Pacific Crop and Livestock Insurance Revenue (USD Million) by Type, and Applications (2023-2030)
11.4.1 Asia Pacific Crop and Livestock Insurance Revenue (USD Million), by Country (2023-2030)
11.4.2 Asia Pacific Crop and Livestock Insurance Revenue (USD Million), by Type (2023-2030)
11.4.3 Asia Pacific Crop and Livestock Insurance Revenue (USD Million), by Applications (2023-2030)
11.5 South America Crop and Livestock Insurance Revenue (USD Million), by Type, and Applications (2023-2030)
11.5.1 South America Crop and Livestock Insurance Revenue (USD Million), by Country (2023-2030)
11.5.2 South America Crop and Livestock Insurance Revenue (USD Million), by Type (2023-2030)
11.5.3 South America Crop and Livestock Insurance Revenue (USD Million), by Applications (2023-2030)
11.6 Middle East and Africa Crop and Livestock Insurance Revenue (USD Million), by Type, and Applications (2023-2030)
11.6.1 Middle East and Africa Crop and Livestock Insurance Revenue (USD Million), by region (2023-2030)
11.6.2 Middle East and Africa Crop and Livestock Insurance Revenue (USD Million), by Type (2023-2030)
11.6.3 Middle East and Africa Crop and Livestock Insurance Revenue (USD Million), by Applications (2023-2030)
12 Methodology and Data Sources
12.1 Methodology/Research Approach
12.1.1 Research Programs/Design
12.1.2 Market Size Estimation
12.1.3 Market Breakdown and Data Triangulation
12.2 Data Sources
12.2.1 Secondary Sources
12.2.2 Primary Sources
12.3 Disclaimer
List of Tables
Table 1 Market Segmentation Analysis
Table 2 Global Crop and Livestock Insurance Market Companies with Areas Served
Table 3 Products Offerings Global Crop and Livestock Insurance Market
Table 4 Low Growth Scenario Forecasts
Table 5 Reference Case Growth Scenario
Table 6 High Growth Case Scenario
Table 7 Global Crop and Livestock Insurance Revenue (USD Million) And CAGR (%) By Type (2018-2030)
Table 8 Global Crop and Livestock Insurance Revenue (USD Million) And CAGR (%) By Applications (2018-2030)
Table 9 Global Crop and Livestock Insurance Revenue (USD Million) And CAGR (%) By Regions (2018-2030)
Table 10 Global Crop and Livestock Insurance Revenue (USD Million) By Type (2018-2022)
Table 11 Global Crop and Livestock Insurance Revenue Market Share (%) By Type (2018-2022)
Table 12 Global Crop and Livestock Insurance Revenue (USD Million) By Applications (2018-2022)
Table 13 Global Crop and Livestock Insurance Revenue Market Share (%) By Applications (2018-2022)
Table 14 Global Crop and Livestock Insurance Market Revenue (USD Million) By Regions (2018-2022)
Table 15 Global Crop and Livestock Insurance Market Share (%) By Regions (2018-2022)
Table 16 North America Crop and Livestock Insurance Revenue (USD Million) By Country (2018-2022)
Table 17 North America Crop and Livestock Insurance Revenue (USD Million) By Type (2018-2022)
Table 18 North America Crop and Livestock Insurance Revenue (USD Million) By Applications (2018-2022)
Table 19 Europe Crop and Livestock Insurance Revenue (USD Million) By Country (2018-2022)
Table 20 Europe Crop and Livestock Insurance Revenue (USD Million) By Type (2018-2022)
Table 21 Europe Crop and Livestock Insurance Revenue (USD Million) By Applications (2018-2022)
Table 22 Asia Pacific Crop and Livestock Insurance Revenue (USD Million) By Country (2018-2022)
Table 23 Asia Pacific Crop and Livestock Insurance Revenue (USD Million) By Type (2018-2022)
Table 24 Asia Pacific Crop and Livestock Insurance Revenue (USD Million) By Applications (2018-2022)
Table 25 South America Crop and Livestock Insurance Revenue (USD Million) By Country (2018-2022)
Table 26 South America Crop and Livestock Insurance Revenue (USD Million) By Type (2018-2022)
Table 27 South America Crop and Livestock Insurance Revenue (USD Million) By Applications (2018-2022)
Table 28 Middle East and Africa Crop and Livestock Insurance Revenue (USD Million) By Region (2018-2022)
Table 29 Middle East and Africa Crop and Livestock Insurance Revenue (USD Million) By Type (2018-2022)
Table 30 Middle East and Africa Crop and Livestock Insurance Revenue (USD Million) By Applications (2018-2022)
Table 31 Financial Analysis
Table 32 Global Crop and Livestock Insurance Revenue (USD Million) By Type (2023-2030)
Table 33 Global Crop and Livestock Insurance Revenue Market Share (%) By Type (2023-2030)
Table 34 Global Crop and Livestock Insurance Revenue (USD Million) By Applications (2023-2030)
Table 35 Global Crop and Livestock Insurance Revenue Market Share (%) By Applications (2023-2030)
Table 36 Global Crop and Livestock Insurance Market Revenue (USD Million), And Revenue (USD Million) By Regions (2023-2030)
Table 37 North America Crop and Livestock Insurance Revenue (USD)By Country (2023-2030)
Table 38 North America Crop and Livestock Insurance Revenue (USD Million) By Type (2023-2030)
Table 39 North America Crop and Livestock Insurance Revenue (USD Million) By Applications (2023-2030)
Table 40 Europe Crop and Livestock Insurance Revenue (USD Million) By Country (2023-2030)
Table 41 Europe Crop and Livestock Insurance Revenue (USD Million) By Type (2023-2030)
Table 42 Europe Crop and Livestock Insurance Revenue (USD Million) By Applications (2023-2030)
Table 43 Asia Pacific Crop and Livestock Insurance Revenue (USD Million) By Country (2023-2030)
Table 44 Asia Pacific Crop and Livestock Insurance Revenue (USD Million) By Type (2023-2030)
Table 45 Asia Pacific Crop and Livestock Insurance Revenue (USD Million) By Applications (2023-2030)
Table 46 South America Crop and Livestock Insurance Revenue (USD Million) By Country (2023-2030)
Table 47 South America Crop and Livestock Insurance Revenue (USD Million) By Type (2023-2030)
Table 48 South America Crop and Livestock Insurance Revenue (USD Million) By Applications (2023-2030)
Table 49 Middle East and Africa Crop and Livestock Insurance Revenue (USD Million) By Region (2023-2030)
Table 50 Middle East and Africa Crop and Livestock Insurance Revenue (USD Million) By Region (2023-2030)
Table 51 Middle East and Africa Crop and Livestock Insurance Revenue (USD Million) By Type (2023-2030)
Table 52 Middle East and Africa Crop and Livestock Insurance Revenue (USD Million) By Applications (2023-2030)
Table 53 Research Programs/Design for This Report
Table 54 Key Data Information from Secondary Sources
Table 55 Key Data Information from Primary Sources
List of Figures
Figure 1 Market Scope
Figure 2 Porter’s Five Forces
Figure 3 Global Crop and Livestock Insurance Revenue (USD Million) By Type (2018-2022)
Figure 4 Global Crop and Livestock Insurance Revenue Market Share (%) By Type (2022)
Figure 5 Global Crop and Livestock Insurance Revenue (USD Million) By Applications (2018-2022)
Figure 6 Global Crop and Livestock Insurance Revenue Market Share (%) By Applications (2022)
Figure 7 Global Crop and Livestock Insurance Market Revenue (USD Million) By Regions (2018-2022)
Figure 8 Global Crop and Livestock Insurance Market Share (%) By Regions (2022)
Figure 9 North America Crop and Livestock Insurance Revenue (USD Million) By Country (2018-2022)
Figure 10 North America Crop and Livestock Insurance Revenue (USD Million) By Type (2018-2022)
Figure 11 North America Crop and Livestock Insurance Revenue (USD Million) By Applications (2018-2022)
Figure 12 Europe Crop and Livestock Insurance Revenue (USD Million) By Country (2018-2022)
Figure 13 Europe Crop and Livestock Insurance Revenue (USD Million) By Type (2018-2022)
Figure 14 Europe Crop and Livestock Insurance Revenue (USD Million) By Applications (2018-2022)
Figure 15 Asia Pacific Crop and Livestock Insurance Revenue (USD Million) By Country (2018-2022)
Figure 16 Asia Pacific Crop and Livestock Insurance Revenue (USD Million) By Type (2018-2022)
Figure 17 Asia Pacific Crop and Livestock Insurance Revenue (USD Million) By Applications (2018-2022)
Figure 18 South America Crop and Livestock Insurance Revenue (USD Million) By Country (2018-2022)
Figure 19 South America Crop and Livestock Insurance Revenue (USD Million) By Type (2018-2022)
Figure 20 South America Crop and Livestock Insurance Revenue (USD Million) By Applications (2018-2022)
Figure 21 Middle East and Africa Crop and Livestock Insurance Revenue (USD Million) By Region (2018-2022)
Figure 22 Middle East and Africa Crop and Livestock Insurance Revenue (USD Million) By Type (2018-2022)
Figure 23 Middle East and Africa Crop and Livestock Insurance Revenue (USD Million) By Applications (2018-2022)
Figure 24 Global Crop and Livestock Insurance Revenue (USD Million) By Type (2023-2030)
Figure 25 Global Crop and Livestock Insurance Revenue Market Share (%) By Type (2030)
Figure 26 Global Crop and Livestock Insurance Revenue (USD Million) By Applications (2023-2030)
Figure 27 Global Crop and Livestock Insurance Revenue Market Share (%) By Applications (2030)
Figure 28 Global Crop and Livestock Insurance Market Revenue (USD Million) By Regions (2023-2030)
Figure 29 North America Crop and Livestock Insurance Revenue (USD Million) By Country (2023-2030)
Figure 30 North America Crop and Livestock Insurance Revenue (USD Million) By Type (2023-2030)
Figure 31 North America Crop and Livestock Insurance Revenue (USD Million) By Applications (2023-2030)
Figure 32 Europe Crop and Livestock Insurance Revenue (USD Million) By Country (2023-2030)
Figure 33 Europe Crop and Livestock Insurance Revenue (USD Million) By Type (2023-2030)
Figure 34 Europe Crop and Livestock Insurance Revenue (USD Million) By Applications (2023-2030)
Figure 35 Asia Pacific Crop and Livestock Insurance Revenue (USD Million) By Country (2023-2030)
Figure 36 Asia Pacific Crop and Livestock Insurance Revenue (USD Million) By Type (2023-2030)
Figure 37 Asia Pacific Crop and Livestock Insurance Revenue (USD Million) By Applications (2023-2030)
Figure 38 South America Crop and Livestock Insurance Revenue (USD Million) By Country (2023-2030)
Figure 39 South America Crop and Livestock Insurance Revenue (USD Million) By Type (2023-2030)
Figure 40 South America Crop and Livestock Insurance Revenue (USD Million) By Applications (2023-2030)
Figure 41 Middle East and Africa Crop and Livestock Insurance Revenue (USD Million) By Region (2023-2030)
Figure 42 Middle East and Africa Crop and Livestock Insurance Revenue (USD Million) By Region (2023-2030)
Figure 43 Middle East and Africa Crop and Livestock Insurance Revenue (USD Million) By Type (2023-2030)
Figure 44 Middle East and Africa Crop and Livestock Insurance Revenue (USD Million) By Applications (2023-2030)
Figure 45 Bottom-Up and Top-Down Approaches for This Report
Figure 46 Data Triangulation
