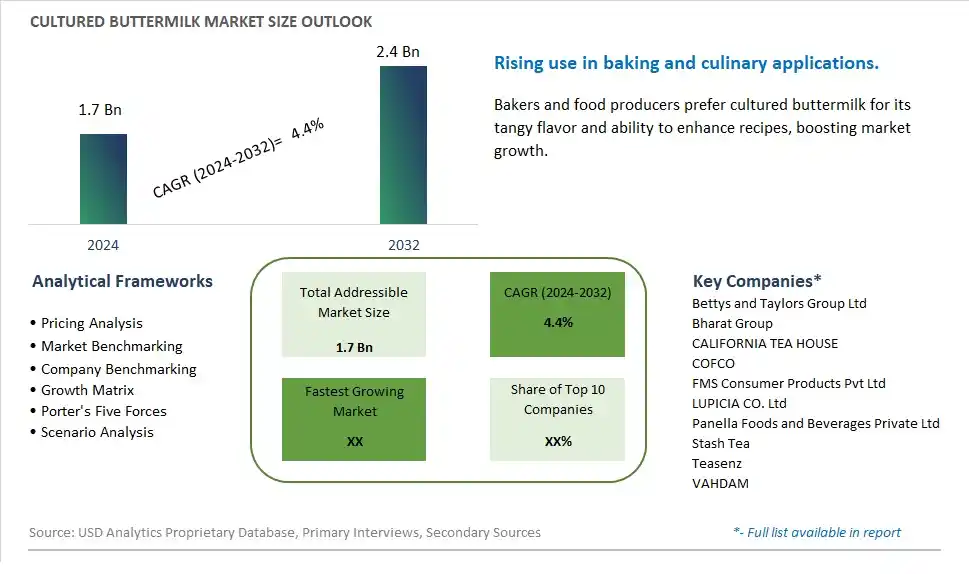
Global Cultured Buttermilk Market Size is valued at $1.7 Billion in 2024 and is forecast to register a growth rate (CAGR) of 4.4% to reach $2.4 Billion by 2032.
The global Cultured Buttermilk Market Comprehensive Study analyzes and forecasts the market size across 6 regions and 24 countries for diverse segments -By Application (Bakery, Confectionery, Dairy, Beverages, Others), By Form (Liquid, Powder), By Distribution Channel (Hypermarket/Supermarket, Modern Grocery Stores, Specialty Stores, Convenience Stores, Online Retail, Others)
An Introduction to Cultured Buttermilk Market
In 2024, the Cultured Buttermilk market is witnessing significant growth, driven by the increasing demand for tangy, probiotic-rich dairy products. Cultured buttermilk, produced through the fermentation of milk with lactic acid bacteria, is valued for its distinctive flavor, nutritional benefits, and versatility in baking and cooking. The market is supported by the growing trend towards functional foods and probiotics. Advances in fermentation and dairy processing technologies are enhancing the quality, flavor, and shelf life of cultured buttermilk. The market is also benefiting from the trend towards clean-label and natural products, appealing to health-conscious consumers seeking nutritious and flavorful dairy options.
Cultured Buttermilk Competitive Landscape
The market report analyses the leading companies in the industry including Bettys and Taylors Group Ltd, Bharat Group, CALIFORNIA TEA HOUSE, COFCO, FMS Consumer Products Pvt Ltd, LUPICIA CO. Ltd, Panella Foods and Beverages Private Ltd, Stash Tea, Teasenz, VAHDAM, and Others.
Cultured Buttermilk Market Dynamics
Cultured Buttermilk Market Trend: Growing Preference for Probiotic Foods
One prominent market trend in the cultured buttermilk market is the growing preference for probiotic foods. With increasing awareness of gut health and the benefits of probiotics, consumers are seeking dairy products like cultured buttermilk that contain beneficial bacteria. This trend is driving the demand for cultured buttermilk as a probiotic-rich ingredient in various food and beverage applications.
Cultured Buttermilk Market Driver: Health and Nutritional Benefits
A significant market driver for cultured buttermilk is its health and nutritional benefits. Cultured buttermilk is known for being rich in vitamins, minerals, and probiotics, making it a nutritious addition to diets. The perception of buttermilk as a healthy dairy option, along with its tangy flavor and versatility in recipes, is driving consumer interest and consumption.
Cultured Buttermilk Market Opportunity: Positioning as a Functional Ingredient
An exciting potential opportunity in the cultured buttermilk market lies in positioning it as a functional ingredient. Manufacturers can capitalize on the demand for functional foods by promoting cultured buttermilk as more than just a beverage—it can be marketed as a functional ingredient in smoothies, salad dressings, marinades, baked goods, and other culinary creations. Highlighting its probiotic content, nutritional value, and culinary versatility can attract health-conscious consumers looking for convenient ways to incorporate probiotics into their diets.
Cultured Buttermilk Market Share Analysis: Bakery segment generated the highest revenue share in the industry
The Bakery segment is the largest in the Cultured Buttermilk Market. This segment's prominence is primarily due to the widespread use of cultured buttermilk as a key ingredient in various baked goods such as breads, pastries, and cakes. Cultured buttermilk is favored in bakery applications for its ability to add a rich, tangy flavor and tender texture to products, enhancing overall taste and consumer appeal. Its acidic properties also react with baking soda to produce carbon dioxide, which helps in leavening and contributes to a lighter, fluffier texture. Furthermore, the growing trend towards natural and traditional baking ingredients has reinforced the demand for cultured buttermilk in the bakery sector. As consumers increasingly prefer artisanal and homemade-style baked goods, the use of cultured buttermilk in bakeries is expected to remain strong, solidifying its status as the market's largest segment. This is supported by the ongoing innovation in bakery products and evolving consumer tastes, which continue to drive significant growth in this market sector.
Cultured Buttermilk Market Share Analysis: Powder is the fastest growing segment over the forecast period to 2032
The Powder form of cultured buttermilk is projected to be the fastest-growing segment in the Cultured Buttermilk Market by 2032. This growth is attributed to the powder form's extended shelf life, ease of storage, and convenience in handling and transportation compared to its liquid counterpart. Cultured buttermilk powder offers the same rich flavor and nutritional benefits as liquid buttermilk but in a more versatile and stable form. It is increasingly used in dry mixes for bakery products, seasoning blends, and snack foods. Additionally, the rising popularity of convenience foods and the growing trend toward more efficient and economical food production processes favor the adoption of buttermilk powder. Manufacturers also prefer the powdered form due to cost-effectiveness in bulk shipping and storage. As the global food industry continues to innovate and expand, the demand for ingredients that offer both functionality and convenience, like cultured buttermilk powder, is expected to significantly increase, driving rapid growth in this segment.
Cultured Buttermilk Market Share Analysis: Hypermarket/Supermarket segment generated the highest revenue share in the industry
The Hypermarket/Supermarket segment is the largest in the Cultured Buttermilk Market. This channel dominates due to its extensive reach and the ability to offer a wide variety of cultured buttermilk products under one roof, catering to diverse consumer preferences. Hypermarkets and supermarkets benefit from high foot traffic and the convenience they provide to consumers looking for one-stop shopping for all grocery needs, including dairy products like cultured buttermilk. These retail formats are also pivotal in introducing new products to consumers, effectively driving product trial and adoption. Additionally, hypermarkets and supermarkets often have robust supply chain capabilities that ensure the availability of fresh dairy products, including cultured buttermilk, enhancing their attractiveness to consumers. The segment’s strength is further supported by the growing trend of large retail chains expanding their presence in emerging markets, where increasing urbanization and rising incomes are driving more consumers to shop at modern retail outlets. This growth trajectory is expected to continue, solidifying hypermarkets and supermarkets as the foremost distribution channel for cultured buttermilk.
Cultured Buttermilk Market Segmentation
By Application
Bakery
Confectionery
Dairy
Beverages
Others
By Form
Liquid
Powder
By Distribution Channel
Hypermarket/Supermarket
Modern Grocery Stores
Specialty Stores
Convenience Stores
Online Retail
Others
Countries Analyzed
North America (US, Canada, Mexico)
Europe (Germany, UK, France, Spain, Italy, Russia, Rest of Europe)
Asia Pacific (China, India, Japan, South Korea, Australia, South East Asia, Rest of Asia)
South America (Brazil, Argentina, Rest of South America)
Middle East and Africa (Saudi Arabia, UAE, Rest of Middle East, South Africa, Egypt, Rest of Africa)
Cultured Buttermilk Companies Profiled in the Study
Bettys and Taylors Group Ltd
Bharat Group
CALIFORNIA TEA HOUSE
COFCO
FMS Consumer Products Pvt Ltd
LUPICIA CO. Ltd
Panella Foods and Beverages Private Ltd
Stash Tea
Teasenz
VAHDAM
*- List Not Exhaustive
Chapter 1. TABLE OF CONTENTS
Chapter 2. Introduction to Cultured Buttermilk Market
2.1. Market Overview
2.2. Key Statistics and Report Highlights
2.3. Scope of the Comprehensive Study
2.3.1. Market Definition
2.3.2 Countries and Regions Covered
2.3.3 Research Objective
2.3.4 Units, Currency, and Conversions
2.3.5 Industry Value Chain
2.4. Key Market Segments
2.5. Key Companies
2.6. Study Period
Chapter 3. Strategic Analysis Review
3.1. Cultured Buttermilk Pricing Analysis and Forecast
3.2. Porter’s Five Forces
3.3. Market Ecosystem
3.4. SWOT Analysis
3.5. Regulatory Scenario
3.3. Effects of Inflation, Russia-Ukraine War, moderating economic growth, and other macroeconomic factors
Chapter 4. Competitive Landscape
4.1. Market Share Analysis
4.1.1. Global Cultured Buttermilk Market Share by Company, 2023
4.1.2. Product Offerings of Leading Cultured Buttermilk Companies
4.2. Market Entropy
4.2.1. New Product Launches in the Industry
4.2.2. Mergers, Acquisitions, Joint ventures, and Partnerships
4.3. Key Strategies and Best Practices
Chapter 5. Global Market Projections: Best, Reference, and Low Case Scenarios
5.1. Growth Analysis- Case Scenario Definitions
5.2. Low Growth Case Scenario Forecasts
5.3. Reference Growth Case Scenario Forecasts
5.4. High Growth Case Scenario Forecasts
Chapter 6. Market Dynamics
6.1. Cultured Buttermilk Market Drivers
6.2. Cultured Buttermilk Market Challenges
6.6. Cultured Buttermilk Market Opportunities
6.4. Cultured Buttermilk Market Trends
Chapter 7. Global Cultured Buttermilk Market Outlook Trends
7.1. Global Cultured Buttermilk Revenue (USD Million) and CAGR (%) by Type (2021-2032)
7.2. Global Cultured Buttermilk Revenue (USD Million) and CAGR (%) by Application (2021-2032)
7.3. Global Cultured Buttermilk Revenue (USD Million) and CAGR (%) by Product (2021-2032)
By Application
Bakery
Confectionery
Dairy
Beverages
Others
By Form
Liquid
Powder
By Distribution Channel
Hypermarket/Supermarket
Modern Grocery Stores
Specialty Stores
Convenience Stores
Online Retail
Others
Chapter 8. Global Cultured Buttermilk Regional Analysis and Outlook
8.1. Global Cultured Buttermilk Revenue (USD Million) By Regions (2021- 2032)
8.2. North America Cultured Buttermilk Revenue (USD Million) by Country (2021-2032)
8.2.1. United States Cultured Buttermilk Regional Analysis and Outlook
8.2.2. Canada Cultured Buttermilk Regional Analysis and Outlook
8.2.3. Mexico Cultured Buttermilk Regional Analysis and Outlook
8.3. Europe Cultured Buttermilk Revenue (USD Million), by Country (2021-2032)
8.3.1. Germany Cultured Buttermilk Regional Analysis and Outlook
8.3.2. France Cultured Buttermilk Regional Analysis and Outlook
8.3.3. United Kingdom Cultured Buttermilk Regional Analysis and Outlook
8.3.4. Spain Cultured Buttermilk Regional Analysis and Outlook
8.3.5. Italy Cultured Buttermilk Regional Analysis and Outlook
8.3.6. Russia Cultured Buttermilk Regional Analysis and Outlook
8.3.7. Rest of Europe Cultured Buttermilk Regional Analysis and Outlook
8.4. Asia Pacific Cultured Buttermilk Revenue (USD Million) by Country (2021-2032)
8.4.1. China Cultured Buttermilk Regional Analysis and Outlook
8.4.2. Japan Cultured Buttermilk Regional Analysis and Outlook
8.4.3. India Cultured Buttermilk Regional Analysis and Outlook
8.4.4. South Korea Cultured Buttermilk Regional Analysis and Outlook
8.4.5. Australia Cultured Buttermilk Regional Analysis and Outlook
8.4.6. South East Asia Cultured Buttermilk Regional Analysis and Outlook
8.4.7. Rest of Asia Pacific Cultured Buttermilk Regional Analysis and Outlook
8.5. South America Cultured Buttermilk Revenue (USD Million), by Country (2021-2032)
8.5.1. Brazil Cultured Buttermilk Regional Analysis and Outlook
8.5.2. Argentina Cultured Buttermilk Regional Analysis and Outlook
8.5.3. Rest of South America Cultured Buttermilk Regional Analysis and Outlook
8.6. Middle East and Africa Cultured Buttermilk Revenue (USD Million) by Country (2021-2032)
8.6.1. Middle East Cultured Buttermilk Regional Analysis and Outlook
8.6.2. Africa Cultured Buttermilk Regional Analysis and Outlook
Chapter 9. North America Cultured Buttermilk Analysis and Outlook
9.1. North America Cultured Buttermilk Revenue (USD Million) by Segments (2021-2032)
9.1.1. North America Cultured Buttermilk Revenue (USD Million) by Type (2021-2032)
9.1.2. North America Cultured Buttermilk Revenue (USD Million) by Application (2021-2032)
9.1.3. North America Cultured Buttermilk Revenue (USD Million) by Product (2021-2032)
By Application
Bakery
Confectionery
Dairy
Beverages
Others
By Form
Liquid
Powder
By Distribution Channel
Hypermarket/Supermarket
Modern Grocery Stores
Specialty Stores
Convenience Stores
Online Retail
Others
Chapter 10. Europe Cultured Buttermilk Analysis and Outlook
10.1. Europe Cultured Buttermilk Revenue (USD Million), by Segments (USD Million) (2021-2032)
10.1.1. Europe Cultured Buttermilk Revenue (USD Million) by Type (2021-2032)
10.1.2. Europe Cultured Buttermilk Revenue (USD Million) by Application (2021-2032)
10.1.3. Europe Cultured Buttermilk Revenue (USD Million) by Product (2021-2032)
By Application
Bakery
Confectionery
Dairy
Beverages
Others
By Form
Liquid
Powder
By Distribution Channel
Hypermarket/Supermarket
Modern Grocery Stores
Specialty Stores
Convenience Stores
Online Retail
Others
Chapter 11. Asia Pacific Cultured Buttermilk Analysis and Outlook
11.1. Asia Pacific Cultured Buttermilk Revenue (USD Million), and Revenue (USD Million) by Segments (2021-2032)
11.1.1. Asia Pacific Cultured Buttermilk Revenue (USD Million) by Type (2021-2032)
11.1.2. Asia Pacific Cultured Buttermilk Revenue (USD Million) by Application (2021-2032)
11.1.3. Asia Pacific Cultured Buttermilk Revenue (USD Million) by Product (2021-2032)
By Application
Bakery
Confectionery
Dairy
Beverages
Others
By Form
Liquid
Powder
By Distribution Channel
Hypermarket/Supermarket
Modern Grocery Stores
Specialty Stores
Convenience Stores
Online Retail
Others
Chapter 12. South America Cultured Buttermilk Analysis and Outlook
12.1. South America Cultured Buttermilk Revenue (USD Million), by Segments (2021-2032)
12.1.1. South America Cultured Buttermilk Revenue (USD Million) by Type (2021-2032)
12.1.2. South America Cultured Buttermilk Revenue (USD Million) by Application (2021-2032)
12.1.3. South America Cultured Buttermilk Revenue (USD Million) by Product (2021-2032)
By Application
Bakery
Confectionery
Dairy
Beverages
Others
By Form
Liquid
Powder
By Distribution Channel
Hypermarket/Supermarket
Modern Grocery Stores
Specialty Stores
Convenience Stores
Online Retail
Others
Chapter 13. Middle East and Africa Cultured Buttermilk Analysis and Outlook
13.1. Middle East and Africa Cultured Buttermilk Revenue (USD Million), by Segments (2021-2032)
13.1.1. Middle East and Africa Cultured Buttermilk Revenue (USD Million) by Type (2021-2032)
13.1.2. Middle East and Africa Cultured Buttermilk Revenue (USD Million) by Application (2021-2032)
13.1.3. Middle East and Africa Cultured Buttermilk Revenue (USD Million) by Product (2021-2032)
By Application
Bakery
Confectionery
Dairy
Beverages
Others
By Form
Liquid
Powder
By Distribution Channel
Hypermarket/Supermarket
Modern Grocery Stores
Specialty Stores
Convenience Stores
Online Retail
Others
Chapter 14. Cultured Buttermilk Company Profiles
14.1 Business Overview
14.2 Product Profiles
14.3 SWOT Profiles
14.5 Recent Developments
14.6 Financial Profile
List of Companies
Bettys and Taylors Group Ltd
Bharat Group
CALIFORNIA TEA HOUSE
COFCO
FMS Consumer Products Pvt Ltd
LUPICIA CO. Ltd
Panella Foods and Beverages Private Ltd
Stash Tea
Teasenz
VAHDAM
15. Methodology and Data Sources
15.1 Customization Offerings
15.2 Subscription Services
15.3 Related Reports
15.4 Publisher Expertise
LIST OF TABLES
Table 1 Market Segmentation Analysis
Table 2 Global Cultured Buttermilk Market Share of Leading Companies, 2023
Table 3 Product Offerings of Leading Companies
Table 4 Low Growth Scenario Forecasts
Table 5 Reference Case Growth Scenario
Table 6 High Growth Case Scenario
Table 7 Global Cultured Buttermilk Revenue (USD Million) And CAGR (%) By Type (2021-2032)
Table 8 Global Cultured Buttermilk Revenue (USD Million) And CAGR (%) By Application (2021-2032)
Table 9 Global Cultured Buttermilk Revenue (USD Million) And CAGR (%) By Product (2021-2032)
Table 10 Global Cultured Buttermilk Market Revenue (USD Million) By Regions (2021-2032)
Table 11 Global Cultured Buttermilk Market Share (%) By Regions (2021-2032)
Table 12 North America Cultured Buttermilk Revenue (USD Million) By Country (2021-2032)
Table 13 Europe Cultured Buttermilk Revenue (USD Million) By Country (2021-2032)
Table 14 Asia Pacific Cultured Buttermilk Revenue (USD Million) By Country (2021-2032)
Table 15 South America Cultured Buttermilk Revenue (USD Million) By Country (2021-2032)
Table 16 Middle East and Africa Cultured Buttermilk Revenue (USD Million) By Region (2021-2032)
Table 17 North America Cultured Buttermilk Revenue (USD Million) By Type (2021-2032)
Table 18 North America Cultured Buttermilk Revenue (USD Million) By Application (2021-2032)
Table 19 North America Cultured Buttermilk Revenue (USD Million) By Product (2021-2032)
Table 20 Europe Cultured Buttermilk Revenue (USD Million) By Type (2021-2032)
Table 21 Europe Cultured Buttermilk Revenue (USD Million) By Application (2021-2032)
Table 22 Europe Cultured Buttermilk Revenue (USD Million) By Product (2021-2032)
Table 23 Asia Pacific Cultured Buttermilk Revenue (USD Million) By Type (2021-2032)
Table 24 Asia Pacific Cultured Buttermilk Revenue (USD Million) By Application (2021-2032)
Table 25 Asia Pacific Cultured Buttermilk Revenue (USD Million) By Product (2021-2032)
Table 26 South America Cultured Buttermilk Revenue (USD Million) By Type (2021-2032)
Table 27 South America Cultured Buttermilk Revenue (USD Million) By Application (2021-2032)
Table 28 South America Cultured Buttermilk Revenue (USD Million) By Product (2021-2032)
Table 29 Middle East and Africa Cultured Buttermilk Revenue (USD Million) By Type (2021-2032)
Table 30 Middle East and Africa Cultured Buttermilk Revenue (USD Million) By Application (2021-2032)
Table 31 Middle East and Africa Cultured Buttermilk Revenue (USD Million) By Product (2021-2032)
LIST OF FIGURES
Figure 1. Market Scope
Figure 2. Pricing Forecasts Per Unit, 2023- 2032
Figure 3. Porter’s Five Forces
Figure 4. Global Cultured Buttermilk Market Revenue (USD Million) By Regions (2021-2032)
Figure 5. Global Cultured Buttermilk Market Share (%) By Regions (2023)
Figure 6. North America Cultured Buttermilk Revenue (USD Million) By Country (2021-2032)
Figure 7. United States Cultured Buttermilk Revenue (USD Million) By Country (2021-2032)
Figure 8. Canada Cultured Buttermilk Revenue (USD Million) By Country (2021-2032)
Figure 9. Mexico Cultured Buttermilk Revenue (USD Million) By Country (2021-2032)
Figure 10. Europe Cultured Buttermilk Revenue (USD Million) By Country (2021-2032)
Figure 11. Germany Cultured Buttermilk Revenue (USD Million) By Country (2021-2032)
Figure 12. France Cultured Buttermilk Revenue (USD Million) By Country (2021-2032)
Figure 13. United Kingdom Cultured Buttermilk Revenue (USD Million) By Country (2021-2032)
Figure 14. Spain Cultured Buttermilk Revenue (USD Million) By Country (2021-2032)
Figure 15. Italy Cultured Buttermilk Revenue (USD Million) By Country (2021-2032)
Figure 16. Russia Cultured Buttermilk Revenue (USD Million) By Country (2021-2032)
Figure 17. Rest of Europe Cultured Buttermilk Revenue (USD Million) By Country (2021-2032)
Figure 11. Asia Pacific Cultured Buttermilk Revenue (USD Million) By Country (2021-2032)
Figure 12. China Cultured Buttermilk Revenue (USD Million) By Country (2021-2032)
Figure 13. Japan Cultured Buttermilk Revenue (USD Million) By Country (2021-2032)
Figure 14. India Cultured Buttermilk Revenue (USD Million) By Country (2021-2032)
Figure 15. South Korea Cultured Buttermilk Revenue (USD Million) By Country (2021-2032)
Figure 16. Australia Cultured Buttermilk Revenue (USD Million) By Country (2021-2032)
Figure 17. South East Asia Cultured Buttermilk Revenue (USD Million) By Country (2021-2032)
Figure 18. South America Cultured Buttermilk Revenue (USD Million) By Country (2021-2032)
Figure 19. Brazil Cultured Buttermilk Revenue (USD Million) By Country (2021-2032)
Figure 20. Argentina Cultured Buttermilk Revenue (USD Million) By Country (2021-2032)
Figure 21. Rest of Asia Pacific Cultured Buttermilk Revenue (USD Million) By Country (2021-2032)
Figure 22. Middle East and Africa Cultured Buttermilk Revenue (USD Million) By Region (2021-2032)
Figure 23. Saudi Arabia Cultured Buttermilk Revenue (USD Million) By Region (2021-2032)
Figure 24. The UAE Cultured Buttermilk Revenue (USD Million) By Region (2021-2032)
Figure 25. Rest of Middle East Cultured Buttermilk Revenue (USD Million) By Region (2021-2032)
Figure 26. South Africa Cultured Buttermilk Revenue (USD Million) By Region (2021-2032)
Figure 27. Africa Cultured Buttermilk Revenue (USD Million) By Region (2021-2032)
Figure 28. North America Cultured Buttermilk Revenue (USD Million) By Type (2021-2032)
Figure 29. North America Cultured Buttermilk Revenue (USD Million) By Application (2021-2032)
Figure 30. North America Cultured Buttermilk Revenue (USD Million) By Product (2021-2032)
Figure 31. Europe Cultured Buttermilk Revenue (USD Million) By Type (2021-2032)
Figure 32. Europe Cultured Buttermilk Revenue (USD Million) By Application (2021-2032)
Figure 33. Europe Cultured Buttermilk Revenue (USD Million) By Product (2021-2032)
Figure 34. Asia Pacific Cultured Buttermilk Revenue (USD Million) By Type (2021-2032)
Figure 35. Asia Pacific Cultured Buttermilk Revenue (USD Million) By Application (2021-2032)
Figure 36. Asia Pacific Cultured Buttermilk Revenue (USD Million) By Product (2021-2032)
Figure 37. South America Cultured Buttermilk Revenue (USD Million) By Type (2021-2032)
Figure 38. South America Cultured Buttermilk Revenue (USD Million) By Application (2021-2032)
Figure 39. South America Cultured Buttermilk Revenue (USD Million) By Product (2021-2032)
Figure 40. Middle East and Africa Cultured Buttermilk Revenue (USD Million) By Type (2021-2032)
Figure 41. Middle East and Africa Cultured Buttermilk Revenue (USD Million) By Application (2021-2032)
Figure 42. Middle East and Africa Cultured Buttermilk Revenue (USD Million) By Product (2021-2032)
By Application
Bakery
Confectionery
Dairy
Beverages
Others
By Form
Liquid
Powder
By Distribution Channel
Hypermarket/Supermarket
Modern Grocery Stores
Specialty Stores
Convenience Stores
Online Retail
Others
Countries Analyzed
North America (US, Canada, Mexico)
Europe (Germany, UK, France, Spain, Italy, Russia, Rest of Europe)
Asia Pacific (China, India, Japan, South Korea, Australia, South East Asia, Rest of Asia)
South America (Brazil, Argentina, Rest of South America)
Middle East and Africa (Saudi Arabia, UAE, Rest of Middle East, South Africa, Egypt, Rest of Africa)
