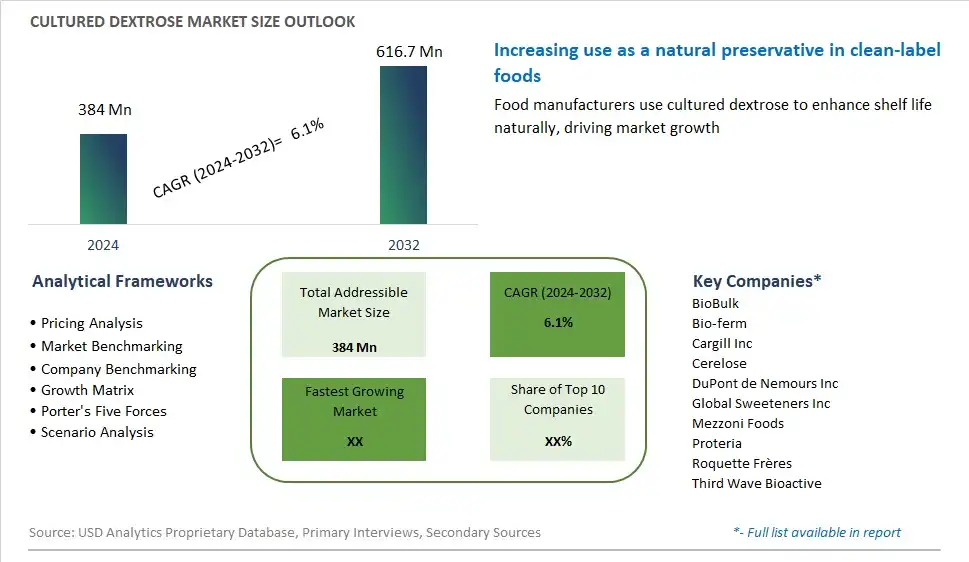
Global Cultured Dextrose Market Size is valued at $384 Million in 2024 and is forecast to register a growth rate (CAGR) of 6.1% to reach $616.7 Million by 2032.
The global Cultured Dextrose Market Comprehensive Study analyzes and forecasts the market size across 6 regions and 24 countries for diverse segments -By Application (Food and Beverages, Dairy Products), By End-User (Food Manufacturers, Beverage Manufacturers), By Distribution Channel (Direct Sales, Retail Sales)
An Introduction to Cultured Dextrose Market
Cultured dextrose is a natural food preservative and flavor enhancer produced through fermentation of dextrose with lactic acid bacteria or yeast in 2024. This process creates a mixture of organic acids, primarily lactic acid, which acts as a preservative to inhibit the growth of harmful bacteria and extend the shelf life of food products. Cultured dextrose is commonly used in a variety of food and beverage applications, including baked goods, dairy products, sauces, dressings, and meat products, to enhance flavor, improve texture, and maintain freshness. As consumer demand for clean label ingredients and natural preservatives continues to grow, the market for cultured dextrose is expanding. Manufacturers are developing innovative formulations and application methods to incorporate cultured dextrose into a wide range of food products, offering consumers safer and more natural alternatives to traditional chemical preservatives while meeting regulatory requirements and ensuring product safety and quality.
Cultured Dextrose Competitive Landscape
The market report analyses the leading companies in the industry including BioBulk, Bio-ferm, Cargill Inc, Cerelose, DuPont de Nemours Inc, Global Sweeteners Inc, Mezzoni Foods, Proteria, Roquette Frères, Third Wave Bioactive, and Others.
Cultured Dextrose Market Dynamics
Cultured Dextrose Market Trend: Growing Demand for Natural and Clean Label Ingredients
A significant trend in the cultured dextrose market is the increasing demand for natural and clean label ingredients in food and beverage products. Consumers are becoming more conscious of the ingredients in their food and are actively seeking products with simpler, more recognizable ingredients. Cultured dextrose, produced through fermentation of glucose by lactic acid bacteria, is perceived as a natural preservative and flavor enhancer, making it appealing to manufacturers looking to replace synthetic additives and preservatives. This trend is driven by concerns over health, wellness, and food safety, as well as changing consumer preferences for cleaner and more transparent food labels. As a result, there is a growing demand for cultured dextrose as a natural alternative to traditional preservatives and sweeteners in a wide range of food and beverage applications.
Market Driver: Demand for Clean Label and Shelf-Life Extension Solutions
A key driver of the cultured dextrose market is the increasing demand for clean label ingredients and solutions to extend the shelf life of food and beverage products. Manufacturers are under pressure to meet consumer demand for products with fewer artificial additives and preservatives while ensuring product safety and stability throughout the supply chain. Cultured dextrose offers a natural and effective solution to extend shelf life by inhibiting the growth of spoilage microorganisms and pathogens, thereby reducing the need for synthetic preservatives. This driver is fueled by regulatory requirements, consumer preferences, and industry trends favoring cleaner and more sustainable food formulations. The demand for cultured dextrose is driven by food and beverage manufacturers seeking to enhance product quality, freshness, and safety while meeting clean label and shelf-life extension requirements, positioning it as a valuable ingredient in the market.
Market Opportunity: Expansion into Functional Food and Beverage Categories
An opportunity for the cultured dextrose market lies in the expansion into functional food and beverage categories to meet the growing demand for health-promoting products. Cultured dextrose offers potential benefits beyond its role as a preservative, including its ability to modulate gut microbiota, improve digestive health, and support immune function. As consumers increasingly prioritize health and wellness, there is a rising interest in functional foods and beverages that offer additional health benefits beyond basic nutrition. By incorporating cultured dextrose into functional food and beverage formulations, manufacturers can enhance the nutritional profile and functional properties of their products, tapping into growing consumer interest in digestive health, immune support, and overall well-being. Additionally, targeting specific consumer segments such as health-conscious individuals, athletes, and aging populations presents opportunities to differentiate products, expand market reach, and capitalize on the growing demand for functional ingredients in the food and beverage market.
Cultured Dextrose Market Share Analysis: Food and Beverages held the dominant market share in 2024
The food and beverages segment is the largest in the cultured dextrose market by application. This dominance is due to the extensive use of cultured dextrose as a natural preservative and flavor enhancer in a wide array of food and beverage products. Cultured dextrose is highly effective at inhibiting the growth of unwanted bacteria, mold, and yeast, which makes it an invaluable ingredient in maintaining the freshness and safety of processed foods. It is commonly found in baked goods, sauces, dressings, snacks, and beverages, providing an all-natural solution to extend shelf life without compromising on taste or quality. The rising consumer demand for clean-label products with natural ingredients has further propelled the use of cultured dextrose in the food and beverage industry. As manufacturers continue to innovate and reformulate products to meet these preferences, the food and beverages segment's reliance on cultured dextrose is expected to remain strong, ensuring its position as the largest segment in this market.
Cultured Dextrose Market Share Analysis: Food Manufacturers market is poised to register the fastest growth rae over the forecast period to 2032
The food manufacturers segment is the fastest-growing in the cultured dextrose market by end-user. This rapid growth is driven by the increasing demand for natural preservatives and clean-label ingredients in the food industry. As consumers become more health-conscious and seek products with fewer artificial additives, food manufacturers are turning to cultured dextrose to meet these preferences. It is highly effective at enhancing the shelf life and safety of a wide variety of food products, including baked goods, snacks, and processed foods, without compromising on flavor or quality. The versatility of cultured dextrose allows it to be used in multiple food categories, further fueling its adoption. Additionally, the trend towards organic and natural food products amplifies the need for natural preservation solutions, positioning cultured dextrose as a preferred choice. The continuous innovation and reformulation efforts by food manufacturers to cater to evolving consumer demands ensure that this segment will maintain its rapid growth trajectory, solidifying its role as the fastest-growing end-user in the cultured dextrose market.
Cultured Dextrose Market Share Analysis: Direct Sales held the dominant market share in 2024
Direct sales is the largest segment in the cultured dextrose market by distribution channel. This dominance is primarily due to the nature of the product, which is often supplied in bulk quantities to large-scale food and beverage manufacturers who prefer to purchase directly from producers. Direct sales channels facilitate better pricing, customized orders, and stronger supplier relationships, which are crucial for maintaining consistent quality and supply chain efficiency. Additionally, direct sales allow manufacturers to receive technical support and product customization, ensuring that the cultured dextrose meets specific application requirements. This channel also provides a streamlined process for bulk transactions, reducing intermediaries and thereby lowering costs. The increasing demand for natural preservatives in the food and beverage industry further strengthens the direct sales channel, as manufacturers seek reliable and direct sources for high-quality cultured dextrose to meet growing consumer preferences for clean-label products. These factors collectively ensure that direct sales remain the largest and most preferred distribution channel in the cultured dextrose market.
Cultured Dextrose Market Segmentation
By Application
Food and Beverages
Dairy Products
By End-User
Food Manufacturers
Beverage Manufacturers
By Distribution Channel
Direct Sales
Retail Sales
Countries Analyzed
North America (US, Canada, Mexico)
Europe (Germany, UK, France, Spain, Italy, Russia, Rest of Europe)
Asia Pacific (China, India, Japan, South Korea, Australia, South East Asia, Rest of Asia)
South America (Brazil, Argentina, Rest of South America)
Middle East and Africa (Saudi Arabia, UAE, Rest of Middle East, South Africa, Egypt, Rest of Africa)
Cultured Dextrose Companies Profiled in the Study
BioBulk
Bio-ferm
Cargill Inc
Cerelose
DuPont de Nemours Inc
Global Sweeteners Inc
Mezzoni Foods
Proteria
Roquette Frères
Third Wave Bioactive
*- List Not Exhaustive
Chapter 1. TABLE OF CONTENTS
Chapter 2. Introduction to Cultured Dextrose Market
2.1. Market Overview
2.2. Key Statistics and Report Highlights
2.3. Scope of the Comprehensive Study
2.3.1. Market Definition
2.3.2 Countries and Regions Covered
2.3.3 Research Objective
2.3.4 Units, Currency, and Conversions
2.3.5 Industry Value Chain
2.4. Key Market Segments
2.5. Key Companies
2.6. Study Period
Chapter 3. Strategic Analysis Review
3.1. Cultured Dextrose Pricing Analysis and Forecast
3.2. Porter’s Five Forces
3.3. Market Ecosystem
3.4. SWOT Analysis
3.5. Regulatory Scenario
3.3. Effects of Inflation, Russia-Ukraine War, moderating economic growth, and other macroeconomic factors
Chapter 4. Competitive Landscape
4.1. Market Share Analysis
4.1.1. Global Cultured Dextrose Market Share by Company, 2023
4.1.2. Product Offerings of Leading Cultured Dextrose Companies
4.2. Market Entropy
4.2.1. New Product Launches in the Industry
4.2.2. Mergers, Acquisitions, Joint ventures, and Partnerships
4.3. Key Strategies and Best Practices
Chapter 5. Global Market Projections: Best, Reference, and Low Case Scenarios
5.1. Growth Analysis- Case Scenario Definitions
5.2. Low Growth Case Scenario Forecasts
5.3. Reference Growth Case Scenario Forecasts
5.4. High Growth Case Scenario Forecasts
Chapter 6. Market Dynamics
6.1. Cultured Dextrose Market Drivers
6.2. Cultured Dextrose Market Challenges
6.6. Cultured Dextrose Market Opportunities
6.4. Cultured Dextrose Market Trends
Chapter 7. Global Cultured Dextrose Market Outlook Trends
7.1. Global Cultured Dextrose Revenue (USD Million) and CAGR (%) by Type (2021-2032)
7.2. Global Cultured Dextrose Revenue (USD Million) and CAGR (%) by Application (2021-2032)
7.3. Global Cultured Dextrose Revenue (USD Million) and CAGR (%) by Product (2021-2032)
By Application
Food and Beverages
Dairy Products
By End-User
Food Manufacturers
Beverage Manufacturers
By Distribution Channel
Direct Sales
Retail Sales
Chapter 8. Global Cultured Dextrose Regional Analysis and Outlook
8.1. Global Cultured Dextrose Revenue (USD Million) By Regions (2021- 2032)
8.2. North America Cultured Dextrose Revenue (USD Million) by Country (2021-2032)
8.2.1. United States Cultured Dextrose Regional Analysis and Outlook
8.2.2. Canada Cultured Dextrose Regional Analysis and Outlook
8.2.3. Mexico Cultured Dextrose Regional Analysis and Outlook
8.3. Europe Cultured Dextrose Revenue (USD Million), by Country (2021-2032)
8.3.1. Germany Cultured Dextrose Regional Analysis and Outlook
8.3.2. France Cultured Dextrose Regional Analysis and Outlook
8.3.3. United Kingdom Cultured Dextrose Regional Analysis and Outlook
8.3.4. Spain Cultured Dextrose Regional Analysis and Outlook
8.3.5. Italy Cultured Dextrose Regional Analysis and Outlook
8.3.6. Russia Cultured Dextrose Regional Analysis and Outlook
8.3.7. Rest of Europe Cultured Dextrose Regional Analysis and Outlook
8.4. Asia Pacific Cultured Dextrose Revenue (USD Million) by Country (2021-2032)
8.4.1. China Cultured Dextrose Regional Analysis and Outlook
8.4.2. Japan Cultured Dextrose Regional Analysis and Outlook
8.4.3. India Cultured Dextrose Regional Analysis and Outlook
8.4.4. South Korea Cultured Dextrose Regional Analysis and Outlook
8.4.5. Australia Cultured Dextrose Regional Analysis and Outlook
8.4.6. South East Asia Cultured Dextrose Regional Analysis and Outlook
8.4.7. Rest of Asia Pacific Cultured Dextrose Regional Analysis and Outlook
8.5. South America Cultured Dextrose Revenue (USD Million), by Country (2021-2032)
8.5.1. Brazil Cultured Dextrose Regional Analysis and Outlook
8.5.2. Argentina Cultured Dextrose Regional Analysis and Outlook
8.5.3. Rest of South America Cultured Dextrose Regional Analysis and Outlook
8.6. Middle East and Africa Cultured Dextrose Revenue (USD Million) by Country (2021-2032)
8.6.1. Middle East Cultured Dextrose Regional Analysis and Outlook
8.6.2. Africa Cultured Dextrose Regional Analysis and Outlook
Chapter 9. North America Cultured Dextrose Analysis and Outlook
9.1. North America Cultured Dextrose Revenue (USD Million) by Segments (2021-2032)
9.1.1. North America Cultured Dextrose Revenue (USD Million) by Type (2021-2032)
9.1.2. North America Cultured Dextrose Revenue (USD Million) by Application (2021-2032)
9.1.3. North America Cultured Dextrose Revenue (USD Million) by Product (2021-2032)
By Application
Food and Beverages
Dairy Products
By End-User
Food Manufacturers
Beverage Manufacturers
By Distribution Channel
Direct Sales
Retail Sales
Chapter 10. Europe Cultured Dextrose Analysis and Outlook
10.1. Europe Cultured Dextrose Revenue (USD Million), by Segments (USD Million) (2021-2032)
10.1.1. Europe Cultured Dextrose Revenue (USD Million) by Type (2021-2032)
10.1.2. Europe Cultured Dextrose Revenue (USD Million) by Application (2021-2032)
10.1.3. Europe Cultured Dextrose Revenue (USD Million) by Product (2021-2032)
By Application
Food and Beverages
Dairy Products
By End-User
Food Manufacturers
Beverage Manufacturers
By Distribution Channel
Direct Sales
Retail Sales
Chapter 11. Asia Pacific Cultured Dextrose Analysis and Outlook
11.1. Asia Pacific Cultured Dextrose Revenue (USD Million), and Revenue (USD Million) by Segments (2021-2032)
11.1.1. Asia Pacific Cultured Dextrose Revenue (USD Million) by Type (2021-2032)
11.1.2. Asia Pacific Cultured Dextrose Revenue (USD Million) by Application (2021-2032)
11.1.3. Asia Pacific Cultured Dextrose Revenue (USD Million) by Product (2021-2032)
By Application
Food and Beverages
Dairy Products
By End-User
Food Manufacturers
Beverage Manufacturers
By Distribution Channel
Direct Sales
Retail Sales
Chapter 12. South America Cultured Dextrose Analysis and Outlook
12.1. South America Cultured Dextrose Revenue (USD Million), by Segments (2021-2032)
12.1.1. South America Cultured Dextrose Revenue (USD Million) by Type (2021-2032)
12.1.2. South America Cultured Dextrose Revenue (USD Million) by Application (2021-2032)
12.1.3. South America Cultured Dextrose Revenue (USD Million) by Product (2021-2032)
By Application
Food and Beverages
Dairy Products
By End-User
Food Manufacturers
Beverage Manufacturers
By Distribution Channel
Direct Sales
Retail Sales
Chapter 13. Middle East and Africa Cultured Dextrose Analysis and Outlook
13.1. Middle East and Africa Cultured Dextrose Revenue (USD Million), by Segments (2021-2032)
13.1.1. Middle East and Africa Cultured Dextrose Revenue (USD Million) by Type (2021-2032)
13.1.2. Middle East and Africa Cultured Dextrose Revenue (USD Million) by Application (2021-2032)
13.1.3. Middle East and Africa Cultured Dextrose Revenue (USD Million) by Product (2021-2032)
By Application
Food and Beverages
Dairy Products
By End-User
Food Manufacturers
Beverage Manufacturers
By Distribution Channel
Direct Sales
Retail Sales
Chapter 14. Cultured Dextrose Company Profiles
14.1 Business Overview
14.2 Product Profiles
14.3 SWOT Profiles
14.5 Recent Developments
14.6 Financial Profile
List of Companies
BioBulk
Bio-ferm
Cargill Inc
Cerelose
DuPont de Nemours Inc
Global Sweeteners Inc
Mezzoni Foods
Proteria
Roquette Frères
Third Wave Bioactive
15. Methodology and Data Sources
15.1 Customization Offerings
15.2 Subscription Services
15.3 Related Reports
15.4 Publisher Expertise
LIST OF TABLES
Table 1 Market Segmentation Analysis
Table 2 Global Cultured Dextrose Market Share of Leading Companies, 2023
Table 3 Product Offerings of Leading Companies
Table 4 Low Growth Scenario Forecasts
Table 5 Reference Case Growth Scenario
Table 6 High Growth Case Scenario
Table 7 Global Cultured Dextrose Revenue (USD Million) And CAGR (%) By Type (2021-2032)
Table 8 Global Cultured Dextrose Revenue (USD Million) And CAGR (%) By Application (2021-2032)
Table 9 Global Cultured Dextrose Revenue (USD Million) And CAGR (%) By Product (2021-2032)
Table 10 Global Cultured Dextrose Market Revenue (USD Million) By Regions (2021-2032)
Table 11 Global Cultured Dextrose Market Share (%) By Regions (2021-2032)
Table 12 North America Cultured Dextrose Revenue (USD Million) By Country (2021-2032)
Table 13 Europe Cultured Dextrose Revenue (USD Million) By Country (2021-2032)
Table 14 Asia Pacific Cultured Dextrose Revenue (USD Million) By Country (2021-2032)
Table 15 South America Cultured Dextrose Revenue (USD Million) By Country (2021-2032)
Table 16 Middle East and Africa Cultured Dextrose Revenue (USD Million) By Region (2021-2032)
Table 17 North America Cultured Dextrose Revenue (USD Million) By Type (2021-2032)
Table 18 North America Cultured Dextrose Revenue (USD Million) By Application (2021-2032)
Table 19 North America Cultured Dextrose Revenue (USD Million) By Product (2021-2032)
Table 20 Europe Cultured Dextrose Revenue (USD Million) By Type (2021-2032)
Table 21 Europe Cultured Dextrose Revenue (USD Million) By Application (2021-2032)
Table 22 Europe Cultured Dextrose Revenue (USD Million) By Product (2021-2032)
Table 23 Asia Pacific Cultured Dextrose Revenue (USD Million) By Type (2021-2032)
Table 24 Asia Pacific Cultured Dextrose Revenue (USD Million) By Application (2021-2032)
Table 25 Asia Pacific Cultured Dextrose Revenue (USD Million) By Product (2021-2032)
Table 26 South America Cultured Dextrose Revenue (USD Million) By Type (2021-2032)
Table 27 South America Cultured Dextrose Revenue (USD Million) By Application (2021-2032)
Table 28 South America Cultured Dextrose Revenue (USD Million) By Product (2021-2032)
Table 29 Middle East and Africa Cultured Dextrose Revenue (USD Million) By Type (2021-2032)
Table 30 Middle East and Africa Cultured Dextrose Revenue (USD Million) By Application (2021-2032)
Table 31 Middle East and Africa Cultured Dextrose Revenue (USD Million) By Product (2021-2032)
LIST OF FIGURES
Figure 1. Market Scope
Figure 2. Pricing Forecasts Per Unit, 2023- 2032
Figure 3. Porter’s Five Forces
Figure 4. Global Cultured Dextrose Market Revenue (USD Million) By Regions (2021-2032)
Figure 5. Global Cultured Dextrose Market Share (%) By Regions (2023)
Figure 6. North America Cultured Dextrose Revenue (USD Million) By Country (2021-2032)
Figure 7. United States Cultured Dextrose Revenue (USD Million) By Country (2021-2032)
Figure 8. Canada Cultured Dextrose Revenue (USD Million) By Country (2021-2032)
Figure 9. Mexico Cultured Dextrose Revenue (USD Million) By Country (2021-2032)
Figure 10. Europe Cultured Dextrose Revenue (USD Million) By Country (2021-2032)
Figure 11. Germany Cultured Dextrose Revenue (USD Million) By Country (2021-2032)
Figure 12. France Cultured Dextrose Revenue (USD Million) By Country (2021-2032)
Figure 13. United Kingdom Cultured Dextrose Revenue (USD Million) By Country (2021-2032)
Figure 14. Spain Cultured Dextrose Revenue (USD Million) By Country (2021-2032)
Figure 15. Italy Cultured Dextrose Revenue (USD Million) By Country (2021-2032)
Figure 16. Russia Cultured Dextrose Revenue (USD Million) By Country (2021-2032)
Figure 17. Rest of Europe Cultured Dextrose Revenue (USD Million) By Country (2021-2032)
Figure 11. Asia Pacific Cultured Dextrose Revenue (USD Million) By Country (2021-2032)
Figure 12. China Cultured Dextrose Revenue (USD Million) By Country (2021-2032)
Figure 13. Japan Cultured Dextrose Revenue (USD Million) By Country (2021-2032)
Figure 14. India Cultured Dextrose Revenue (USD Million) By Country (2021-2032)
Figure 15. South Korea Cultured Dextrose Revenue (USD Million) By Country (2021-2032)
Figure 16. Australia Cultured Dextrose Revenue (USD Million) By Country (2021-2032)
Figure 17. South East Asia Cultured Dextrose Revenue (USD Million) By Country (2021-2032)
Figure 18. South America Cultured Dextrose Revenue (USD Million) By Country (2021-2032)
Figure 19. Brazil Cultured Dextrose Revenue (USD Million) By Country (2021-2032)
Figure 20. Argentina Cultured Dextrose Revenue (USD Million) By Country (2021-2032)
Figure 21. Rest of Asia Pacific Cultured Dextrose Revenue (USD Million) By Country (2021-2032)
Figure 22. Middle East and Africa Cultured Dextrose Revenue (USD Million) By Region (2021-2032)
Figure 23. Saudi Arabia Cultured Dextrose Revenue (USD Million) By Region (2021-2032)
Figure 24. The UAE Cultured Dextrose Revenue (USD Million) By Region (2021-2032)
Figure 25. Rest of Middle East Cultured Dextrose Revenue (USD Million) By Region (2021-2032)
Figure 26. South Africa Cultured Dextrose Revenue (USD Million) By Region (2021-2032)
Figure 27. Africa Cultured Dextrose Revenue (USD Million) By Region (2021-2032)
Figure 28. North America Cultured Dextrose Revenue (USD Million) By Type (2021-2032)
Figure 29. North America Cultured Dextrose Revenue (USD Million) By Application (2021-2032)
Figure 30. North America Cultured Dextrose Revenue (USD Million) By Product (2021-2032)
Figure 31. Europe Cultured Dextrose Revenue (USD Million) By Type (2021-2032)
Figure 32. Europe Cultured Dextrose Revenue (USD Million) By Application (2021-2032)
Figure 33. Europe Cultured Dextrose Revenue (USD Million) By Product (2021-2032)
Figure 34. Asia Pacific Cultured Dextrose Revenue (USD Million) By Type (2021-2032)
Figure 35. Asia Pacific Cultured Dextrose Revenue (USD Million) By Application (2021-2032)
Figure 36. Asia Pacific Cultured Dextrose Revenue (USD Million) By Product (2021-2032)
Figure 37. South America Cultured Dextrose Revenue (USD Million) By Type (2021-2032)
Figure 38. South America Cultured Dextrose Revenue (USD Million) By Application (2021-2032)
Figure 39. South America Cultured Dextrose Revenue (USD Million) By Product (2021-2032)
Figure 40. Middle East and Africa Cultured Dextrose Revenue (USD Million) By Type (2021-2032)
Figure 41. Middle East and Africa Cultured Dextrose Revenue (USD Million) By Application (2021-2032)
Figure 42. Middle East and Africa Cultured Dextrose Revenue (USD Million) By Product (2021-2032)
By Application
Food and Beverages
Dairy Products
By End-User
Food Manufacturers
Beverage Manufacturers
By Distribution Channel
Direct Sales
Retail Sales
Countries Analyzed
North America (US, Canada, Mexico)
Europe (Germany, UK, France, Spain, Italy, Russia, Rest of Europe)
Asia Pacific (China, India, Japan, South Korea, Australia, South East Asia, Rest of Asia)
South America (Brazil, Argentina, Rest of South America)
Middle East and Africa (Saudi Arabia, UAE, Rest of Middle East, South Africa, Egypt, Rest of Africa)
