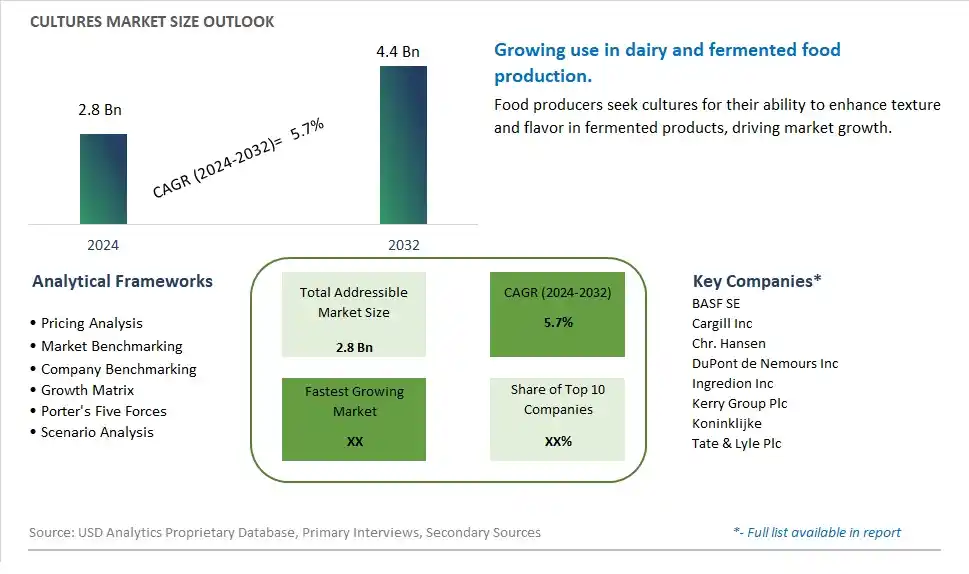
Global Cultures Market Size is valued at $2.8 Billion in 2024 and is forecast to register a growth rate (CAGR) of 5.7% to reach $4.4 Billion by 2032.
The global Cultures Market Comprehensive Study analyzes and forecasts the market size across 6 regions and 24 countries for diverse segments -By Product (Starter, Adjunct, Probiotic, Others), By Application (Beverages, Sauces, dressings, and condiments, Bakery & Confectionery, Dried Processed Food, Sweet & Savory Snacks, Frozen and Chilled processed food, Others)
An Introduction to Cultures Market
The Cultures market in 2024 is expanding robustly, driven by the increasing demand for microbial cultures in the food and beverage, pharmaceutical, and agricultural industries. Cultures, including bacterial, yeast, and fungal strains, are used for fermentation, bioprocessing, and bio-preservation. The market is supported by the growing trend towards natural and functional food products. Advances in biotechnology and fermentation technologies are enhancing the efficacy, safety, and application versatility of microbial cultures. The market is also benefiting from the trend towards clean-label and sustainable production practices, appealing to manufacturers and consumers seeking high-quality and natural bioprocessing solutions.
Cultures Competitive Landscape
The market report analyses the leading companies in the industry including BASF SE, Cargill Inc, Chr. Hansen, DuPont de Nemours Inc, Ingredion Inc, Kerry Group Plc, Koninklijke, Tate & Lyle Plc, and Others.
Cultures Market Dynamics
Cultures Market Trend: Increased Demand for Fermented Foods and Beverages
One prominent market trend in the cultures market is the increased demand for fermented foods and beverages. As consumers become more interested in gut health, probiotics, and natural food preservation methods, there is a growing preference for products that undergo fermentation using specific cultures. This trend is driving the demand for cultures used in yogurt, kefir, kombucha, kimchi, and other fermented products.
Cultures Market Driver: Health-Conscious Consumer Preferences
A significant market driver for cultures is the shift towards health-conscious consumer preferences. Consumers are seeking foods and beverages that offer functional health benefits, including improved digestion, immune support, and gut microbiome balance. Cultures play a vital role in creating fermented products that provide these health benefits, driving the demand for cultures among food and beverage manufacturers.
Cultures Market Opportunity: Innovation in Plant-Based and Non-Dairy Cultures
An exciting potential opportunity in the cultures market lies in innovation in plant-based and non-dairy cultures. With the rise of veganism, lactose intolerance, and plant-based diets, there is a growing demand for cultures that can ferment non-dairy alternatives such as plant-based milks, coconut yogurt, and cashew cheese. Manufacturers can capitalize on this opportunity by developing cultures specifically tailored for plant-based applications, catering to a broader range of dietary preferences and expanding their market reach.
Cultures Market Share Analysis: Probiotic segment generated the highest revenue share in the industry
The Probiotic segment is the largest in the Cultures Market. This dominance is largely due to the growing consumer awareness of the health benefits associated with probiotics, such as improved gut health, enhanced immune response, and reduced inflammation. Probiotics are widely used in dairy products like yogurts, kefir, and cultured milk, which have seen increased consumption as consumers seek healthier dietary options. Additionally, the expansion of probiotic applications into non-dairy products like dietary supplements and functional foods has broadened the market reach. The increasing research supporting the health benefits of probiotics and the rising trend of personalized nutrition are further driving the demand. With ongoing innovations in probiotic strains and formulations that improve their efficacy and stability, the probiotic segment is expected to maintain its leading position in the cultures market.
Cultures Market Share Analysis: Beverages is the fastest growing segment over the forecast period to 2032
The Beverages segment is expected to be the fastest-growing in the Cultures Market by 2032. This growth is propelled by the rising popularity of fermented beverages like kombucha, kefir, and probiotic juices among health-conscious consumers. The increasing demand for these beverages is driven by their perceived benefits for digestive health, metabolism, and overall wellness. Beverage manufacturers are continuously innovating with new flavors and formulations to attract a broader consumer base, further fueling this segment's expansion. Additionally, the convenience of consuming probiotics and other beneficial cultures through beverages aligns with the fast-paced lifestyles of modern consumers, enhancing the appeal of cultured beverages. As awareness of the health benefits of cultured and fermented beverages continues to grow, and as the global inclination towards functional drinks intensifies, the Beverages segment is set to experience significant growth, making it the fastest-growing sector within the cultures market.
Cultures Market Segmentation
By Product
Starter
Adjunct
Probiotic
Others
By Application
Beverages
Sauces, dressings, and condiments
Bakery & Confectionery
Dried Processed Food
Sweet & Savory Snacks
Frozen and Chilled processed food
Others
Countries Analyzed
North America (US, Canada, Mexico)
Europe (Germany, UK, France, Spain, Italy, Russia, Rest of Europe)
Asia Pacific (China, India, Japan, South Korea, Australia, South East Asia, Rest of Asia)
South America (Brazil, Argentina, Rest of South America)
Middle East and Africa (Saudi Arabia, UAE, Rest of Middle East, South Africa, Egypt, Rest of Africa)
Cultures Companies Profiled in the Study
BASF SE
Cargill Inc
Chr. Hansen
DuPont de Nemours Inc
Ingredion Inc
Kerry Group Plc
Koninklijke
Tate & Lyle Plc
*- List Not Exhaustive
Chapter 1. TABLE OF CONTENTS
Chapter 2. Introduction to Cultures Market
2.1. Market Overview
2.2. Key Statistics and Report Highlights
2.3. Scope of the Comprehensive Study
2.3.1. Market Definition
2.3.2 Countries and Regions Covered
2.3.3 Research Objective
2.3.4 Units, Currency, and Conversions
2.3.5 Industry Value Chain
2.4. Key Market Segments
2.5. Key Companies
2.6. Study Period
Chapter 3. Strategic Analysis Review
3.1. Cultures Pricing Analysis and Forecast
3.2. Porter’s Five Forces
3.3. Market Ecosystem
3.4. SWOT Analysis
3.5. Regulatory Scenario
3.3. Effects of Inflation, Russia-Ukraine War, moderating economic growth, and other macroeconomic factors
Chapter 4. Competitive Landscape
4.1. Market Share Analysis
4.1.1. Global Cultures Market Share by Company, 2023
4.1.2. Product Offerings of Leading Cultures Companies
4.2. Market Entropy
4.2.1. New Product Launches in the Industry
4.2.2. Mergers, Acquisitions, Joint ventures, and Partnerships
4.3. Key Strategies and Best Practices
Chapter 5. Global Market Projections: Best, Reference, and Low Case Scenarios
5.1. Growth Analysis- Case Scenario Definitions
5.2. Low Growth Case Scenario Forecasts
5.3. Reference Growth Case Scenario Forecasts
5.4. High Growth Case Scenario Forecasts
Chapter 6. Market Dynamics
6.1. Cultures Market Drivers
6.2. Cultures Market Challenges
6.6. Cultures Market Opportunities
6.4. Cultures Market Trends
Chapter 7. Global Cultures Market Outlook Trends
7.1. Global Cultures Revenue (USD Million) and CAGR (%) by Type (2021-2032)
7.2. Global Cultures Revenue (USD Million) and CAGR (%) by Application (2021-2032)
7.3. Global Cultures Revenue (USD Million) and CAGR (%) by Product (2021-2032)
By Product
Starter
Adjunct
Probiotic
Others
By Application
Beverages
Sauces, dressings, and condiments
Bakery & Confectionery
Dried Processed Food
Sweet & Savory Snacks
Frozen and Chilled processed food
Others
Chapter 8. Global Cultures Regional Analysis and Outlook
8.1. Global Cultures Revenue (USD Million) By Regions (2021- 2032)
8.2. North America Cultures Revenue (USD Million) by Country (2021-2032)
8.2.1. United States Cultures Regional Analysis and Outlook
8.2.2. Canada Cultures Regional Analysis and Outlook
8.2.3. Mexico Cultures Regional Analysis and Outlook
8.3. Europe Cultures Revenue (USD Million), by Country (2021-2032)
8.3.1. Germany Cultures Regional Analysis and Outlook
8.3.2. France Cultures Regional Analysis and Outlook
8.3.3. United Kingdom Cultures Regional Analysis and Outlook
8.3.4. Spain Cultures Regional Analysis and Outlook
8.3.5. Italy Cultures Regional Analysis and Outlook
8.3.6. Russia Cultures Regional Analysis and Outlook
8.3.7. Rest of Europe Cultures Regional Analysis and Outlook
8.4. Asia Pacific Cultures Revenue (USD Million) by Country (2021-2032)
8.4.1. China Cultures Regional Analysis and Outlook
8.4.2. Japan Cultures Regional Analysis and Outlook
8.4.3. India Cultures Regional Analysis and Outlook
8.4.4. South Korea Cultures Regional Analysis and Outlook
8.4.5. Australia Cultures Regional Analysis and Outlook
8.4.6. South East Asia Cultures Regional Analysis and Outlook
8.4.7. Rest of Asia Pacific Cultures Regional Analysis and Outlook
8.5. South America Cultures Revenue (USD Million), by Country (2021-2032)
8.5.1. Brazil Cultures Regional Analysis and Outlook
8.5.2. Argentina Cultures Regional Analysis and Outlook
8.5.3. Rest of South America Cultures Regional Analysis and Outlook
8.6. Middle East and Africa Cultures Revenue (USD Million) by Country (2021-2032)
8.6.1. Middle East Cultures Regional Analysis and Outlook
8.6.2. Africa Cultures Regional Analysis and Outlook
Chapter 9. North America Cultures Analysis and Outlook
9.1. North America Cultures Revenue (USD Million) by Segments (2021-2032)
9.1.1. North America Cultures Revenue (USD Million) by Type (2021-2032)
9.1.2. North America Cultures Revenue (USD Million) by Application (2021-2032)
9.1.3. North America Cultures Revenue (USD Million) by Product (2021-2032)
By Product
Starter
Adjunct
Probiotic
Others
By Application
Beverages
Sauces, dressings, and condiments
Bakery & Confectionery
Dried Processed Food
Sweet & Savory Snacks
Frozen and Chilled processed food
Others
Chapter 10. Europe Cultures Analysis and Outlook
10.1. Europe Cultures Revenue (USD Million), by Segments (USD Million) (2021-2032)
10.1.1. Europe Cultures Revenue (USD Million) by Type (2021-2032)
10.1.2. Europe Cultures Revenue (USD Million) by Application (2021-2032)
10.1.3. Europe Cultures Revenue (USD Million) by Product (2021-2032)
By Product
Starter
Adjunct
Probiotic
Others
By Application
Beverages
Sauces, dressings, and condiments
Bakery & Confectionery
Dried Processed Food
Sweet & Savory Snacks
Frozen and Chilled processed food
Others
Chapter 11. Asia Pacific Cultures Analysis and Outlook
11.1. Asia Pacific Cultures Revenue (USD Million), and Revenue (USD Million) by Segments (2021-2032)
11.1.1. Asia Pacific Cultures Revenue (USD Million) by Type (2021-2032)
11.1.2. Asia Pacific Cultures Revenue (USD Million) by Application (2021-2032)
11.1.3. Asia Pacific Cultures Revenue (USD Million) by Product (2021-2032)
By Product
Starter
Adjunct
Probiotic
Others
By Application
Beverages
Sauces, dressings, and condiments
Bakery & Confectionery
Dried Processed Food
Sweet & Savory Snacks
Frozen and Chilled processed food
Others
Chapter 12. South America Cultures Analysis and Outlook
12.1. South America Cultures Revenue (USD Million), by Segments (2021-2032)
12.1.1. South America Cultures Revenue (USD Million) by Type (2021-2032)
12.1.2. South America Cultures Revenue (USD Million) by Application (2021-2032)
12.1.3. South America Cultures Revenue (USD Million) by Product (2021-2032)
By Product
Starter
Adjunct
Probiotic
Others
By Application
Beverages
Sauces, dressings, and condiments
Bakery & Confectionery
Dried Processed Food
Sweet & Savory Snacks
Frozen and Chilled processed food
Others
Chapter 13. Middle East and Africa Cultures Analysis and Outlook
13.1. Middle East and Africa Cultures Revenue (USD Million), by Segments (2021-2032)
13.1.1. Middle East and Africa Cultures Revenue (USD Million) by Type (2021-2032)
13.1.2. Middle East and Africa Cultures Revenue (USD Million) by Application (2021-2032)
13.1.3. Middle East and Africa Cultures Revenue (USD Million) by Product (2021-2032)
By Product
Starter
Adjunct
Probiotic
Others
By Application
Beverages
Sauces, dressings, and condiments
Bakery & Confectionery
Dried Processed Food
Sweet & Savory Snacks
Frozen and Chilled processed food
Others
Chapter 14. Cultures Company Profiles
14.1 Business Overview
14.2 Product Profiles
14.3 SWOT Profiles
14.5 Recent Developments
14.6 Financial Profile
List of Companies
BASF SE
Cargill Inc
Chr. Hansen
DuPont de Nemours Inc
Ingredion Inc
Kerry Group Plc
Koninklijke
Tate & Lyle Plc
15. Methodology and Data Sources
15.1 Customization Offerings
15.2 Subscription Services
15.3 Related Reports
15.4 Publisher Expertise
LIST OF TABLES
Table 1 Market Segmentation Analysis
Table 2 Global Cultures Market Share of Leading Companies, 2023
Table 3 Product Offerings of Leading Companies
Table 4 Low Growth Scenario Forecasts
Table 5 Reference Case Growth Scenario
Table 6 High Growth Case Scenario
Table 7 Global Cultures Revenue (USD Million) And CAGR (%) By Type (2021-2032)
Table 8 Global Cultures Revenue (USD Million) And CAGR (%) By Application (2021-2032)
Table 9 Global Cultures Revenue (USD Million) And CAGR (%) By Product (2021-2032)
Table 10 Global Cultures Market Revenue (USD Million) By Regions (2021-2032)
Table 11 Global Cultures Market Share (%) By Regions (2021-2032)
Table 12 North America Cultures Revenue (USD Million) By Country (2021-2032)
Table 13 Europe Cultures Revenue (USD Million) By Country (2021-2032)
Table 14 Asia Pacific Cultures Revenue (USD Million) By Country (2021-2032)
Table 15 South America Cultures Revenue (USD Million) By Country (2021-2032)
Table 16 Middle East and Africa Cultures Revenue (USD Million) By Region (2021-2032)
Table 17 North America Cultures Revenue (USD Million) By Type (2021-2032)
Table 18 North America Cultures Revenue (USD Million) By Application (2021-2032)
Table 19 North America Cultures Revenue (USD Million) By Product (2021-2032)
Table 20 Europe Cultures Revenue (USD Million) By Type (2021-2032)
Table 21 Europe Cultures Revenue (USD Million) By Application (2021-2032)
Table 22 Europe Cultures Revenue (USD Million) By Product (2021-2032)
Table 23 Asia Pacific Cultures Revenue (USD Million) By Type (2021-2032)
Table 24 Asia Pacific Cultures Revenue (USD Million) By Application (2021-2032)
Table 25 Asia Pacific Cultures Revenue (USD Million) By Product (2021-2032)
Table 26 South America Cultures Revenue (USD Million) By Type (2021-2032)
Table 27 South America Cultures Revenue (USD Million) By Application (2021-2032)
Table 28 South America Cultures Revenue (USD Million) By Product (2021-2032)
Table 29 Middle East and Africa Cultures Revenue (USD Million) By Type (2021-2032)
Table 30 Middle East and Africa Cultures Revenue (USD Million) By Application (2021-2032)
Table 31 Middle East and Africa Cultures Revenue (USD Million) By Product (2021-2032)
LIST OF FIGURES
Figure 1. Market Scope
Figure 2. Pricing Forecasts Per Unit, 2023- 2032
Figure 3. Porter’s Five Forces
Figure 4. Global Cultures Market Revenue (USD Million) By Regions (2021-2032)
Figure 5. Global Cultures Market Share (%) By Regions (2023)
Figure 6. North America Cultures Revenue (USD Million) By Country (2021-2032)
Figure 7. United States Cultures Revenue (USD Million) By Country (2021-2032)
Figure 8. Canada Cultures Revenue (USD Million) By Country (2021-2032)
Figure 9. Mexico Cultures Revenue (USD Million) By Country (2021-2032)
Figure 10. Europe Cultures Revenue (USD Million) By Country (2021-2032)
Figure 11. Germany Cultures Revenue (USD Million) By Country (2021-2032)
Figure 12. France Cultures Revenue (USD Million) By Country (2021-2032)
Figure 13. United Kingdom Cultures Revenue (USD Million) By Country (2021-2032)
Figure 14. Spain Cultures Revenue (USD Million) By Country (2021-2032)
Figure 15. Italy Cultures Revenue (USD Million) By Country (2021-2032)
Figure 16. Russia Cultures Revenue (USD Million) By Country (2021-2032)
Figure 17. Rest of Europe Cultures Revenue (USD Million) By Country (2021-2032)
Figure 11. Asia Pacific Cultures Revenue (USD Million) By Country (2021-2032)
Figure 12. China Cultures Revenue (USD Million) By Country (2021-2032)
Figure 13. Japan Cultures Revenue (USD Million) By Country (2021-2032)
Figure 14. India Cultures Revenue (USD Million) By Country (2021-2032)
Figure 15. South Korea Cultures Revenue (USD Million) By Country (2021-2032)
Figure 16. Australia Cultures Revenue (USD Million) By Country (2021-2032)
Figure 17. South East Asia Cultures Revenue (USD Million) By Country (2021-2032)
Figure 18. South America Cultures Revenue (USD Million) By Country (2021-2032)
Figure 19. Brazil Cultures Revenue (USD Million) By Country (2021-2032)
Figure 20. Argentina Cultures Revenue (USD Million) By Country (2021-2032)
Figure 21. Rest of Asia Pacific Cultures Revenue (USD Million) By Country (2021-2032)
Figure 22. Middle East and Africa Cultures Revenue (USD Million) By Region (2021-2032)
Figure 23. Saudi Arabia Cultures Revenue (USD Million) By Region (2021-2032)
Figure 24. The UAE Cultures Revenue (USD Million) By Region (2021-2032)
Figure 25. Rest of Middle East Cultures Revenue (USD Million) By Region (2021-2032)
Figure 26. South Africa Cultures Revenue (USD Million) By Region (2021-2032)
Figure 27. Africa Cultures Revenue (USD Million) By Region (2021-2032)
Figure 28. North America Cultures Revenue (USD Million) By Type (2021-2032)
Figure 29. North America Cultures Revenue (USD Million) By Application (2021-2032)
Figure 30. North America Cultures Revenue (USD Million) By Product (2021-2032)
Figure 31. Europe Cultures Revenue (USD Million) By Type (2021-2032)
Figure 32. Europe Cultures Revenue (USD Million) By Application (2021-2032)
Figure 33. Europe Cultures Revenue (USD Million) By Product (2021-2032)
Figure 34. Asia Pacific Cultures Revenue (USD Million) By Type (2021-2032)
Figure 35. Asia Pacific Cultures Revenue (USD Million) By Application (2021-2032)
Figure 36. Asia Pacific Cultures Revenue (USD Million) By Product (2021-2032)
Figure 37. South America Cultures Revenue (USD Million) By Type (2021-2032)
Figure 38. South America Cultures Revenue (USD Million) By Application (2021-2032)
Figure 39. South America Cultures Revenue (USD Million) By Product (2021-2032)
Figure 40. Middle East and Africa Cultures Revenue (USD Million) By Type (2021-2032)
Figure 41. Middle East and Africa Cultures Revenue (USD Million) By Application (2021-2032)
Figure 42. Middle East and Africa Cultures Revenue (USD Million) By Product (2021-2032)
By Product
Starter
Adjunct
Probiotic
Others
By Application
Beverages
Sauces, dressings, and condiments
Bakery & Confectionery
Dried Processed Food
Sweet & Savory Snacks
Frozen and Chilled processed food
Others
Countries Analyzed
North America (US, Canada, Mexico)
Europe (Germany, UK, France, Spain, Italy, Russia, Rest of Europe)
Asia Pacific (China, India, Japan, South Korea, Australia, South East Asia, Rest of Asia)
South America (Brazil, Argentina, Rest of South America)
Middle East and Africa (Saudi Arabia, UAE, Rest of Middle East, South Africa, Egypt, Rest of Africa)
