
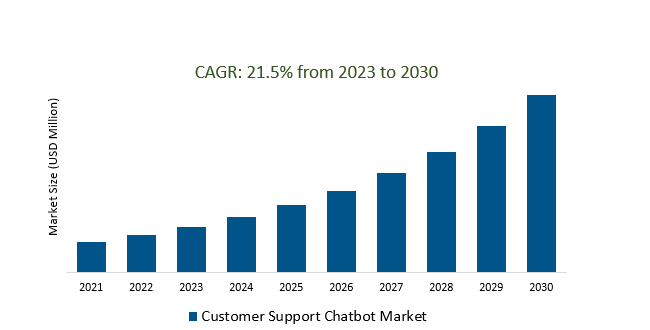
The Global Customer Support Chatbot Market Size is estimated to register 21.5% growth over the forecast period from 2023 to 2030.
The market growth is driven by increasing Chatbots that are seamlessly integrated into popular messaging platforms for enhanced accessibility and user engagement. Leading Companies focusing on, Enhanced Cognitive Capabilities, IoT Integration for Smart Support, Voice-Enabled Chatbot Experiences, Real-Time Language Translation, and others to boost market shares in the industry.
The Customer Support Chatbot Market has undergone substantial growth, driven by the demand for efficient customer support solutions. These AI-powered chatbots offer automation, 24/7 availability, and integration with diverse channels, optimizing customer service processes. Notable features include advancements in NLP, personalization, and the rise of AI-driven virtual assistants. Cloud-based solutions, analytics tools, and a focus on user experience contribute to the market's appeal. Challenges include accurate language understanding and ethical considerations, while opportunities lie in technologies like voice recognition and augmented reality. The market encompasses various players catering to industries such as e-commerce and healthcare, with the landscape continually evolving.
Advancements in NLP are enhancing the intelligence of Customer Support Chatbots, enabling more sophisticated and context-aware handling of customer queries. These breakthroughs allow chatbots to understand not only the literal meaning of words but also the intent and sentiment behind them, leading to precise and tailored responses. Businesses leveraging NLP-driven chatbots are experiencing significant improvements in customer engagement and satisfaction, bridging the gap between automated support and a more human-like conversational experience.
The escalating demand for automated customer support solutions is a key driver propelling the growth of the Customer Support Chatbot Market. Businesses are increasingly adopting AI-powered chatbots to streamline support processes, aiming for operational efficiency and cost reduction. These chatbots offer proactive and 24/7 support, contributing to consistent and scalable customer service. Recognizing the potential of chatbots to enhance customer satisfaction, organizations are fueling the market's expansion, reshaping customer service across various industries.
The integration capabilities of chatbots across multiple customer support channels are augmenting their effectiveness in the Customer Support Chatbot Market. Recognizing the significance of seamless integration with platforms like websites, mobile apps, messaging services, and social media, businesses are leveraging chatbots for a unified and accessible customer support experience. This adaptability ensures engagement with users across various channels, leading to improved interactions and heightened customer satisfaction. The trend reflects a pivotal shift in the evolution of chatbots towards enhancing customer engagement in the diverse landscape of modern communication channels.
The Global Customer Support Chatbot Market is analyzed across Solutions, Services, and others. The solution is poised to register the fastest growth. Solutions in the Customer Support Chatbot Market involve deploying AI-driven chatbots to automate and enhance customer support. These solutions, powered by advanced NLP and integration capabilities, deliver personalized and context-aware responses across various channels. Cloud-based deployment ensures scalability and analytics tools provide insights for continuous improvement. As businesses strive to streamline customer interactions, these solutions offer an efficient strategy to optimize support services and elevate overall customer satisfaction.
The Global Customer Support Chatbot Market is analyzed across various applications including E-Commerce, Finance, Healthcare, and others. Of these, E-Commerce held a significant market share in 2023. The E-commerce Customer Support Chatbot Market witnessed a rising adoption of AI-driven solutions for streamlined customer assistance in online retail. Integrated into e-commerce platforms, these chatbots offer instant, personalized support, addressing inquiries and facilitating smooth transactions. With features like advanced NLP and multichannel support, these chatbots enhance user experience and efficiently handle high query volumes. Representing a strategic investment for online retailers, the market focuses on improving customer satisfaction, increasing operational efficiency, and driving sales in the competitive e-commerce landscape.
Jammu and Kashmir (J&K) Make History with Launch of Tele-MANAS, India’s First Chatbot for Mental Distress Support.
Evo Introduces Customer Service Chatbot, ChatGPT, Developed by Open AI. Evo is set to unveil ChatGPT, a cutting-edge customer service chatbot developed by the renowned research organization Open AI.
By Type
By Application
By Region
*List not exhaustive
Customer Support Chatbot Market Outlook 2023
1 Market Overview
1.1 Introduction to the Customer Support Chatbot Market
1.2 Scope of the Study
1.3 Research Objective
1.3.1 Key Market Scope and Segments
1.3.2 Players Covered
1.3.3 Years Considered
2 Executive Summary
2.1 2023 Customer Support Chatbot Industry- Market Statistics
3 Market Dynamics
3.1 Market Drivers
3.2 Market Challenges
3.3 Market Opportunities
3.4 Market Trends
4 Market Factor Analysis
4.1 Porter’s Five Forces
4.2 Market Entropy
4.2.1 Global Customer Support Chatbot Market Companies with Area Served
4.2.2 Products Offerings Global Customer Support Chatbot Market
5 COVID-19 Impact Analysis and Outlook Scenarios
5.1.1 Covid-19 Impact Analysis
5.1.2 post-COVID-19 Scenario- Low Growth Case
5.1.3 post-COVID-19 Scenario- Reference Growth Case
5.1.4 post-COVID-19 Scenario- Low Growth Case
6 Global Customer Support Chatbot Market Trends
6.1 Global Customer Support Chatbot Revenue (USD Million) and CAGR (%) by Type (2018-2030)
6.2 Global Customer Support Chatbot Revenue (USD Million) and CAGR (%) by Applications (2018-2030)
6.3 Global Customer Support Chatbot Revenue (USD Million) and CAGR (%) by regions (2018-2030)
7 Global Customer Support Chatbot Market Revenue (USD Million) by Type, and Applications (2018-2022)
7.1 Global Customer Support Chatbot Revenue (USD Million) by Type (2018-2022)
7.1.1 Global Customer Support Chatbot Revenue (USD Million), Market Share (%) by Type (2018-2022)
7.2 Global Customer Support Chatbot Revenue (USD Million) by Applications (2018-2022)
7.2.1 Global Customer Support Chatbot Revenue (USD Million), Market Share (%) by Applications (2018-2022)
8 Global Customer Support Chatbot Development Regional Status and Outlook
8.1 Global Customer Support Chatbot Revenue (USD Million) By Regions (2018-2022)
8.2 North America Customer Support Chatbot Revenue (USD Million) by Type, and Application (2018-2022)
8.2.1 North America Customer Support Chatbot Revenue (USD Million) by Country (2018-2022)
8.2.2 North America Customer Support Chatbot Revenue (USD Million) by Type (2018-2022)
8.2.3 North America Customer Support Chatbot Revenue (USD Million) by Applications (2018-2022)
8.3 Europe Customer Support Chatbot Revenue (USD Million), by Type, and Applications (USD Million) (2018-2022)
8.3.1 Europe Customer Support Chatbot Revenue (USD Million), by Country (2018-2022)
8.3.2 Europe Customer Support Chatbot Revenue (USD Million) by Type (2018-2022)
8.3.3 Europe Customer Support Chatbot Revenue (USD Million) by Applications (2018-2022)
8.4 Asia Pacific Customer Support Chatbot Revenue (USD Million), and Revenue (USD Million) by Type, and Applications (2018-2022)
8.4.1 Asia Pacific Customer Support Chatbot Revenue (USD Million) by Country (2018-2022)
8.4.2 Asia Pacific Customer Support Chatbot Revenue (USD Million) by Type (2018-2022)
8.4.3 Asia Pacific Customer Support Chatbot Revenue (USD Million) by Applications (2018-2022)
8.5 South America Customer Support Chatbot Revenue (USD Million), by Type, and Applications (2018-2022)
8.5.1 South America Customer Support Chatbot Revenue (USD Million), by Country (2018-2022)
8.5.2 South America Customer Support Chatbot Revenue (USD Million) by Type (2018-2022)
8.5.3 South America Customer Support Chatbot Revenue (USD Million) by Applications (2018-2022)
8.6 Middle East and Africa Customer Support Chatbot Revenue (USD Million), by Type, Technology, Application, Thickness (2018-2022)
8.6.1 Middle East and Africa Customer Support Chatbot Revenue (USD Million) by Country (2018-2022)
8.6.2 Middle East and Africa Customer Support Chatbot Revenue (USD Million) by Type (2018-2022)
8.6.3 Middle East and Africa Customer Support Chatbot Revenue (USD Million) by Applications (2018-2022)
9 Company Profiles
10 Global Customer Support Chatbot Market Revenue (USD Million), by Type, and Applications (2023-2030)
10.1 Global Customer Support Chatbot Revenue (USD Million) and Market Share (%) by Type (2023-2030)
10.1.1 Global Customer Support Chatbot Revenue (USD Million), and Market Share (%) by Type (2023-2030)
10.2 Global Customer Support Chatbot Revenue (USD Million) and Market Share (%) by Applications (2023-2030)
10.2.1 Global Customer Support Chatbot Revenue (USD Million), and Market Share (%) by Applications (2023-2030)
11 Global Customer Support Chatbot Development Regional Status and Outlook Forecast
11.1 Global Customer Support Chatbot Revenue (USD Million) By Regions (2023-2030)
11.2 North America Customer Support Chatbot Revenue (USD Million) by Type, and Applications (2023-2030)
11.2.1 North America Customer Support Chatbot Revenue (USD) Million by Country (2023-2030)
11.2.2 North America Customer Support Chatbot Revenue (USD Million), by Type (2023-2030)
11.2.3 North America Customer Support Chatbot Revenue (USD Million), Market Share (%) by Applications (2023-2030)
11.3 Europe Customer Support Chatbot Revenue (USD Million), by Type, and Applications (2023-2030)
11.3.1 Europe Customer Support Chatbot Revenue (USD Million), by Country (2023-2030)
11.3.2 Europe Customer Support Chatbot Revenue (USD Million), by Type (2023-2030)
11.3.3 Europe Customer Support Chatbot Revenue (USD Million), by Applications (2023-2030)
11.4 Asia Pacific Customer Support Chatbot Revenue (USD Million) by Type, and Applications (2023-2030)
11.4.1 Asia Pacific Customer Support Chatbot Revenue (USD Million), by Country (2023-2030)
11.4.2 Asia Pacific Customer Support Chatbot Revenue (USD Million), by Type (2023-2030)
11.4.3 Asia Pacific Customer Support Chatbot Revenue (USD Million), by Applications (2023-2030)
11.5 South America Customer Support Chatbot Revenue (USD Million), by Type, and Applications (2023-2030)
11.5.1 South America Customer Support Chatbot Revenue (USD Million), by Country (2023-2030)
11.5.2 South America Customer Support Chatbot Revenue (USD Million), by Type (2023-2030)
11.5.3 South America Customer Support Chatbot Revenue (USD Million), by Applications (2023-2030)
11.6 Middle East and Africa Customer Support Chatbot Revenue (USD Million), by Type, and Applications (2023-2030)
11.6.1 Middle East and Africa Customer Support Chatbot Revenue (USD Million), by region (2023-2030)
11.6.2 Middle East and Africa Customer Support Chatbot Revenue (USD Million), by Type (2023-2030)
11.6.3 Middle East and Africa Customer Support Chatbot Revenue (USD Million), by Applications (2023-2030)
12 Methodology and Data Sources
12.1 Methodology/Research Approach
12.1.1 Research Programs/Design
12.1.2 Market Size Estimation
12.1.3 Market Breakdown and Data Triangulation
12.2 Data Sources
12.2.1 Secondary Sources
12.2.2 Primary Sources
12.3 Disclaimer
List of Tables
Table 1 Market Segmentation Analysis
Table 2 Global Customer Support Chatbot Market Companies with Areas Served
Table 3 Products Offerings Global Customer Support Chatbot Market
Table 4 Low Growth Scenario Forecasts
Table 5 Reference Case Growth Scenario
Table 6 High Growth Case Scenario
Table 7 Global Customer Support Chatbot Revenue (USD Million) And CAGR (%) By Type (2018-2030)
Table 8 Global Customer Support Chatbot Revenue (USD Million) And CAGR (%) By Applications (2018-2030)
Table 9 Global Customer Support Chatbot Revenue (USD Million) And CAGR (%) By Regions (2018-2030)
Table 10 Global Customer Support Chatbot Revenue (USD Million) By Type (2018-2022)
Table 11 Global Customer Support Chatbot Revenue Market Share (%) By Type (2018-2022)
Table 12 Global Customer Support Chatbot Revenue (USD Million) By Applications (2018-2022)
Table 13 Global Customer Support Chatbot Revenue Market Share (%) By Applications (2018-2022)
Table 14 Global Customer Support Chatbot Market Revenue (USD Million) By Regions (2018-2022)
Table 15 Global Customer Support Chatbot Market Share (%) By Regions (2018-2022)
Table 16 North America Customer Support Chatbot Revenue (USD Million) By Country (2018-2022)
Table 17 North America Customer Support Chatbot Revenue (USD Million) By Type (2018-2022)
Table 18 North America Customer Support Chatbot Revenue (USD Million) By Applications (2018-2022)
Table 19 Europe Customer Support Chatbot Revenue (USD Million) By Country (2018-2022)
Table 20 Europe Customer Support Chatbot Revenue (USD Million) By Type (2018-2022)
Table 21 Europe Customer Support Chatbot Revenue (USD Million) By Applications (2018-2022)
Table 22 Asia Pacific Customer Support Chatbot Revenue (USD Million) By Country (2018-2022)
Table 23 Asia Pacific Customer Support Chatbot Revenue (USD Million) By Type (2018-2022)
Table 24 Asia Pacific Customer Support Chatbot Revenue (USD Million) By Applications (2018-2022)
Table 25 South America Customer Support Chatbot Revenue (USD Million) By Country (2018-2022)
Table 26 South America Customer Support Chatbot Revenue (USD Million) By Type (2018-2022)
Table 27 South America Customer Support Chatbot Revenue (USD Million) By Applications (2018-2022)
Table 28 Middle East and Africa Customer Support Chatbot Revenue (USD Million) By Region (2018-2022)
Table 29 Middle East and Africa Customer Support Chatbot Revenue (USD Million) By Type (2018-2022)
Table 30 Middle East and Africa Customer Support Chatbot Revenue (USD Million) By Applications (2018-2022)
Table 31 Financial Analysis
Table 32 Global Customer Support Chatbot Revenue (USD Million) By Type (2023-2030)
Table 33 Global Customer Support Chatbot Revenue Market Share (%) By Type (2023-2030)
Table 34 Global Customer Support Chatbot Revenue (USD Million) By Applications (2023-2030)
Table 35 Global Customer Support Chatbot Revenue Market Share (%) By Applications (2023-2030)
Table 36 Global Customer Support Chatbot Market Revenue (USD Million), And Revenue (USD Million) By Regions (2023-2030)
Table 37 North America Customer Support Chatbot Revenue (USD)By Country (2023-2030)
Table 38 North America Customer Support Chatbot Revenue (USD Million) By Type (2023-2030)
Table 39 North America Customer Support Chatbot Revenue (USD Million) By Applications (2023-2030)
Table 40 Europe Customer Support Chatbot Revenue (USD Million) By Country (2023-2030)
Table 41 Europe Customer Support Chatbot Revenue (USD Million) By Type (2023-2030)
Table 42 Europe Customer Support Chatbot Revenue (USD Million) By Applications (2023-2030)
Table 43 Asia Pacific Customer Support Chatbot Revenue (USD Million) By Country (2023-2030)
Table 44 Asia Pacific Customer Support Chatbot Revenue (USD Million) By Type (2023-2030)
Table 45 Asia Pacific Customer Support Chatbot Revenue (USD Million) By Applications (2023-2030)
Table 46 South America Customer Support Chatbot Revenue (USD Million) By Country (2023-2030)
Table 47 South America Customer Support Chatbot Revenue (USD Million) By Type (2023-2030)
Table 48 South America Customer Support Chatbot Revenue (USD Million) By Applications (2023-2030)
Table 49 Middle East and Africa Customer Support Chatbot Revenue (USD Million) By Region (2023-2030)
Table 50 Middle East and Africa Customer Support Chatbot Revenue (USD Million) By Region (2023-2030)
Table 51 Middle East and Africa Customer Support Chatbot Revenue (USD Million) By Type (2023-2030)
Table 52 Middle East and Africa Customer Support Chatbot Revenue (USD Million) By Applications (2023-2030)
Table 53 Research Programs/Design for This Report
Table 54 Key Data Information from Secondary Sources
Table 55 Key Data Information from Primary Sources
List of Figures
Figure 1 Market Scope
Figure 2 Porter’s Five Forces
Figure 3 Global Customer Support Chatbot Revenue (USD Million) By Type (2018-2022)
Figure 4 Global Customer Support Chatbot Revenue Market Share (%) By Type (2022)
Figure 5 Global Customer Support Chatbot Revenue (USD Million) By Applications (2018-2022)
Figure 6 Global Customer Support Chatbot Revenue Market Share (%) By Applications (2022)
Figure 7 Global Customer Support Chatbot Market Revenue (USD Million) By Regions (2018-2022)
Figure 8 Global Customer Support Chatbot Market Share (%) By Regions (2022)
Figure 9 North America Customer Support Chatbot Revenue (USD Million) By Country (2018-2022)
Figure 10 North America Customer Support Chatbot Revenue (USD Million) By Type (2018-2022)
Figure 11 North America Customer Support Chatbot Revenue (USD Million) By Applications (2018-2022)
Figure 12 Europe Customer Support Chatbot Revenue (USD Million) By Country (2018-2022)
Figure 13 Europe Customer Support Chatbot Revenue (USD Million) By Type (2018-2022)
Figure 14 Europe Customer Support Chatbot Revenue (USD Million) By Applications (2018-2022)
Figure 15 Asia Pacific Customer Support Chatbot Revenue (USD Million) By Country (2018-2022)
Figure 16 Asia Pacific Customer Support Chatbot Revenue (USD Million) By Type (2018-2022)
Figure 17 Asia Pacific Customer Support Chatbot Revenue (USD Million) By Applications (2018-2022)
Figure 18 South America Customer Support Chatbot Revenue (USD Million) By Country (2018-2022)
Figure 19 South America Customer Support Chatbot Revenue (USD Million) By Type (2018-2022)
Figure 20 South America Customer Support Chatbot Revenue (USD Million) By Applications (2018-2022)
Figure 21 Middle East and Africa Customer Support Chatbot Revenue (USD Million) By Region (2018-2022)
Figure 22 Middle East and Africa Customer Support Chatbot Revenue (USD Million) By Type (2018-2022)
Figure 23 Middle East and Africa Customer Support Chatbot Revenue (USD Million) By Applications (2018-2022)
Figure 24 Global Customer Support Chatbot Revenue (USD Million) By Type (2023-2030)
Figure 25 Global Customer Support Chatbot Revenue Market Share (%) By Type (2030)
Figure 26 Global Customer Support Chatbot Revenue (USD Million) By Applications (2023-2030)
Figure 27 Global Customer Support Chatbot Revenue Market Share (%) By Applications (2030)
Figure 28 Global Customer Support Chatbot Market Revenue (USD Million) By Regions (2023-2030)
Figure 29 North America Customer Support Chatbot Revenue (USD Million) By Country (2023-2030)
Figure 30 North America Customer Support Chatbot Revenue (USD Million) By Type (2023-2030)
Figure 31 North America Customer Support Chatbot Revenue (USD Million) By Applications (2023-2030)
Figure 32 Europe Customer Support Chatbot Revenue (USD Million) By Country (2023-2030)
Figure 33 Europe Customer Support Chatbot Revenue (USD Million) By Type (2023-2030)
Figure 34 Europe Customer Support Chatbot Revenue (USD Million) By Applications (2023-2030)
Figure 35 Asia Pacific Customer Support Chatbot Revenue (USD Million) By Country (2023-2030)
Figure 36 Asia Pacific Customer Support Chatbot Revenue (USD Million) By Type (2023-2030)
Figure 37 Asia Pacific Customer Support Chatbot Revenue (USD Million) By Applications (2023-2030)
Figure 38 South America Customer Support Chatbot Revenue (USD Million) By Country (2023-2030)
Figure 39 South America Customer Support Chatbot Revenue (USD Million) By Type (2023-2030)
Figure 40 South America Customer Support Chatbot Revenue (USD Million) By Applications (2023-2030)
Figure 41 Middle East and Africa Customer Support Chatbot Revenue (USD Million) By Region (2023-2030)
Figure 42 Middle East and Africa Customer Support Chatbot Revenue (USD Million) By Region (2023-2030)
Figure 43 Middle East and Africa Customer Support Chatbot Revenue (USD Million) By Type (2023-2030)
Figure 44 Middle East and Africa Customer Support Chatbot Revenue (USD Million) By Applications (2023-2030)
Figure 45 Bottom-Up and Top-Down Approaches for This Report
Figure 46 Data Triangulation
By Type
By Application
By Region