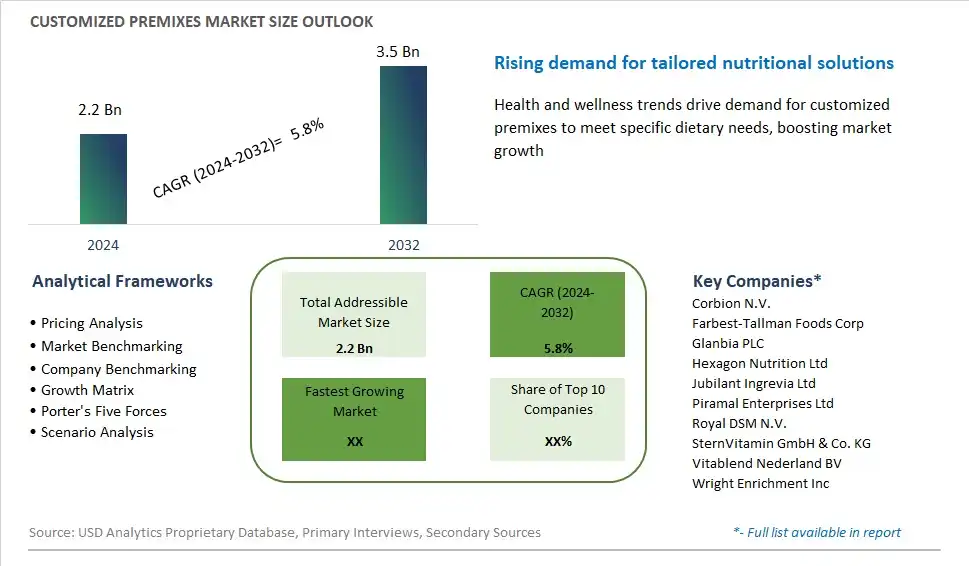
Global Customized Premixes Market Size is valued at $2.2 Billion in 2024 and is forecast to register a growth rate (CAGR) of 5.8% to reach $3.5 Billion by 2032.
The global Customized Premixes Market Comprehensive Study analyzes and forecasts the market size across 6 regions and 24 countries for diverse segments -By Type (Vitamins, Minerals, Amino Acids, Nucleotides, Antibiotics, Fibers, Others), By Application (Beverages, Dairy Products, Bakery & Confectioneries, Nutraceuticals, Dietary Supplements, Infant Nutrition, Clinical Nutrition, Sports Nutrition, Pet Food, Others), By Form (Dry, Liquid), By Function (Bone Health, Skin Health, Energy, Immunity, Digestion, Others)
An Introduction to Customized Premixes Market
Customized premixes are specialized blends of vitamins, minerals, amino acids, and other nutritional ingredients tailored to meet the specific requirements and objectives of food, beverage, and supplement manufacturers in 2024. These premixes serve as essential components in fortifying and enriching products with essential nutrients, functional additives, and flavor enhancements, enabling manufacturers to address consumer demand for healthier and more convenient food and beverage options. With a focus on precision, consistency, and customization, customized premix suppliers work closely with manufacturers to develop formulations that align with dietary guidelines, regulatory requirements, and market trends. Whether fortifying breakfast cereals with vitamins and minerals, enhancing sports drinks with electrolytes and amino acids, or enriching infant formulas with essential fatty acids and probiotics, customized premixes play a vital role in delivering targeted nutrition and functional benefits to consumers. As consumer awareness of health and wellness grows, the market for customized premixes is expected to expand, driven by demand for innovative solutions that address specific nutritional needs and preferences across diverse demographics and lifestyles.
Customized Premixes Competitive Landscape
The market report analyses the leading companies in the industry including Corbion N.V., Farbest-Tallman Foods Corp, Glanbia PLC, Hexagon Nutrition Ltd, Jubilant Ingrevia Ltd, Piramal Enterprises Ltd, Royal DSM N.V., SternVitamin GmbH & Co. KG, Vitablend Nederland BV, Wright Enrichment Inc, and Others.
Customized Premixes Market Dynamics
Customized Premixes Market Trend: Personalized Nutrition and Tailored Solutions
One prominent trend in the customized premixes market is the growing demand for personalized nutrition and tailored solutions. Consumers are increasingly seeking products that address their individual health needs, preferences, and dietary requirements. This trend is driven by factors such as rising health consciousness, the desire for proactive health management, and advancements in nutritional science. As a result, there's a shift away from one-size-fits-all approaches towards customized premixes that offer targeted solutions for specific health goals, such as weight management, sports performance, digestive health, and immune support. Manufacturers are responding by offering a wide range of customized premix options, allowing consumers to choose ingredients, dosages, and formats that align with their unique needs and preferences. Additionally, there's growing interest in personalized nutrition services, such as DNA testing and nutritional counseling, that provide personalized recommendations for supplement regimens based on individual genetic profiles and lifestyle factors. This trend presents opportunities for premix manufacturers to innovate and develop customized solutions that cater to the evolving needs and preferences of health-conscious consumers.
Market Driver: Consumer Demand for Convenience and Simplicity
A key driver propelling the growth of the customized premixes market is consumer demand for convenience and simplicity in meeting their nutritional needs. With busy lifestyles and hectic schedules, consumers are seeking easy-to-use solutions that simplify their daily routines and support their health goals. This driver is fueled by factors such as time constraints, the desire for on-the-go nutrition, and the need for hassle-free supplementation. Customized premixes offer a convenient and efficient way for consumers to access essential vitamins, minerals, and other nutrients in a single, pre-measured dose. Whether in the form of single-serve packets, ready-to-drink beverages, or powder blends, customized premixes provide a convenient alternative to traditional supplementation methods, such as pill bottles and multiple supplements. Additionally, the rise of e-commerce and direct-to-consumer channels has made it easier for consumers to access customized premixes online, further driving market growth. By offering convenient and user-friendly solutions that meet the needs of busy consumers, premix manufacturers can capitalize on this driver and expand their market reach.
Market Opportunity: Expansion into Functional and Specialty Ingredients
An opportunity within the customized premixes market lies in the expansion into functional and specialty ingredients to offer enhanced health benefits and differentiated product offerings. With increasing consumer interest in holistic health and wellness, there's growing demand for customized premixes that contain functional ingredients with specific health-promoting properties. This presents an opportunity for premix manufacturers to collaborate with ingredient suppliers and incorporate a diverse range of functional ingredients, such as botanical extracts, superfoods, adaptogens, and probiotics, into their formulations. By leveraging the unique health benefits of these specialty ingredients, manufacturers can create customized premixes that target niche health concerns, such as stress management, cognitive function, and beauty from within. Additionally, there's potential to innovate with novel delivery formats, such as gummies, chewables, and liquid shots, to enhance the consumer experience and differentiate products in the market. By embracing functional and specialty ingredients in customized premix formulations, manufacturers can meet the evolving needs and preferences of health-conscious consumers and drive market growth in this segment.
Customized Premixes Market Share Analysis: Vitamins held the dominant market share in 2024
In the Customized Premixes Market segmented by type, the vitamins segment is the largest, propelled by several pivotal factors. Vitamins are essential micronutrients required for various physiological functions in the human body, making them a crucial component of customized premix formulations. The widespread recognition of the importance of vitamins in supporting overall health and wellness drives their demand across diverse consumer demographics. Additionally, the fortification of food and beverage products with vitamins has become a prevalent practice among manufacturers aiming to address nutritional deficiencies and meet consumer demands for functional and fortified products. Further, the versatility of vitamins allows for their incorporation into a wide range of applications, including dietary supplements, functional foods, beverages, and animal feed, further driving their dominance in the customized premixes market. Furthermore, advancements in vitamin formulation technologies and increased consumer awareness of preventive healthcare contribute to the sustained growth of this segment. As a result, the vitamins segment stands as the largest in the Customized Premixes Market, poised for continued expansion as manufacturers continue to innovate and develop customized premix solutions tailored to meet evolving consumer needs and preferences.
Customized Premixes Market Share Analysis: Nutraceuticals market is poised to register the fastest growth rae over the forecast period to 2032
In the Customized Premixes Market segmented by application, the nutraceuticals segment is the fastest-growing, propelled by several transformative factors. Nutraceuticals, which encompass functional foods and dietary supplements with purported health benefits beyond basic nutrition, have witnessed a surge in demand due to increasing consumer awareness and interest in holistic wellness. Customized premixes play a vital role in the formulation of nutraceutical products, as they enable manufacturers to incorporate precise combinations of vitamins, minerals, amino acids, and other bioactive compounds tailored to address specific health concerns or support targeted wellness goals. Further, the growing aging population, rising prevalence of chronic health conditions, and heightened focus on preventive healthcare have spurred demand for nutraceuticals as a convenient and accessible means of maintaining health and vitality. Additionally, advancements in formulation technologies and regulatory support for health claims associated with nutraceutical ingredients have further fueled market growth. Furthermore, the expanding range of nutraceutical product offerings, including functional beverages, fortified dairy products, and wellness bars, underscores the versatility and potential of customized premixes in meeting the diverse needs of consumers seeking proactive approaches to health and wellness. As a result, the nutraceuticals segment stands as the fastest-growing in the Customized Premixes Market, poised for continued expansion as the demand for functional and health-enhancing products continues to rise globally.
Customized Premixes Market Share Analysis: Dry held the dominant market share in 2024
In the Customized Premixes Market segmented by form, the dry segment is the largest, driven by several pivotal factors. Dry customized premixes offer several advantages, including longer shelf life, ease of handling, and convenience in storage and transportation. These attributes make dry premixes highly suitable for a wide range of applications across various industries, including food and beverage, dietary supplements, and animal nutrition. Further, dry premixes are versatile and can be easily incorporated into dry mixes, such as powders, blends, and granules, as well as into other solid formulations, including tablets and capsules. Additionally, advancements in dry blending technologies have enabled manufacturers to achieve precise and uniform dispersion of ingredients, ensuring consistent product quality and efficacy. Furthermore, the cost-effectiveness of dry premix formulations, coupled with their stability and compatibility with manufacturing processes, further contributes to their dominance in the market. As a result, the dry segment stands as the largest in the Customized Premixes Market, poised for sustained growth as manufacturers continue to innovate and expand their offerings to meet the evolving needs of diverse industries.
Customized Premixes Market Segmentation
By Type
Vitamins
Minerals
Amino Acids
Nucleotides
Antibiotics
Fibers
Others
By Application
Beverages
Dairy Products
Bakery & Confectioneries
Nutraceuticals
Dietary Supplements
Infant Nutrition
Clinical Nutrition
Sports Nutrition
Pet Food
Others
By Form
Dry
Liquid
By Function
Bone Health
Skin Health
Energy
Immunity
Digestion
Others
Countries Analyzed
North America (US, Canada, Mexico)
Europe (Germany, UK, France, Spain, Italy, Russia, Rest of Europe)
Asia Pacific (China, India, Japan, South Korea, Australia, South East Asia, Rest of Asia)
South America (Brazil, Argentina, Rest of South America)
Middle East and Africa (Saudi Arabia, UAE, Rest of Middle East, South Africa, Egypt, Rest of Africa)
Customized Premixes Companies Profiled in the Study
Corbion N.V.
Farbest-Tallman Foods Corp
Glanbia PLC
Hexagon Nutrition Ltd
Jubilant Ingrevia Ltd
Piramal Enterprises Ltd
Royal DSM N.V.
SternVitamin GmbH & Co. KG
Vitablend Nederland BV
Wright Enrichment Inc
*- List Not Exhaustive
Chapter 1. TABLE OF CONTENTS
Chapter 2. Introduction to Customized Premixes Market
2.1. Market Overview
2.2. Key Statistics and Report Highlights
2.3. Scope of the Comprehensive Study
2.3.1. Market Definition
2.3.2 Countries and Regions Covered
2.3.3 Research Objective
2.3.4 Units, Currency, and Conversions
2.3.5 Industry Value Chain
2.4. Key Market Segments
2.5. Key Companies
2.6. Study Period
Chapter 3. Strategic Analysis Review
3.1. Customized Premixes Pricing Analysis and Forecast
3.2. Porter’s Five Forces
3.3. Market Ecosystem
3.4. SWOT Analysis
3.5. Regulatory Scenario
3.3. Effects of Inflation, Russia-Ukraine War, moderating economic growth, and other macroeconomic factors
Chapter 4. Competitive Landscape
4.1. Market Share Analysis
4.1.1. Global Customized Premixes Market Share by Company, 2023
4.1.2. Product Offerings of Leading Customized Premixes Companies
4.2. Market Entropy
4.2.1. New Product Launches in the Industry
4.2.2. Mergers, Acquisitions, Joint ventures, and Partnerships
4.3. Key Strategies and Best Practices
Chapter 5. Global Market Projections: Best, Reference, and Low Case Scenarios
5.1. Growth Analysis- Case Scenario Definitions
5.2. Low Growth Case Scenario Forecasts
5.3. Reference Growth Case Scenario Forecasts
5.4. High Growth Case Scenario Forecasts
Chapter 6. Market Dynamics
6.1. Customized Premixes Market Drivers
6.2. Customized Premixes Market Challenges
6.6. Customized Premixes Market Opportunities
6.4. Customized Premixes Market Trends
Chapter 7. Global Customized Premixes Market Outlook Trends
7.1. Global Customized Premixes Revenue (USD Million) and CAGR (%) by Type (2021-2032)
7.2. Global Customized Premixes Revenue (USD Million) and CAGR (%) by Application (2021-2032)
7.3. Global Customized Premixes Revenue (USD Million) and CAGR (%) by Product (2021-2032)
By Type
Vitamins
Minerals
Amino Acids
Nucleotides
Antibiotics
Fibers
Others
By Application
Beverages
Dairy Products
Bakery & Confectioneries
Nutraceuticals
Dietary Supplements
Infant Nutrition
Clinical Nutrition
Sports Nutrition
Pet Food
Others
By Form
Dry
Liquid
By Function
Bone Health
Skin Health
Energy
Immunity
Digestion
Others
Chapter 8. Global Customized Premixes Regional Analysis and Outlook
8.1. Global Customized Premixes Revenue (USD Million) By Regions (2021- 2032)
8.2. North America Customized Premixes Revenue (USD Million) by Country (2021-2032)
8.2.1. United States Customized Premixes Regional Analysis and Outlook
8.2.2. Canada Customized Premixes Regional Analysis and Outlook
8.2.3. Mexico Customized Premixes Regional Analysis and Outlook
8.3. Europe Customized Premixes Revenue (USD Million), by Country (2021-2032)
8.3.1. Germany Customized Premixes Regional Analysis and Outlook
8.3.2. France Customized Premixes Regional Analysis and Outlook
8.3.3. United Kingdom Customized Premixes Regional Analysis and Outlook
8.3.4. Spain Customized Premixes Regional Analysis and Outlook
8.3.5. Italy Customized Premixes Regional Analysis and Outlook
8.3.6. Russia Customized Premixes Regional Analysis and Outlook
8.3.7. Rest of Europe Customized Premixes Regional Analysis and Outlook
8.4. Asia Pacific Customized Premixes Revenue (USD Million) by Country (2021-2032)
8.4.1. China Customized Premixes Regional Analysis and Outlook
8.4.2. Japan Customized Premixes Regional Analysis and Outlook
8.4.3. India Customized Premixes Regional Analysis and Outlook
8.4.4. South Korea Customized Premixes Regional Analysis and Outlook
8.4.5. Australia Customized Premixes Regional Analysis and Outlook
8.4.6. South East Asia Customized Premixes Regional Analysis and Outlook
8.4.7. Rest of Asia Pacific Customized Premixes Regional Analysis and Outlook
8.5. South America Customized Premixes Revenue (USD Million), by Country (2021-2032)
8.5.1. Brazil Customized Premixes Regional Analysis and Outlook
8.5.2. Argentina Customized Premixes Regional Analysis and Outlook
8.5.3. Rest of South America Customized Premixes Regional Analysis and Outlook
8.6. Middle East and Africa Customized Premixes Revenue (USD Million) by Country (2021-2032)
8.6.1. Middle East Customized Premixes Regional Analysis and Outlook
8.6.2. Africa Customized Premixes Regional Analysis and Outlook
Chapter 9. North America Customized Premixes Analysis and Outlook
9.1. North America Customized Premixes Revenue (USD Million) by Segments (2021-2032)
9.1.1. North America Customized Premixes Revenue (USD Million) by Type (2021-2032)
9.1.2. North America Customized Premixes Revenue (USD Million) by Application (2021-2032)
9.1.3. North America Customized Premixes Revenue (USD Million) by Product (2021-2032)
By Type
Vitamins
Minerals
Amino Acids
Nucleotides
Antibiotics
Fibers
Others
By Application
Beverages
Dairy Products
Bakery & Confectioneries
Nutraceuticals
Dietary Supplements
Infant Nutrition
Clinical Nutrition
Sports Nutrition
Pet Food
Others
By Form
Dry
Liquid
By Function
Bone Health
Skin Health
Energy
Immunity
Digestion
Others
Chapter 10. Europe Customized Premixes Analysis and Outlook
10.1. Europe Customized Premixes Revenue (USD Million), by Segments (USD Million) (2021-2032)
10.1.1. Europe Customized Premixes Revenue (USD Million) by Type (2021-2032)
10.1.2. Europe Customized Premixes Revenue (USD Million) by Application (2021-2032)
10.1.3. Europe Customized Premixes Revenue (USD Million) by Product (2021-2032)
By Type
Vitamins
Minerals
Amino Acids
Nucleotides
Antibiotics
Fibers
Others
By Application
Beverages
Dairy Products
Bakery & Confectioneries
Nutraceuticals
Dietary Supplements
Infant Nutrition
Clinical Nutrition
Sports Nutrition
Pet Food
Others
By Form
Dry
Liquid
By Function
Bone Health
Skin Health
Energy
Immunity
Digestion
Others
Chapter 11. Asia Pacific Customized Premixes Analysis and Outlook
11.1. Asia Pacific Customized Premixes Revenue (USD Million), and Revenue (USD Million) by Segments (2021-2032)
11.1.1. Asia Pacific Customized Premixes Revenue (USD Million) by Type (2021-2032)
11.1.2. Asia Pacific Customized Premixes Revenue (USD Million) by Application (2021-2032)
11.1.3. Asia Pacific Customized Premixes Revenue (USD Million) by Product (2021-2032)
By Type
Vitamins
Minerals
Amino Acids
Nucleotides
Antibiotics
Fibers
Others
By Application
Beverages
Dairy Products
Bakery & Confectioneries
Nutraceuticals
Dietary Supplements
Infant Nutrition
Clinical Nutrition
Sports Nutrition
Pet Food
Others
By Form
Dry
Liquid
By Function
Bone Health
Skin Health
Energy
Immunity
Digestion
Others
Chapter 12. South America Customized Premixes Analysis and Outlook
12.1. South America Customized Premixes Revenue (USD Million), by Segments (2021-2032)
12.1.1. South America Customized Premixes Revenue (USD Million) by Type (2021-2032)
12.1.2. South America Customized Premixes Revenue (USD Million) by Application (2021-2032)
12.1.3. South America Customized Premixes Revenue (USD Million) by Product (2021-2032)
By Type
Vitamins
Minerals
Amino Acids
Nucleotides
Antibiotics
Fibers
Others
By Application
Beverages
Dairy Products
Bakery & Confectioneries
Nutraceuticals
Dietary Supplements
Infant Nutrition
Clinical Nutrition
Sports Nutrition
Pet Food
Others
By Form
Dry
Liquid
By Function
Bone Health
Skin Health
Energy
Immunity
Digestion
Others
Chapter 13. Middle East and Africa Customized Premixes Analysis and Outlook
13.1. Middle East and Africa Customized Premixes Revenue (USD Million), by Segments (2021-2032)
13.1.1. Middle East and Africa Customized Premixes Revenue (USD Million) by Type (2021-2032)
13.1.2. Middle East and Africa Customized Premixes Revenue (USD Million) by Application (2021-2032)
13.1.3. Middle East and Africa Customized Premixes Revenue (USD Million) by Product (2021-2032)
By Type
Vitamins
Minerals
Amino Acids
Nucleotides
Antibiotics
Fibers
Others
By Application
Beverages
Dairy Products
Bakery & Confectioneries
Nutraceuticals
Dietary Supplements
Infant Nutrition
Clinical Nutrition
Sports Nutrition
Pet Food
Others
By Form
Dry
Liquid
By Function
Bone Health
Skin Health
Energy
Immunity
Digestion
Others
Chapter 14. Customized Premixes Company Profiles
14.1 Business Overview
14.2 Product Profiles
14.3 SWOT Profiles
14.5 Recent Developments
14.6 Financial Profile
List of Companies
Corbion N.V.
Farbest-Tallman Foods Corp
Glanbia PLC
Hexagon Nutrition Ltd
Jubilant Ingrevia Ltd
Piramal Enterprises Ltd
Royal DSM N.V.
SternVitamin GmbH & Co. KG
Vitablend Nederland BV
Wright Enrichment Inc
15. Methodology and Data Sources
15.1 Customization Offerings
15.2 Subscription Services
15.3 Related Reports
15.4 Publisher Expertise
LIST OF TABLES
Table 1 Market Segmentation Analysis
Table 2 Global Customized Premixes Market Share of Leading Companies, 2023
Table 3 Product Offerings of Leading Companies
Table 4 Low Growth Scenario Forecasts
Table 5 Reference Case Growth Scenario
Table 6 High Growth Case Scenario
Table 7 Global Customized Premixes Revenue (USD Million) And CAGR (%) By Type (2021-2032)
Table 8 Global Customized Premixes Revenue (USD Million) And CAGR (%) By Application (2021-2032)
Table 9 Global Customized Premixes Revenue (USD Million) And CAGR (%) By Product (2021-2032)
Table 10 Global Customized Premixes Market Revenue (USD Million) By Regions (2021-2032)
Table 11 Global Customized Premixes Market Share (%) By Regions (2021-2032)
Table 12 North America Customized Premixes Revenue (USD Million) By Country (2021-2032)
Table 13 Europe Customized Premixes Revenue (USD Million) By Country (2021-2032)
Table 14 Asia Pacific Customized Premixes Revenue (USD Million) By Country (2021-2032)
Table 15 South America Customized Premixes Revenue (USD Million) By Country (2021-2032)
Table 16 Middle East and Africa Customized Premixes Revenue (USD Million) By Region (2021-2032)
Table 17 North America Customized Premixes Revenue (USD Million) By Type (2021-2032)
Table 18 North America Customized Premixes Revenue (USD Million) By Application (2021-2032)
Table 19 North America Customized Premixes Revenue (USD Million) By Product (2021-2032)
Table 20 Europe Customized Premixes Revenue (USD Million) By Type (2021-2032)
Table 21 Europe Customized Premixes Revenue (USD Million) By Application (2021-2032)
Table 22 Europe Customized Premixes Revenue (USD Million) By Product (2021-2032)
Table 23 Asia Pacific Customized Premixes Revenue (USD Million) By Type (2021-2032)
Table 24 Asia Pacific Customized Premixes Revenue (USD Million) By Application (2021-2032)
Table 25 Asia Pacific Customized Premixes Revenue (USD Million) By Product (2021-2032)
Table 26 South America Customized Premixes Revenue (USD Million) By Type (2021-2032)
Table 27 South America Customized Premixes Revenue (USD Million) By Application (2021-2032)
Table 28 South America Customized Premixes Revenue (USD Million) By Product (2021-2032)
Table 29 Middle East and Africa Customized Premixes Revenue (USD Million) By Type (2021-2032)
Table 30 Middle East and Africa Customized Premixes Revenue (USD Million) By Application (2021-2032)
Table 31 Middle East and Africa Customized Premixes Revenue (USD Million) By Product (2021-2032)
LIST OF FIGURES
Figure 1. Market Scope
Figure 2. Pricing Forecasts Per Unit, 2023- 2032
Figure 3. Porter’s Five Forces
Figure 4. Global Customized Premixes Market Revenue (USD Million) By Regions (2021-2032)
Figure 5. Global Customized Premixes Market Share (%) By Regions (2023)
Figure 6. North America Customized Premixes Revenue (USD Million) By Country (2021-2032)
Figure 7. United States Customized Premixes Revenue (USD Million) By Country (2021-2032)
Figure 8. Canada Customized Premixes Revenue (USD Million) By Country (2021-2032)
Figure 9. Mexico Customized Premixes Revenue (USD Million) By Country (2021-2032)
Figure 10. Europe Customized Premixes Revenue (USD Million) By Country (2021-2032)
Figure 11. Germany Customized Premixes Revenue (USD Million) By Country (2021-2032)
Figure 12. France Customized Premixes Revenue (USD Million) By Country (2021-2032)
Figure 13. United Kingdom Customized Premixes Revenue (USD Million) By Country (2021-2032)
Figure 14. Spain Customized Premixes Revenue (USD Million) By Country (2021-2032)
Figure 15. Italy Customized Premixes Revenue (USD Million) By Country (2021-2032)
Figure 16. Russia Customized Premixes Revenue (USD Million) By Country (2021-2032)
Figure 17. Rest of Europe Customized Premixes Revenue (USD Million) By Country (2021-2032)
Figure 11. Asia Pacific Customized Premixes Revenue (USD Million) By Country (2021-2032)
Figure 12. China Customized Premixes Revenue (USD Million) By Country (2021-2032)
Figure 13. Japan Customized Premixes Revenue (USD Million) By Country (2021-2032)
Figure 14. India Customized Premixes Revenue (USD Million) By Country (2021-2032)
Figure 15. South Korea Customized Premixes Revenue (USD Million) By Country (2021-2032)
Figure 16. Australia Customized Premixes Revenue (USD Million) By Country (2021-2032)
Figure 17. South East Asia Customized Premixes Revenue (USD Million) By Country (2021-2032)
Figure 18. South America Customized Premixes Revenue (USD Million) By Country (2021-2032)
Figure 19. Brazil Customized Premixes Revenue (USD Million) By Country (2021-2032)
Figure 20. Argentina Customized Premixes Revenue (USD Million) By Country (2021-2032)
Figure 21. Rest of Asia Pacific Customized Premixes Revenue (USD Million) By Country (2021-2032)
Figure 22. Middle East and Africa Customized Premixes Revenue (USD Million) By Region (2021-2032)
Figure 23. Saudi Arabia Customized Premixes Revenue (USD Million) By Region (2021-2032)
Figure 24. The UAE Customized Premixes Revenue (USD Million) By Region (2021-2032)
Figure 25. Rest of Middle East Customized Premixes Revenue (USD Million) By Region (2021-2032)
Figure 26. South Africa Customized Premixes Revenue (USD Million) By Region (2021-2032)
Figure 27. Africa Customized Premixes Revenue (USD Million) By Region (2021-2032)
Figure 28. North America Customized Premixes Revenue (USD Million) By Type (2021-2032)
Figure 29. North America Customized Premixes Revenue (USD Million) By Application (2021-2032)
Figure 30. North America Customized Premixes Revenue (USD Million) By Product (2021-2032)
Figure 31. Europe Customized Premixes Revenue (USD Million) By Type (2021-2032)
Figure 32. Europe Customized Premixes Revenue (USD Million) By Application (2021-2032)
Figure 33. Europe Customized Premixes Revenue (USD Million) By Product (2021-2032)
Figure 34. Asia Pacific Customized Premixes Revenue (USD Million) By Type (2021-2032)
Figure 35. Asia Pacific Customized Premixes Revenue (USD Million) By Application (2021-2032)
Figure 36. Asia Pacific Customized Premixes Revenue (USD Million) By Product (2021-2032)
Figure 37. South America Customized Premixes Revenue (USD Million) By Type (2021-2032)
Figure 38. South America Customized Premixes Revenue (USD Million) By Application (2021-2032)
Figure 39. South America Customized Premixes Revenue (USD Million) By Product (2021-2032)
Figure 40. Middle East and Africa Customized Premixes Revenue (USD Million) By Type (2021-2032)
Figure 41. Middle East and Africa Customized Premixes Revenue (USD Million) By Application (2021-2032)
Figure 42. Middle East and Africa Customized Premixes Revenue (USD Million) By Product (2021-2032)
By Type
Vitamins
Minerals
Amino Acids
Nucleotides
Antibiotics
Fibers
Others
By Application
Beverages
Dairy Products
Bakery & Confectioneries
Nutraceuticals
Dietary Supplements
Infant Nutrition
Clinical Nutrition
Sports Nutrition
Pet Food
Others
By Form
Dry
Liquid
By Function
Bone Health
Skin Health
Energy
Immunity
Digestion
Others
Countries Analyzed
North America (US, Canada, Mexico)
Europe (Germany, UK, France, Spain, Italy, Russia, Rest of Europe)
Asia Pacific (China, India, Japan, South Korea, Australia, South East Asia, Rest of Asia)
South America (Brazil, Argentina, Rest of South America)
Middle East and Africa (Saudi Arabia, UAE, Rest of Middle East, South Africa, Egypt, Rest of Africa)
