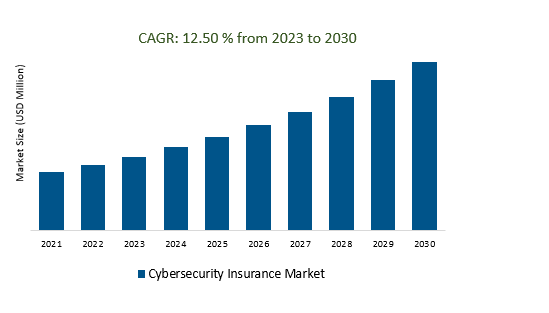
The Global Cybersecurity Insurance Market Size is estimated to be US 10.8 billion in 2023 and is poised to register 12.5% growth over the forecast period from 2023 to 2030 to reach US $ 24.6 billion in 2030.
The market growth is driven by the increasing frequency and sophistication of cyberattacks, including ransomware, data breaches, and phishing, which have heightened the demand for cybersecurity insurance as businesses seek protection against financial losses. Leading companies that are focused on Growing Market Size, Increased Cyber Threats, Regulatory Changes, Digital Transformation, Advanced Coverage Options, and others to boost market shares in the industry.
Market Overview
The cybersecurity insurance market, as of my last update in September 2021, was experiencing significant growth driven by increasing cyber threats, regulatory demands, and digital reliance. It offered coverage for various risks, including data breaches and business interruption, with premiums on the rise. Despite challenges related to accurately assessing cyber risks and capacity constraints, the market was evolving to provide more tailored coverage options and promote cyber risk education. It played a critical role in helping organizations mitigate financial risks associated with cyber incidents and regulatory fines. However, the market continued to evolve, and staying informed about the latest developments was crucial for businesses seeking appropriate coverage.
Market Dynamics
Market Trends - Cybersecurity Maturity Assessments: The Key to Affordable Cybersecurity Insurance
Cybersecurity maturity assessments play a pivotal role in obtaining cost-effective cybersecurity insurance by allowing insurers to assess an organization's cyber risk readiness accurately. These assessments encompass various areas of cybersecurity, including policies, technology, and incident response, offering insights into an organization's cyber preparedness. High maturity scores signify lower risk, making organizations eligible for favorable insurance terms, such as lower premiums and higher coverage limits. Conversely, lower maturity scores result in higher premiums or potential coverage denial, motivating organizations to enhance their cybersecurity practices continually.
Market Driver- Digital Transformation Demand Cybersecurity Insurance Market
The demand for cybersecurity insurance is driven by the ongoing digital transformation of businesses, which exposes them to increased cyber risks. As organizations adopt digital technologies and expand their digital footprint, the need for financial protection against cyber threats, data breaches, and vulnerabilities grows. Traditional security measures may not suffice in the evolving threat landscape, making cybersecurity insurance a crucial component of risk management for digitally transformed enterprises.
Market Opportunity-Introduction of Cybersecurity Investments
Cybersecurity investments are a vital component of the cybersecurity insurance market, reflecting organizations' efforts to enhance their digital defenses against evolving cyber threats. These investments, spanning technology, training, and policies, play a critical role in reducing the likelihood and financial impact of cyber incidents. Cyber insurance providers assess the extent of these investments when determining coverage terms and premiums, recognizing that strong cybersecurity measures are proactive steps organizations take to mitigate cyber risks.
Market Share Analysis- Solutions Cybersecurity Insurance Market will register the fastest growth
The Global Cybersecurity Insurance Market is analyzed across Solutions, Services, and others. The Solutions is poised to register the fastest growth. The cybersecurity insurance market provides a range of solutions to address cyber risks, including cyber insurance policies that offer financial protection against incidents, risk assessments to determine coverage and premiums, customized coverage options, incident response services, employee training, data breach notification services, supply chain risk mitigation, and regulatory compliance assistance. Additionally, insurers may offer risk management, legal and forensic support, business continuity planning, reputation management, cybersecurity consulting, continuous monitoring, and resources for cyber risk education.
Market Share Analysis- Cybersecurity Insurance Analytics Platform held a significant market share in 2023
The Global Cybersecurity Insurance Market is analyzed across various Solutions including Cybersecurity insurance analytics platforms, Disaster recovery and business continuity, Cybersecurity solutions, and others. Of these, the Cybersecurity Insurance Analytics Platform held a significant market share in 2023. A cybersecurity insurance analytics platform is specialized software that empowers insurers, underwriters, and risk managers with data-driven insights and advanced tools to assess and manage cyber risks associated with insurance policies. It aids in risk assessment, policy underwriting, predictive modeling, incident response planning, claims management, and portfolio optimization.
Cybersecurity Insurance Market Segmentation
By Offering
By Solution
- Cybersecurity insurance analytics platform
- Disaster recovery and business continuity
- Cybersecurity solution
By Service
- Consulting/ Advisory
- Security awareness training
- Others
By Insurance Coverage
- Data breach (Data loss, Denial of service and downtime, Ransomware attacks, Others)
- Cyber liability (Data protection and privacy costs, Non-compliance penalty, Brand and related intellectual property protection, Others)
By Compliance Requirements
- Healthcare Compliance
- Financial Services Compliance
- GDPR Compliance
- Data Privacy Compliance
- Others
By Insurance Type
By End User
- Technology provider
- Insurance provider
By Region
- North America (United States, Canada, Mexico)
- Europe (Germany, France, United Kingdom, Spain, Italy, Others)
- Asia Pacific (China, India, Japan, South Korea, Australia, Others)
- Latin America (Brazil, Argentina, Others)
- Middle East and Africa (Saudi Arabia, UAE, Kuwait, Other Middle East, South Africa, Nigeria, Other Africa)
Cybersecurity Insurance Market Companies
- Reseal (United States)
- Prevalent (United States)
- Security Scorecard (United States)
- Bit Sight (United States)
- Cyber Indemnity Solutions (Australia)
- Cisco (United States)
- Up Guard (United States)
- Microsoft (United States)
- Check Point (United States)
- AttackIQ (United States)
- Founder Shield (United States)
- Broadcom (United States)
- Accenture (Ireland)
- SecurIT360 (United States)
- Cylance (United States)
- CyberArk (United States)
- CYE (Israel)
- Sentinel One (United States)
- Trellix (United States)
*List not exhaustive
Cybersecurity Insurance Market Outlook 2023
1 Market Overview
1.1 Introduction to the Cybersecurity Insurance Market
1.2 Scope of the Study
1.3 Research Objective
1.3.1 Key Market Scope and Segments
1.3.2 Players Covered
1.3.3 Years Considered
2 Executive Summary
2.1 2023 Cybersecurity Insurance Industry- Market Statistics
3 Market Dynamics
3.1 Market Drivers
3.2 Market Challenges
3.3 Market Opportunities
3.4 Market Trends
4 Market Factor Analysis
4.1 Porter’s Five Forces
4.2 Market Entropy
4.2.1 Global Cybersecurity Insurance Market Companies with Area Served
4.2.2 Products Offerings Global Cybersecurity Insurance Market
5 COVID-19 Impact Analysis and Outlook Scenarios
5.1.1 Covid-19 Impact Analysis
5.1.2 post-COVID-19 Scenario- Low Growth Case
5.1.3 post-COVID-19 Scenario- Reference Growth Case
5.1.4 post-COVID-19 Scenario- Low Growth Case
6 Global Cybersecurity Insurance Market Trends
6.1 Global Cybersecurity Insurance Revenue (USD Million) and CAGR (%) by Type (2018-2030)
6.2 Global Cybersecurity Insurance Revenue (USD Million) and CAGR (%) by Applications (2018-2030)
6.3 Global Cybersecurity Insurance Revenue (USD Million) and CAGR (%) by regions (2018-2030)
7 Global Cybersecurity Insurance Market Revenue (USD Million) by Type, and Applications (2018-2022)
7.1 Global Cybersecurity Insurance Revenue (USD Million) by Type (2018-2022)
7.1.1 Global Cybersecurity Insurance Revenue (USD Million), Market Share (%) by Type (2018-2022)
7.2 Global Cybersecurity Insurance Revenue (USD Million) by Applications (2018-2022)
7.2.1 Global Cybersecurity Insurance Revenue (USD Million), Market Share (%) by Applications (2018-2022)
8 Global Cybersecurity Insurance Development Regional Status and Outlook
8.1 Global Cybersecurity Insurance Revenue (USD Million) By Regions (2018-2022)
8.2 North America Cybersecurity Insurance Revenue (USD Million) by Type, and Application (2018-2022)
8.2.1 North America Cybersecurity Insurance Revenue (USD Million) by Country (2018-2022)
8.2.2 North America Cybersecurity Insurance Revenue (USD Million) by Type (2018-2022)
8.2.3 North America Cybersecurity Insurance Revenue (USD Million) by Applications (2018-2022)
8.3 Europe Cybersecurity Insurance Revenue (USD Million), by Type, and Applications (USD Million) (2018-2022)
8.3.1 Europe Cybersecurity Insurance Revenue (USD Million), by Country (2018-2022)
8.3.2 Europe Cybersecurity Insurance Revenue (USD Million) by Type (2018-2022)
8.3.3 Europe Cybersecurity Insurance Revenue (USD Million) by Applications (2018-2022)
8.4 Asia Pacific Cybersecurity Insurance Revenue (USD Million), and Revenue (USD Million) by Type, and Applications (2018-2022)
8.4.1 Asia Pacific Cybersecurity Insurance Revenue (USD Million) by Country (2018-2022)
8.4.2 Asia Pacific Cybersecurity Insurance Revenue (USD Million) by Type (2018-2022)
8.4.3 Asia Pacific Cybersecurity Insurance Revenue (USD Million) by Applications (2018-2022)
8.5 South America Cybersecurity Insurance Revenue (USD Million), by Type, and Applications (2018-2022)
8.5.1 South America Cybersecurity Insurance Revenue (USD Million), by Country (2018-2022)
8.5.2 South America Cybersecurity Insurance Revenue (USD Million) by Type (2018-2022)
8.5.3 South America Cybersecurity Insurance Revenue (USD Million) by Applications (2018-2022)
8.6 Middle East and Africa Cybersecurity Insurance Revenue (USD Million), by Type, Technology, Application, Thickness (2018-2022)
8.6.1 Middle East and Africa Cybersecurity Insurance Revenue (USD Million) by Country (2018-2022)
8.6.2 Middle East and Africa Cybersecurity Insurance Revenue (USD Million) by Type (2018-2022)
8.6.3 Middle East and Africa Cybersecurity Insurance Revenue (USD Million) by Applications (2018-2022)
9 Company Profiles
10 Global Cybersecurity Insurance Market Revenue (USD Million), by Type, and Applications (2023-2030)
10.1 Global Cybersecurity Insurance Revenue (USD Million) and Market Share (%) by Type (2023-2030)
10.1.1 Global Cybersecurity Insurance Revenue (USD Million), and Market Share (%) by Type (2023-2030)
10.2 Global Cybersecurity Insurance Revenue (USD Million) and Market Share (%) by Applications (2023-2030)
10.2.1 Global Cybersecurity Insurance Revenue (USD Million), and Market Share (%) by Applications (2023-2030)
11 Global Cybersecurity Insurance Development Regional Status and Outlook Forecast
11.1 Global Cybersecurity Insurance Revenue (USD Million) By Regions (2023-2030)
11.2 North America Cybersecurity Insurance Revenue (USD Million) by Type, and Applications (2023-2030)
11.2.1 North America Cybersecurity Insurance Revenue (USD) Million by Country (2023-2030)
11.2.2 North America Cybersecurity Insurance Revenue (USD Million), by Type (2023-2030)
11.2.3 North America Cybersecurity Insurance Revenue (USD Million), Market Share (%) by Applications (2023-2030)
11.3 Europe Cybersecurity Insurance Revenue (USD Million), by Type, and Applications (2023-2030)
11.3.1 Europe Cybersecurity Insurance Revenue (USD Million), by Country (2023-2030)
11.3.2 Europe Cybersecurity Insurance Revenue (USD Million), by Type (2023-2030)
11.3.3 Europe Cybersecurity Insurance Revenue (USD Million), by Applications (2023-2030)
11.4 Asia Pacific Cybersecurity Insurance Revenue (USD Million) by Type, and Applications (2023-2030)
11.4.1 Asia Pacific Cybersecurity Insurance Revenue (USD Million), by Country (2023-2030)
11.4.2 Asia Pacific Cybersecurity Insurance Revenue (USD Million), by Type (2023-2030)
11.4.3 Asia Pacific Cybersecurity Insurance Revenue (USD Million), by Applications (2023-2030)
11.5 South America Cybersecurity Insurance Revenue (USD Million), by Type, and Applications (2023-2030)
11.5.1 South America Cybersecurity Insurance Revenue (USD Million), by Country (2023-2030)
11.5.2 South America Cybersecurity Insurance Revenue (USD Million), by Type (2023-2030)
11.5.3 South America Cybersecurity Insurance Revenue (USD Million), by Applications (2023-2030)
11.6 Middle East and Africa Cybersecurity Insurance Revenue (USD Million), by Type, and Applications (2023-2030)
11.6.1 Middle East and Africa Cybersecurity Insurance Revenue (USD Million), by region (2023-2030)
11.6.2 Middle East and Africa Cybersecurity Insurance Revenue (USD Million), by Type (2023-2030)
11.6.3 Middle East and Africa Cybersecurity Insurance Revenue (USD Million), by Applications (2023-2030)
12 Methodology and Data Sources
12.1 Methodology/Research Approach
12.1.1 Research Programs/Design
12.1.2 Market Size Estimation
12.1.3 Market Breakdown and Data Triangulation
12.2 Data Sources
12.2.1 Secondary Sources
12.2.2 Primary Sources
12.3 Disclaimer
List of Tables
Table 1 Market Segmentation Analysis
Table 2 Global Cybersecurity Insurance Market Companies with Areas Served
Table 3 Products Offerings Global Cybersecurity Insurance Market
Table 4 Low Growth Scenario Forecasts
Table 5 Reference Case Growth Scenario
Table 6 High Growth Case Scenario
Table 7 Global Cybersecurity Insurance Revenue (USD Million) And CAGR (%) By Type (2018-2030)
Table 8 Global Cybersecurity Insurance Revenue (USD Million) And CAGR (%) By Applications (2018-2030)
Table 9 Global Cybersecurity Insurance Revenue (USD Million) And CAGR (%) By Regions (2018-2030)
Table 10 Global Cybersecurity Insurance Revenue (USD Million) By Type (2018-2022)
Table 11 Global Cybersecurity Insurance Revenue Market Share (%) By Type (2018-2022)
Table 12 Global Cybersecurity Insurance Revenue (USD Million) By Applications (2018-2022)
Table 13 Global Cybersecurity Insurance Revenue Market Share (%) By Applications (2018-2022)
Table 14 Global Cybersecurity Insurance Market Revenue (USD Million) By Regions (2018-2022)
Table 15 Global Cybersecurity Insurance Market Share (%) By Regions (2018-2022)
Table 16 North America Cybersecurity Insurance Revenue (USD Million) By Country (2018-2022)
Table 17 North America Cybersecurity Insurance Revenue (USD Million) By Type (2018-2022)
Table 18 North America Cybersecurity Insurance Revenue (USD Million) By Applications (2018-2022)
Table 19 Europe Cybersecurity Insurance Revenue (USD Million) By Country (2018-2022)
Table 20 Europe Cybersecurity Insurance Revenue (USD Million) By Type (2018-2022)
Table 21 Europe Cybersecurity Insurance Revenue (USD Million) By Applications (2018-2022)
Table 22 Asia Pacific Cybersecurity Insurance Revenue (USD Million) By Country (2018-2022)
Table 23 Asia Pacific Cybersecurity Insurance Revenue (USD Million) By Type (2018-2022)
Table 24 Asia Pacific Cybersecurity Insurance Revenue (USD Million) By Applications (2018-2022)
Table 25 South America Cybersecurity Insurance Revenue (USD Million) By Country (2018-2022)
Table 26 South America Cybersecurity Insurance Revenue (USD Million) By Type (2018-2022)
Table 27 South America Cybersecurity Insurance Revenue (USD Million) By Applications (2018-2022)
Table 28 Middle East and Africa Cybersecurity Insurance Revenue (USD Million) By Region (2018-2022)
Table 29 Middle East and Africa Cybersecurity Insurance Revenue (USD Million) By Type (2018-2022)
Table 30 Middle East and Africa Cybersecurity Insurance Revenue (USD Million) By Applications (2018-2022)
Table 31 Financial Analysis
Table 32 Global Cybersecurity Insurance Revenue (USD Million) By Type (2023-2030)
Table 33 Global Cybersecurity Insurance Revenue Market Share (%) By Type (2023-2030)
Table 34 Global Cybersecurity Insurance Revenue (USD Million) By Applications (2023-2030)
Table 35 Global Cybersecurity Insurance Revenue Market Share (%) By Applications (2023-2030)
Table 36 Global Cybersecurity Insurance Market Revenue (USD Million), And Revenue (USD Million) By Regions (2023-2030)
Table 37 North America Cybersecurity Insurance Revenue (USD)By Country (2023-2030)
Table 38 North America Cybersecurity Insurance Revenue (USD Million) By Type (2023-2030)
Table 39 North America Cybersecurity Insurance Revenue (USD Million) By Applications (2023-2030)
Table 40 Europe Cybersecurity Insurance Revenue (USD Million) By Country (2023-2030)
Table 41 Europe Cybersecurity Insurance Revenue (USD Million) By Type (2023-2030)
Table 42 Europe Cybersecurity Insurance Revenue (USD Million) By Applications (2023-2030)
Table 43 Asia Pacific Cybersecurity Insurance Revenue (USD Million) By Country (2023-2030)
Table 44 Asia Pacific Cybersecurity Insurance Revenue (USD Million) By Type (2023-2030)
Table 45 Asia Pacific Cybersecurity Insurance Revenue (USD Million) By Applications (2023-2030)
Table 46 South America Cybersecurity Insurance Revenue (USD Million) By Country (2023-2030)
Table 47 South America Cybersecurity Insurance Revenue (USD Million) By Type (2023-2030)
Table 48 South America Cybersecurity Insurance Revenue (USD Million) By Applications (2023-2030)
Table 49 Middle East and Africa Cybersecurity Insurance Revenue (USD Million) By Region (2023-2030)
Table 50 Middle East and Africa Cybersecurity Insurance Revenue (USD Million) By Region (2023-2030)
Table 51 Middle East and Africa Cybersecurity Insurance Revenue (USD Million) By Type (2023-2030)
Table 52 Middle East and Africa Cybersecurity Insurance Revenue (USD Million) By Applications (2023-2030)
Table 53 Research Programs/Design for This Report
Table 54 Key Data Information from Secondary Sources
Table 55 Key Data Information from Primary Sources
List of Figures
Figure 1 Market Scope
Figure 2 Porter’s Five Forces
Figure 3 Global Cybersecurity Insurance Revenue (USD Million) By Type (2018-2022)
Figure 4 Global Cybersecurity Insurance Revenue Market Share (%) By Type (2022)
Figure 5 Global Cybersecurity Insurance Revenue (USD Million) By Applications (2018-2022)
Figure 6 Global Cybersecurity Insurance Revenue Market Share (%) By Applications (2022)
Figure 7 Global Cybersecurity Insurance Market Revenue (USD Million) By Regions (2018-2022)
Figure 8 Global Cybersecurity Insurance Market Share (%) By Regions (2022)
Figure 9 North America Cybersecurity Insurance Revenue (USD Million) By Country (2018-2022)
Figure 10 North America Cybersecurity Insurance Revenue (USD Million) By Type (2018-2022)
Figure 11 North America Cybersecurity Insurance Revenue (USD Million) By Applications (2018-2022)
Figure 12 Europe Cybersecurity Insurance Revenue (USD Million) By Country (2018-2022)
Figure 13 Europe Cybersecurity Insurance Revenue (USD Million) By Type (2018-2022)
Figure 14 Europe Cybersecurity Insurance Revenue (USD Million) By Applications (2018-2022)
Figure 15 Asia Pacific Cybersecurity Insurance Revenue (USD Million) By Country (2018-2022)
Figure 16 Asia Pacific Cybersecurity Insurance Revenue (USD Million) By Type (2018-2022)
Figure 17 Asia Pacific Cybersecurity Insurance Revenue (USD Million) By Applications (2018-2022)
Figure 18 South America Cybersecurity Insurance Revenue (USD Million) By Country (2018-2022)
Figure 19 South America Cybersecurity Insurance Revenue (USD Million) By Type (2018-2022)
Figure 20 South America Cybersecurity Insurance Revenue (USD Million) By Applications (2018-2022)
Figure 21 Middle East and Africa Cybersecurity Insurance Revenue (USD Million) By Region (2018-2022)
Figure 22 Middle East and Africa Cybersecurity Insurance Revenue (USD Million) By Type (2018-2022)
Figure 23 Middle East and Africa Cybersecurity Insurance Revenue (USD Million) By Applications (2018-2022)
Figure 24 Global Cybersecurity Insurance Revenue (USD Million) By Type (2023-2030)
Figure 25 Global Cybersecurity Insurance Revenue Market Share (%) By Type (2030)
Figure 26 Global Cybersecurity Insurance Revenue (USD Million) By Applications (2023-2030)
Figure 27 Global Cybersecurity Insurance Revenue Market Share (%) By Applications (2030)
Figure 28 Global Cybersecurity Insurance Market Revenue (USD Million) By Regions (2023-2030)
Figure 29 North America Cybersecurity Insurance Revenue (USD Million) By Country (2023-2030)
Figure 30 North America Cybersecurity Insurance Revenue (USD Million) By Type (2023-2030)
Figure 31 North America Cybersecurity Insurance Revenue (USD Million) By Applications (2023-2030)
Figure 32 Europe Cybersecurity Insurance Revenue (USD Million) By Country (2023-2030)
Figure 33 Europe Cybersecurity Insurance Revenue (USD Million) By Type (2023-2030)
Figure 34 Europe Cybersecurity Insurance Revenue (USD Million) By Applications (2023-2030)
Figure 35 Asia Pacific Cybersecurity Insurance Revenue (USD Million) By Country (2023-2030)
Figure 36 Asia Pacific Cybersecurity Insurance Revenue (USD Million) By Type (2023-2030)
Figure 37 Asia Pacific Cybersecurity Insurance Revenue (USD Million) By Applications (2023-2030)
Figure 38 South America Cybersecurity Insurance Revenue (USD Million) By Country (2023-2030)
Figure 39 South America Cybersecurity Insurance Revenue (USD Million) By Type (2023-2030)
Figure 40 South America Cybersecurity Insurance Revenue (USD Million) By Applications (2023-2030)
Figure 41 Middle East and Africa Cybersecurity Insurance Revenue (USD Million) By Region (2023-2030)
Figure 42 Middle East and Africa Cybersecurity Insurance Revenue (USD Million) By Region (2023-2030)
Figure 43 Middle East and Africa Cybersecurity Insurance Revenue (USD Million) By Type (2023-2030)
Figure 44 Middle East and Africa Cybersecurity Insurance Revenue (USD Million) By Applications (2023-2030)
Figure 45 Bottom-Up and Top-Down Approaches for This Report
Figure 46 Data Triangulation
