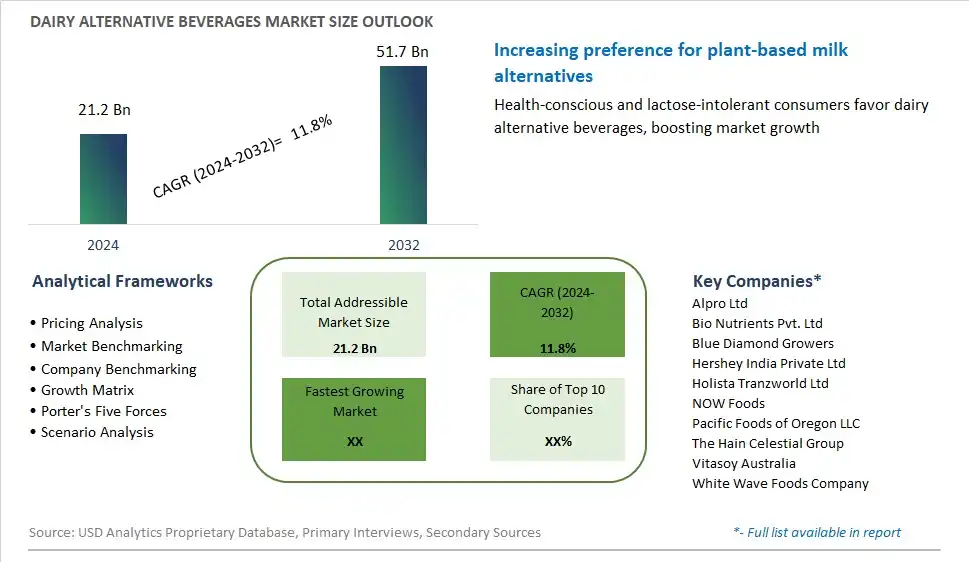
Global Dairy Alternative Beverages Market Size is valued at $21.2 Billion in 2024 and is forecast to register a growth rate (CAGR) of 11.8% to reach $51.7 Billion by 2032.
The global Dairy Alternative Beverages Market Comprehensive Study analyzes and forecasts the market size across 6 regions and 24 countries for diverse segments -By Variety (Almond Milk, Soy Milk, Oats Milk, Coconut Milk, Cashew Milk, Others), By Type (Unflavored, Flavored), By Form (Powder, Liquid), By Application (Ice Creams, Desserts, Cheese, Yoghurt, Others), By Distribution Channel (Supermarkets/Hypermarkets, Specialty Stores, Grocery Stores, Online, Others)
An Introduction to Dairy Alternative Beverages Market
In 2024, the dairy alternative beverages market continues to expand rapidly as consumers increasingly seek plant-based options for their dietary preferences, health concerns, and environmental considerations. Dairy alternative beverages, also known as plant-based or non-dairy milk, encompass a diverse range of products made from soy, almonds, oats, coconut, rice, and other plant sources, offering lactose-free and vegan-friendly alternatives to traditional dairy milk. The market is driven by factors such as growing lactose intolerance, dairy allergies, ethical concerns regarding animal welfare, and the desire for sustainable food choices. Moreover, advancements in food processing technologies, flavor innovations, and fortification techniques ensure that dairy alternative beverages offer comparable taste, texture, and nutritional profiles to dairy milk, meeting the demands of discerning consumers. As plant-based diets continue to gain popularity and mainstream acceptance, the dairy alternative beverages market presents opportunities for manufacturers, retailers, and foodservice providers to innovate, diversify, and capture market share in a dynamic and rapidly growing segment of the beverage industry.
Dairy Alternative Beverages Competitive Landscape
The market report analyses the leading companies in the industry including Alpro Ltd, Bio Nutrients Pvt. Ltd, Blue Diamond Growers, Hershey India Private Ltd, Holista Tranzworld Ltd, NOW Foods, Pacific Foods of Oregon LLC, The Hain Celestial Group, Vitasoy Australia, White Wave Foods Company, and Others.
Dairy Alternative Beverages Market Dynamics
Dairy Alternative Beverages Market Trend: Growing Preference for Plant-Based and Dairy-Free Options
An evident trend in the dairy alternative beverages market is the increasing consumer preference for plant-based and dairy-free options. This shift is driven by various factors, including health consciousness, ethical concerns, and dietary restrictions such as lactose intolerance or dairy allergies. As more people seek alternatives to traditional dairy products, there has been a surge in demand for beverages made from plant sources such as soy, almond, oat, coconut, and rice. Additionally, the rise of veganism and environmental sustainability movements has further propelled the popularity of dairy alternatives, leading to a diversified product range and innovative formulations to cater to evolving consumer preferences.
Market Driver: Health and Wellness Consciousness Among Consumers
A significant driver fueling the growth of the dairy alternative beverages market is the increasing emphasis on health and wellness among consumers. With a growing awareness of the potential health risks associated with consuming dairy products, including concerns about hormones, antibiotics, and saturated fats, many individuals are actively seeking healthier alternatives. Plant-based beverages offer various nutritional benefits, such as being lower in calories, cholesterol-free, and rich in vitamins, minerals, and antioxidants. Moreover, they are perceived as being easier to digest and may contribute to improved overall well-being. This heightened focus on health-conscious choices is driving consumers to incorporate dairy alternative beverages into their daily diets, thereby expanding the market demand.
Market Opportunity: Innovation in Flavor Profiles and Functional Ingredients
An exciting opportunity in the dairy alternative beverages market lies in the innovation of flavor profiles and functional ingredients. While traditional dairy products have a long-established presence in the market, there is ample room for creativity and differentiation within the dairy alternative segment. Businesses can capitalize on this opportunity by developing unique flavor combinations, such as matcha latte almond milk or turmeric-infused coconut milk, to cater to diverse consumer preferences and taste preferences. Additionally, incorporating functional ingredients such as probiotics, vitamins, and protein fortifications can enhance the nutritional value and appeal of dairy alternative beverages, appealing to health-conscious consumers seeking added benefits beyond basic hydration. By continually innovating and introducing new product offerings, companies can differentiate themselves in a competitive market landscape and capture a larger share of the growing dairy alternative beverages market.
Dairy Alternative Beverages Market Share Analysis: Almond Milk held the dominant market share in 2024
In the Dairy Alternative Beverages Market segmented by variety, the largest segment is Almond Milk, owing to its widespread popularity, nutritional benefits, and versatility in culinary applications. Almond milk has emerged as a favored dairy alternative among consumers due to its creamy texture, mild flavor, and lactose-free composition, making it suitable for individuals with lactose intolerance or dietary restrictions. Additionally, almond milk is rich in vitamins, minerals, and antioxidants, contributing to its perceived health benefits and alignment with wellness trends. Its versatility allows for use in various recipes, including smoothies, coffee beverages, baked goods, and savory dishes, further driving its consumption. Further, the environmental sustainability of almond milk production, compared to traditional dairy farming, resonates with environmentally conscious consumers, further bolstering its market dominance. While soy milk, oats milk, coconut milk, cashew milk, and other dairy alternatives also contribute to the market, the Almond Milk segment maintains its prominence, reflecting its widespread acceptance and consumer preference for its taste, nutrition, and versatility.
Dairy Alternative Beverages Market Share Analysis: Flavored market is poised to register the fastest growth rae over the forecast period to 2032
In the Dairy Alternative Beverages Market segmented by type, the fastest-growing segment is Flavored, driven by consumer demand for innovative and indulgent beverage options that offer unique taste experiences. Flavored dairy alternative beverages appeal to consumers seeking variety, excitement, and novelty in their beverage choices, as they offer a wide range of flavors such as chocolate, vanilla, strawberry, and caramel, among others. These flavored variants provide a refreshing alternative to traditional dairy milk and cater to diverse taste preferences and dietary needs. Further, flavored dairy alternative beverages are often fortified with vitamins, minerals, and other functional ingredients, enhancing their nutritional profile and appeal to health-conscious consumers. Additionally, the growing popularity of plant-based diets and vegan lifestyles contributes to the increasing demand for flavored dairy alternative beverages as consumers seek delicious and satisfying alternatives to dairy milk. While unflavored dairy alternative beverages also hold significance in the market, the Flavored segment demonstrates rapid growth, reflecting consumers' preference for indulgent and flavorful beverage options.
Dairy Alternative Beverages Market Share Analysis: Liquid held the dominant market share in 2024
In the Dairy Alternative Beverages Market segmented by form, the largest segment is Liquid, primarily due to its convenience, versatility, and immediate consumption appeal. Liquid dairy alternative beverages, available in cartons, bottles, or tetra packs, offer consumers a ready-to-drink option that can be easily poured and consumed on the go or at home. These beverages encompass a wide range of options, including almond milk, soy milk, oat milk, coconut milk, and more, providing consumers with diverse choices to suit their taste preferences and dietary requirements. Further, liquid dairy alternatives are widely available in supermarkets, convenience stores, and online retail platforms, contributing to their accessibility and widespread adoption among consumers. Additionally, the liquid form allows for easy integration into various recipes, including smoothies, coffee beverages, cereal bowls, and cooking applications, further enhancing their versatility and consumer appeal. While powdered dairy alternative beverages also offer convenience and longer shelf life, the Liquid segment maintains its dominance, reflecting its immediate consumption convenience and versatility in meeting consumers' beverage needs.
Dairy Alternative Beverages Market Segmentation
By Variety
Almond Milk
Soy Milk
Oats Milk
Coconut Milk
Cashew Milk
Others
By Type
Unflavored
Flavored
By Form
Powder
Liquid
By Application
Ice Creams
Desserts
Cheese
Yoghurt
Others
By Distribution Channel
Supermarkets/Hypermarkets
Specialty Stores
Grocery Stores
Online
Others
Countries Analyzed
North America (US, Canada, Mexico)
Europe (Germany, UK, France, Spain, Italy, Russia, Rest of Europe)
Asia Pacific (China, India, Japan, South Korea, Australia, South East Asia, Rest of Asia)
South America (Brazil, Argentina, Rest of South America)
Middle East and Africa (Saudi Arabia, UAE, Rest of Middle East, South Africa, Egypt, Rest of Africa)
Dairy Alternative Beverages Companies Profiled in the Study
Alpro Ltd
Bio Nutrients Pvt. Ltd
Blue Diamond Growers
Hershey India Private Ltd
Holista Tranzworld Ltd
NOW Foods
Pacific Foods of Oregon LLC
The Hain Celestial Group
Vitasoy Australia
White Wave Foods Company
*- List Not Exhaustive
Chapter 1. TABLE OF CONTENTS
Chapter 2. Introduction to Dairy Alternative Beverages Market
2.1. Market Overview
2.2. Key Statistics and Report Highlights
2.3. Scope of the Comprehensive Study
2.3.1. Market Definition
2.3.2 Countries and Regions Covered
2.3.3 Research Objective
2.3.4 Units, Currency, and Conversions
2.3.5 Industry Value Chain
2.4. Key Market Segments
2.5. Key Companies
2.6. Study Period
Chapter 3. Strategic Analysis Review
3.1. Dairy Alternative Beverages Pricing Analysis and Forecast
3.2. Porter’s Five Forces
3.3. Market Ecosystem
3.4. SWOT Analysis
3.5. Regulatory Scenario
3.3. Effects of Inflation, Russia-Ukraine War, moderating economic growth, and other macroeconomic factors
Chapter 4. Competitive Landscape
4.1. Market Share Analysis
4.1.1. Global Dairy Alternative Beverages Market Share by Company, 2023
4.1.2. Product Offerings of Leading Dairy Alternative Beverages Companies
4.2. Market Entropy
4.2.1. New Product Launches in the Industry
4.2.2. Mergers, Acquisitions, Joint ventures, and Partnerships
4.3. Key Strategies and Best Practices
Chapter 5. Global Market Projections: Best, Reference, and Low Case Scenarios
5.1. Growth Analysis- Case Scenario Definitions
5.2. Low Growth Case Scenario Forecasts
5.3. Reference Growth Case Scenario Forecasts
5.4. High Growth Case Scenario Forecasts
Chapter 6. Market Dynamics
6.1. Dairy Alternative Beverages Market Drivers
6.2. Dairy Alternative Beverages Market Challenges
6.6. Dairy Alternative Beverages Market Opportunities
6.4. Dairy Alternative Beverages Market Trends
Chapter 7. Global Dairy Alternative Beverages Market Outlook Trends
7.1. Global Dairy Alternative Beverages Revenue (USD Million) and CAGR (%) by Type (2021-2032)
7.2. Global Dairy Alternative Beverages Revenue (USD Million) and CAGR (%) by Application (2021-2032)
7.3. Global Dairy Alternative Beverages Revenue (USD Million) and CAGR (%) by Product (2021-2032)
By Variety
Almond Milk
Soy Milk
Oats Milk
Coconut Milk
Cashew Milk
Others
By Type
Unflavored
Flavored
By Form
Powder
Liquid
By Application
Ice Creams
Desserts
Cheese
Yoghurt
Others
By Distribution Channel
Supermarkets/Hypermarkets
Specialty Stores
Grocery Stores
Online
Others
Chapter 8. Global Dairy Alternative Beverages Regional Analysis and Outlook
8.1. Global Dairy Alternative Beverages Revenue (USD Million) By Regions (2021- 2032)
8.2. North America Dairy Alternative Beverages Revenue (USD Million) by Country (2021-2032)
8.2.1. United States Dairy Alternative Beverages Regional Analysis and Outlook
8.2.2. Canada Dairy Alternative Beverages Regional Analysis and Outlook
8.2.3. Mexico Dairy Alternative Beverages Regional Analysis and Outlook
8.3. Europe Dairy Alternative Beverages Revenue (USD Million), by Country (2021-2032)
8.3.1. Germany Dairy Alternative Beverages Regional Analysis and Outlook
8.3.2. France Dairy Alternative Beverages Regional Analysis and Outlook
8.3.3. United Kingdom Dairy Alternative Beverages Regional Analysis and Outlook
8.3.4. Spain Dairy Alternative Beverages Regional Analysis and Outlook
8.3.5. Italy Dairy Alternative Beverages Regional Analysis and Outlook
8.3.6. Russia Dairy Alternative Beverages Regional Analysis and Outlook
8.3.7. Rest of Europe Dairy Alternative Beverages Regional Analysis and Outlook
8.4. Asia Pacific Dairy Alternative Beverages Revenue (USD Million) by Country (2021-2032)
8.4.1. China Dairy Alternative Beverages Regional Analysis and Outlook
8.4.2. Japan Dairy Alternative Beverages Regional Analysis and Outlook
8.4.3. India Dairy Alternative Beverages Regional Analysis and Outlook
8.4.4. South Korea Dairy Alternative Beverages Regional Analysis and Outlook
8.4.5. Australia Dairy Alternative Beverages Regional Analysis and Outlook
8.4.6. South East Asia Dairy Alternative Beverages Regional Analysis and Outlook
8.4.7. Rest of Asia Pacific Dairy Alternative Beverages Regional Analysis and Outlook
8.5. South America Dairy Alternative Beverages Revenue (USD Million), by Country (2021-2032)
8.5.1. Brazil Dairy Alternative Beverages Regional Analysis and Outlook
8.5.2. Argentina Dairy Alternative Beverages Regional Analysis and Outlook
8.5.3. Rest of South America Dairy Alternative Beverages Regional Analysis and Outlook
8.6. Middle East and Africa Dairy Alternative Beverages Revenue (USD Million) by Country (2021-2032)
8.6.1. Middle East Dairy Alternative Beverages Regional Analysis and Outlook
8.6.2. Africa Dairy Alternative Beverages Regional Analysis and Outlook
Chapter 9. North America Dairy Alternative Beverages Analysis and Outlook
9.1. North America Dairy Alternative Beverages Revenue (USD Million) by Segments (2021-2032)
9.1.1. North America Dairy Alternative Beverages Revenue (USD Million) by Type (2021-2032)
9.1.2. North America Dairy Alternative Beverages Revenue (USD Million) by Application (2021-2032)
9.1.3. North America Dairy Alternative Beverages Revenue (USD Million) by Product (2021-2032)
By Variety
Almond Milk
Soy Milk
Oats Milk
Coconut Milk
Cashew Milk
Others
By Type
Unflavored
Flavored
By Form
Powder
Liquid
By Application
Ice Creams
Desserts
Cheese
Yoghurt
Others
By Distribution Channel
Supermarkets/Hypermarkets
Specialty Stores
Grocery Stores
Online
Others
Chapter 10. Europe Dairy Alternative Beverages Analysis and Outlook
10.1. Europe Dairy Alternative Beverages Revenue (USD Million), by Segments (USD Million) (2021-2032)
10.1.1. Europe Dairy Alternative Beverages Revenue (USD Million) by Type (2021-2032)
10.1.2. Europe Dairy Alternative Beverages Revenue (USD Million) by Application (2021-2032)
10.1.3. Europe Dairy Alternative Beverages Revenue (USD Million) by Product (2021-2032)
By Variety
Almond Milk
Soy Milk
Oats Milk
Coconut Milk
Cashew Milk
Others
By Type
Unflavored
Flavored
By Form
Powder
Liquid
By Application
Ice Creams
Desserts
Cheese
Yoghurt
Others
By Distribution Channel
Supermarkets/Hypermarkets
Specialty Stores
Grocery Stores
Online
Others
Chapter 11. Asia Pacific Dairy Alternative Beverages Analysis and Outlook
11.1. Asia Pacific Dairy Alternative Beverages Revenue (USD Million), and Revenue (USD Million) by Segments (2021-2032)
11.1.1. Asia Pacific Dairy Alternative Beverages Revenue (USD Million) by Type (2021-2032)
11.1.2. Asia Pacific Dairy Alternative Beverages Revenue (USD Million) by Application (2021-2032)
11.1.3. Asia Pacific Dairy Alternative Beverages Revenue (USD Million) by Product (2021-2032)
By Variety
Almond Milk
Soy Milk
Oats Milk
Coconut Milk
Cashew Milk
Others
By Type
Unflavored
Flavored
By Form
Powder
Liquid
By Application
Ice Creams
Desserts
Cheese
Yoghurt
Others
By Distribution Channel
Supermarkets/Hypermarkets
Specialty Stores
Grocery Stores
Online
Others
Chapter 12. South America Dairy Alternative Beverages Analysis and Outlook
12.1. South America Dairy Alternative Beverages Revenue (USD Million), by Segments (2021-2032)
12.1.1. South America Dairy Alternative Beverages Revenue (USD Million) by Type (2021-2032)
12.1.2. South America Dairy Alternative Beverages Revenue (USD Million) by Application (2021-2032)
12.1.3. South America Dairy Alternative Beverages Revenue (USD Million) by Product (2021-2032)
By Variety
Almond Milk
Soy Milk
Oats Milk
Coconut Milk
Cashew Milk
Others
By Type
Unflavored
Flavored
By Form
Powder
Liquid
By Application
Ice Creams
Desserts
Cheese
Yoghurt
Others
By Distribution Channel
Supermarkets/Hypermarkets
Specialty Stores
Grocery Stores
Online
Others
Chapter 13. Middle East and Africa Dairy Alternative Beverages Analysis and Outlook
13.1. Middle East and Africa Dairy Alternative Beverages Revenue (USD Million), by Segments (2021-2032)
13.1.1. Middle East and Africa Dairy Alternative Beverages Revenue (USD Million) by Type (2021-2032)
13.1.2. Middle East and Africa Dairy Alternative Beverages Revenue (USD Million) by Application (2021-2032)
13.1.3. Middle East and Africa Dairy Alternative Beverages Revenue (USD Million) by Product (2021-2032)
By Variety
Almond Milk
Soy Milk
Oats Milk
Coconut Milk
Cashew Milk
Others
By Type
Unflavored
Flavored
By Form
Powder
Liquid
By Application
Ice Creams
Desserts
Cheese
Yoghurt
Others
By Distribution Channel
Supermarkets/Hypermarkets
Specialty Stores
Grocery Stores
Online
Others
Chapter 14. Dairy Alternative Beverages Company Profiles
14.1 Business Overview
14.2 Product Profiles
14.3 SWOT Profiles
14.5 Recent Developments
14.6 Financial Profile
List of Companies
Alpro Ltd
Bio Nutrients Pvt. Ltd
Blue Diamond Growers
Hershey India Private Ltd
Holista Tranzworld Ltd
NOW Foods
Pacific Foods of Oregon LLC
The Hain Celestial Group
Vitasoy Australia
White Wave Foods Company
15. Methodology and Data Sources
15.1 Customization Offerings
15.2 Subscription Services
15.3 Related Reports
15.4 Publisher Expertise
LIST OF TABLES
Table 1 Market Segmentation Analysis
Table 2 Global Dairy Alternative Beverages Market Share of Leading Companies, 2023
Table 3 Product Offerings of Leading Companies
Table 4 Low Growth Scenario Forecasts
Table 5 Reference Case Growth Scenario
Table 6 High Growth Case Scenario
Table 7 Global Dairy Alternative Beverages Revenue (USD Million) And CAGR (%) By Type (2021-2032)
Table 8 Global Dairy Alternative Beverages Revenue (USD Million) And CAGR (%) By Application (2021-2032)
Table 9 Global Dairy Alternative Beverages Revenue (USD Million) And CAGR (%) By Product (2021-2032)
Table 10 Global Dairy Alternative Beverages Market Revenue (USD Million) By Regions (2021-2032)
Table 11 Global Dairy Alternative Beverages Market Share (%) By Regions (2021-2032)
Table 12 North America Dairy Alternative Beverages Revenue (USD Million) By Country (2021-2032)
Table 13 Europe Dairy Alternative Beverages Revenue (USD Million) By Country (2021-2032)
Table 14 Asia Pacific Dairy Alternative Beverages Revenue (USD Million) By Country (2021-2032)
Table 15 South America Dairy Alternative Beverages Revenue (USD Million) By Country (2021-2032)
Table 16 Middle East and Africa Dairy Alternative Beverages Revenue (USD Million) By Region (2021-2032)
Table 17 North America Dairy Alternative Beverages Revenue (USD Million) By Type (2021-2032)
Table 18 North America Dairy Alternative Beverages Revenue (USD Million) By Application (2021-2032)
Table 19 North America Dairy Alternative Beverages Revenue (USD Million) By Product (2021-2032)
Table 20 Europe Dairy Alternative Beverages Revenue (USD Million) By Type (2021-2032)
Table 21 Europe Dairy Alternative Beverages Revenue (USD Million) By Application (2021-2032)
Table 22 Europe Dairy Alternative Beverages Revenue (USD Million) By Product (2021-2032)
Table 23 Asia Pacific Dairy Alternative Beverages Revenue (USD Million) By Type (2021-2032)
Table 24 Asia Pacific Dairy Alternative Beverages Revenue (USD Million) By Application (2021-2032)
Table 25 Asia Pacific Dairy Alternative Beverages Revenue (USD Million) By Product (2021-2032)
Table 26 South America Dairy Alternative Beverages Revenue (USD Million) By Type (2021-2032)
Table 27 South America Dairy Alternative Beverages Revenue (USD Million) By Application (2021-2032)
Table 28 South America Dairy Alternative Beverages Revenue (USD Million) By Product (2021-2032)
Table 29 Middle East and Africa Dairy Alternative Beverages Revenue (USD Million) By Type (2021-2032)
Table 30 Middle East and Africa Dairy Alternative Beverages Revenue (USD Million) By Application (2021-2032)
Table 31 Middle East and Africa Dairy Alternative Beverages Revenue (USD Million) By Product (2021-2032)
LIST OF FIGURES
Figure 1. Market Scope
Figure 2. Pricing Forecasts Per Unit, 2023- 2032
Figure 3. Porter’s Five Forces
Figure 4. Global Dairy Alternative Beverages Market Revenue (USD Million) By Regions (2021-2032)
Figure 5. Global Dairy Alternative Beverages Market Share (%) By Regions (2023)
Figure 6. North America Dairy Alternative Beverages Revenue (USD Million) By Country (2021-2032)
Figure 7. United States Dairy Alternative Beverages Revenue (USD Million) By Country (2021-2032)
Figure 8. Canada Dairy Alternative Beverages Revenue (USD Million) By Country (2021-2032)
Figure 9. Mexico Dairy Alternative Beverages Revenue (USD Million) By Country (2021-2032)
Figure 10. Europe Dairy Alternative Beverages Revenue (USD Million) By Country (2021-2032)
Figure 11. Germany Dairy Alternative Beverages Revenue (USD Million) By Country (2021-2032)
Figure 12. France Dairy Alternative Beverages Revenue (USD Million) By Country (2021-2032)
Figure 13. United Kingdom Dairy Alternative Beverages Revenue (USD Million) By Country (2021-2032)
Figure 14. Spain Dairy Alternative Beverages Revenue (USD Million) By Country (2021-2032)
Figure 15. Italy Dairy Alternative Beverages Revenue (USD Million) By Country (2021-2032)
Figure 16. Russia Dairy Alternative Beverages Revenue (USD Million) By Country (2021-2032)
Figure 17. Rest of Europe Dairy Alternative Beverages Revenue (USD Million) By Country (2021-2032)
Figure 11. Asia Pacific Dairy Alternative Beverages Revenue (USD Million) By Country (2021-2032)
Figure 12. China Dairy Alternative Beverages Revenue (USD Million) By Country (2021-2032)
Figure 13. Japan Dairy Alternative Beverages Revenue (USD Million) By Country (2021-2032)
Figure 14. India Dairy Alternative Beverages Revenue (USD Million) By Country (2021-2032)
Figure 15. South Korea Dairy Alternative Beverages Revenue (USD Million) By Country (2021-2032)
Figure 16. Australia Dairy Alternative Beverages Revenue (USD Million) By Country (2021-2032)
Figure 17. South East Asia Dairy Alternative Beverages Revenue (USD Million) By Country (2021-2032)
Figure 18. South America Dairy Alternative Beverages Revenue (USD Million) By Country (2021-2032)
Figure 19. Brazil Dairy Alternative Beverages Revenue (USD Million) By Country (2021-2032)
Figure 20. Argentina Dairy Alternative Beverages Revenue (USD Million) By Country (2021-2032)
Figure 21. Rest of Asia Pacific Dairy Alternative Beverages Revenue (USD Million) By Country (2021-2032)
Figure 22. Middle East and Africa Dairy Alternative Beverages Revenue (USD Million) By Region (2021-2032)
Figure 23. Saudi Arabia Dairy Alternative Beverages Revenue (USD Million) By Region (2021-2032)
Figure 24. The UAE Dairy Alternative Beverages Revenue (USD Million) By Region (2021-2032)
Figure 25. Rest of Middle East Dairy Alternative Beverages Revenue (USD Million) By Region (2021-2032)
Figure 26. South Africa Dairy Alternative Beverages Revenue (USD Million) By Region (2021-2032)
Figure 27. Africa Dairy Alternative Beverages Revenue (USD Million) By Region (2021-2032)
Figure 28. North America Dairy Alternative Beverages Revenue (USD Million) By Type (2021-2032)
Figure 29. North America Dairy Alternative Beverages Revenue (USD Million) By Application (2021-2032)
Figure 30. North America Dairy Alternative Beverages Revenue (USD Million) By Product (2021-2032)
Figure 31. Europe Dairy Alternative Beverages Revenue (USD Million) By Type (2021-2032)
Figure 32. Europe Dairy Alternative Beverages Revenue (USD Million) By Application (2021-2032)
Figure 33. Europe Dairy Alternative Beverages Revenue (USD Million) By Product (2021-2032)
Figure 34. Asia Pacific Dairy Alternative Beverages Revenue (USD Million) By Type (2021-2032)
Figure 35. Asia Pacific Dairy Alternative Beverages Revenue (USD Million) By Application (2021-2032)
Figure 36. Asia Pacific Dairy Alternative Beverages Revenue (USD Million) By Product (2021-2032)
Figure 37. South America Dairy Alternative Beverages Revenue (USD Million) By Type (2021-2032)
Figure 38. South America Dairy Alternative Beverages Revenue (USD Million) By Application (2021-2032)
Figure 39. South America Dairy Alternative Beverages Revenue (USD Million) By Product (2021-2032)
Figure 40. Middle East and Africa Dairy Alternative Beverages Revenue (USD Million) By Type (2021-2032)
Figure 41. Middle East and Africa Dairy Alternative Beverages Revenue (USD Million) By Application (2021-2032)
Figure 42. Middle East and Africa Dairy Alternative Beverages Revenue (USD Million) By Product (2021-2032)
By Variety
Almond Milk
Soy Milk
Oats Milk
Coconut Milk
Cashew Milk
Others
By Type
Unflavored
Flavored
By Form
Powder
Liquid
By Application
Ice Creams
Desserts
Cheese
Yoghurt
Others
By Distribution Channel
Supermarkets/Hypermarkets
Specialty Stores
Grocery Stores
Online
Others
Countries Analyzed
North America (US, Canada, Mexico)
Europe (Germany, UK, France, Spain, Italy, Russia, Rest of Europe)
Asia Pacific (China, India, Japan, South Korea, Australia, South East Asia, Rest of Asia)
South America (Brazil, Argentina, Rest of South America)
Middle East and Africa (Saudi Arabia, UAE, Rest of Middle East, South Africa, Egypt, Rest of Africa)
