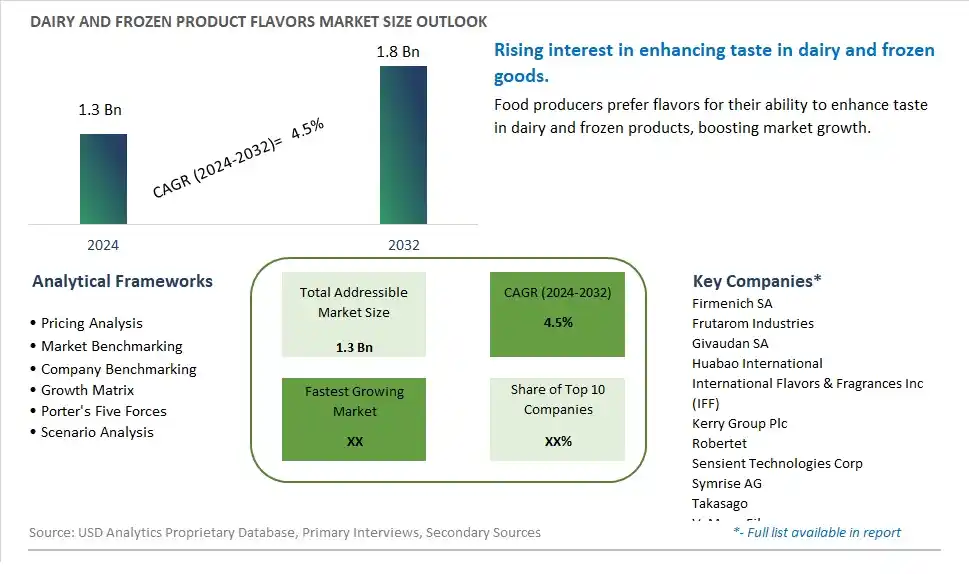
Global Dairy and Frozen Product Flavors Market Size is valued at $1.3 Billion in 2024 and is forecast to register a growth rate (CAGR) of 4.5% to reach $1.8 Billion by 2032.
The global Dairy and Frozen Product Flavors Market Comprehensive Study analyzes and forecasts the market size across 6 regions and 24 countries for diverse segments -By Type (Natural, Artificial), By Application (Dairy Products, Meat, Bakery & Confectionery, Others)
An Introduction to Dairy and Frozen Product Flavors Market
The Dairy and Frozen Product Flavors market in 2024 is expanding rapidly, driven by the increasing demand for innovative and high-quality flavor solutions in the dairy and frozen food industries. Dairy and frozen product flavors, including natural and artificial flavorings, are used to enhance the taste and appeal of products such as ice creams, yogurts, and frozen desserts. The market is supported by the growing trend towards premium and artisanal flavors. Advances in flavor formulation and delivery technologies are enhancing the quality, stability, and sensory profile of dairy and frozen product flavors. The market is also benefiting from the trend towards clean-label and natural flavorings, appealing to manufacturers and consumers seeking high-quality and flavorful dairy and frozen products.
Dairy and Frozen Product Flavors Competitive Landscape
The market report analyses the leading companies in the industry including Firmenich SA, Frutarom Industries, Givaudan SA, Huabao International, International Flavors & Fragrances Inc (IFF), Kerry Group Plc, Robertet, Sensient Technologies Corp, Symrise AG, Takasago, V. Mane Fils, and Others.
Dairy and Frozen Product Flavors Market Dynamics
Dairy and Frozen Product Flavors Market Trend: Diversification and Innovation in Dairy and Frozen Product Flavors
One prominent market trend in the dairy and frozen product flavors market is the diversification and innovation in flavors. Consumers are seeking unique and exciting flavor experiences in dairy products, ice creams, frozen desserts, and other frozen treats. This trend is driven by the desire for variety, novelty, and indulgence in flavor profiles, leading to a continuous exploration and development of new flavor options in the market.
Dairy and Frozen Product Flavors Market Driver: Consumer Preferences and Taste Exploration
A significant market driver for dairy and frozen product flavors is consumer preferences and taste exploration. As consumers become more adventurous in their culinary choices and seek new sensory experiences, there is a demand for flavors that stand out and provide a memorable taste sensation. Manufacturers are driven to create innovative flavor combinations, limited edition flavors, and seasonal offerings to capture consumer interest and drive sales.
Dairy and Frozen Product Flavors Market Opportunity: Customization and Personalization of Flavor Profiles
An exciting potential opportunity in the dairy and frozen product flavors market lies in customization and personalization of flavor profiles. Manufacturers can capitalize on this opportunity by offering customizable flavor options, allowing consumers to create their unique flavor blends or tailor existing flavors to their preferences. Additionally, personalized flavor experiences, such as flavor kits, DIY toppings, and flavor-mixing stations, can enhance consumer engagement, promote brand loyalty, and differentiate products in a competitive market landscape.
Dairy and Frozen Product Flavors Market Share Analysis: Natural segment generated the highest revenue share in the industry
The Natural segment is the largest in the Dairy and Frozen Product Flavors Market. This dominance is driven by the growing consumer preference for clean-label products and ingredients derived from natural sources. Natural flavors are perceived as healthier and safer compared to artificial flavors, which often contain synthetic chemicals. The rising awareness about the health benefits of natural ingredients and the increasing incidence of food-related allergies and sensitivities have further propelled the demand for natural flavors. Additionally, regulatory bodies across the globe are encouraging the use of natural ingredients by imposing stricter regulations on artificial additives. As a result, manufacturers are increasingly incorporating natural flavors in their products to meet consumer demand and comply with regulations, solidifying the position of the natural segment as the largest in the market.
Dairy and Frozen Product Flavors Market Share Analysis: Dairy Products segment generated the highest revenue share in the industry
The Dairy Products segment is expected to be the fastest-growing in the Dairy and Frozen Product Flavors Market by 2032. This growth is primarily fueled by the increasing consumption of flavored dairy products such as yogurt, ice cream, and flavored milk. Consumers are increasingly seeking variety and unique taste experiences in their dairy products, driving manufacturers to innovate with new and exotic flavors. Additionally, the trend towards functional and fortified dairy products, which often incorporate natural flavors to enhance taste and appeal, is contributing to this segment's rapid growth. The health and wellness trend is also playing a significant role, as consumers opt for flavored dairy products that offer both nutritional benefits and delightful taste. With continuous product innovation and expanding consumer preferences for flavored dairy options, the Dairy Products segment is poised to see significant growth in the coming years.
Dairy and Frozen Product Flavors Market Segmentation
By Type
Natural
Artificial
By Application
Dairy Products
Meat
Bakery & Confectionery
Others
Countries Analyzed
North America (US, Canada, Mexico)
Europe (Germany, UK, France, Spain, Italy, Russia, Rest of Europe)
Asia Pacific (China, India, Japan, South Korea, Australia, South East Asia, Rest of Asia)
South America (Brazil, Argentina, Rest of South America)
Middle East and Africa (Saudi Arabia, UAE, Rest of Middle East, South Africa, Egypt, Rest of Africa)
Dairy and Frozen Product Flavors Companies Profiled in the Study
Firmenich SA
Frutarom Industries
Givaudan SA
Huabao International
International Flavors & Fragrances Inc (IFF)
Kerry Group Plc
Robertet
Sensient Technologies Corp
Symrise AG
Takasago
V. Mane Fils
*- List Not Exhaustive
Chapter 1. TABLE OF CONTENTS
Chapter 2. Introduction to Dairy and Frozen Product Flavors Market
2.1. Market Overview
2.2. Key Statistics and Report Highlights
2.3. Scope of the Comprehensive Study
2.3.1. Market Definition
2.3.2 Countries and Regions Covered
2.3.3 Research Objective
2.3.4 Units, Currency, and Conversions
2.3.5 Industry Value Chain
2.4. Key Market Segments
2.5. Key Companies
2.6. Study Period
Chapter 3. Strategic Analysis Review
3.1. Dairy and Frozen Product Flavors Pricing Analysis and Forecast
3.2. Porter’s Five Forces
3.3. Market Ecosystem
3.4. SWOT Analysis
3.5. Regulatory Scenario
3.3. Effects of Inflation, Russia-Ukraine War, moderating economic growth, and other macroeconomic factors
Chapter 4. Competitive Landscape
4.1. Market Share Analysis
4.1.1. Global Dairy and Frozen Product Flavors Market Share by Company, 2023
4.1.2. Product Offerings of Leading Dairy and Frozen Product Flavors Companies
4.2. Market Entropy
4.2.1. New Product Launches in the Industry
4.2.2. Mergers, Acquisitions, Joint ventures, and Partnerships
4.3. Key Strategies and Best Practices
Chapter 5. Global Market Projections: Best, Reference, and Low Case Scenarios
5.1. Growth Analysis- Case Scenario Definitions
5.2. Low Growth Case Scenario Forecasts
5.3. Reference Growth Case Scenario Forecasts
5.4. High Growth Case Scenario Forecasts
Chapter 6. Market Dynamics
6.1. Dairy and Frozen Product Flavors Market Drivers
6.2. Dairy and Frozen Product Flavors Market Challenges
6.6. Dairy and Frozen Product Flavors Market Opportunities
6.4. Dairy and Frozen Product Flavors Market Trends
Chapter 7. Global Dairy and Frozen Product Flavors Market Outlook Trends
7.1. Global Dairy and Frozen Product Flavors Revenue (USD Million) and CAGR (%) by Type (2021-2032)
7.2. Global Dairy and Frozen Product Flavors Revenue (USD Million) and CAGR (%) by Application (2021-2032)
7.3. Global Dairy and Frozen Product Flavors Revenue (USD Million) and CAGR (%) by Product (2021-2032)
By Type
Natural
Artificial
By Application
Dairy Products
Meat
Bakery & Confectionery
Others
Chapter 8. Global Dairy and Frozen Product Flavors Regional Analysis and Outlook
8.1. Global Dairy and Frozen Product Flavors Revenue (USD Million) By Regions (2021- 2032)
8.2. North America Dairy and Frozen Product Flavors Revenue (USD Million) by Country (2021-2032)
8.2.1. United States Dairy and Frozen Product Flavors Regional Analysis and Outlook
8.2.2. Canada Dairy and Frozen Product Flavors Regional Analysis and Outlook
8.2.3. Mexico Dairy and Frozen Product Flavors Regional Analysis and Outlook
8.3. Europe Dairy and Frozen Product Flavors Revenue (USD Million), by Country (2021-2032)
8.3.1. Germany Dairy and Frozen Product Flavors Regional Analysis and Outlook
8.3.2. France Dairy and Frozen Product Flavors Regional Analysis and Outlook
8.3.3. United Kingdom Dairy and Frozen Product Flavors Regional Analysis and Outlook
8.3.4. Spain Dairy and Frozen Product Flavors Regional Analysis and Outlook
8.3.5. Italy Dairy and Frozen Product Flavors Regional Analysis and Outlook
8.3.6. Russia Dairy and Frozen Product Flavors Regional Analysis and Outlook
8.3.7. Rest of Europe Dairy and Frozen Product Flavors Regional Analysis and Outlook
8.4. Asia Pacific Dairy and Frozen Product Flavors Revenue (USD Million) by Country (2021-2032)
8.4.1. China Dairy and Frozen Product Flavors Regional Analysis and Outlook
8.4.2. Japan Dairy and Frozen Product Flavors Regional Analysis and Outlook
8.4.3. India Dairy and Frozen Product Flavors Regional Analysis and Outlook
8.4.4. South Korea Dairy and Frozen Product Flavors Regional Analysis and Outlook
8.4.5. Australia Dairy and Frozen Product Flavors Regional Analysis and Outlook
8.4.6. South East Asia Dairy and Frozen Product Flavors Regional Analysis and Outlook
8.4.7. Rest of Asia Pacific Dairy and Frozen Product Flavors Regional Analysis and Outlook
8.5. South America Dairy and Frozen Product Flavors Revenue (USD Million), by Country (2021-2032)
8.5.1. Brazil Dairy and Frozen Product Flavors Regional Analysis and Outlook
8.5.2. Argentina Dairy and Frozen Product Flavors Regional Analysis and Outlook
8.5.3. Rest of South America Dairy and Frozen Product Flavors Regional Analysis and Outlook
8.6. Middle East and Africa Dairy and Frozen Product Flavors Revenue (USD Million) by Country (2021-2032)
8.6.1. Middle East Dairy and Frozen Product Flavors Regional Analysis and Outlook
8.6.2. Africa Dairy and Frozen Product Flavors Regional Analysis and Outlook
Chapter 9. North America Dairy and Frozen Product Flavors Analysis and Outlook
9.1. North America Dairy and Frozen Product Flavors Revenue (USD Million) by Segments (2021-2032)
9.1.1. North America Dairy and Frozen Product Flavors Revenue (USD Million) by Type (2021-2032)
9.1.2. North America Dairy and Frozen Product Flavors Revenue (USD Million) by Application (2021-2032)
9.1.3. North America Dairy and Frozen Product Flavors Revenue (USD Million) by Product (2021-2032)
By Type
Natural
Artificial
By Application
Dairy Products
Meat
Bakery & Confectionery
Others
Chapter 10. Europe Dairy and Frozen Product Flavors Analysis and Outlook
10.1. Europe Dairy and Frozen Product Flavors Revenue (USD Million), by Segments (USD Million) (2021-2032)
10.1.1. Europe Dairy and Frozen Product Flavors Revenue (USD Million) by Type (2021-2032)
10.1.2. Europe Dairy and Frozen Product Flavors Revenue (USD Million) by Application (2021-2032)
10.1.3. Europe Dairy and Frozen Product Flavors Revenue (USD Million) by Product (2021-2032)
By Type
Natural
Artificial
By Application
Dairy Products
Meat
Bakery & Confectionery
Others
Chapter 11. Asia Pacific Dairy and Frozen Product Flavors Analysis and Outlook
11.1. Asia Pacific Dairy and Frozen Product Flavors Revenue (USD Million), and Revenue (USD Million) by Segments (2021-2032)
11.1.1. Asia Pacific Dairy and Frozen Product Flavors Revenue (USD Million) by Type (2021-2032)
11.1.2. Asia Pacific Dairy and Frozen Product Flavors Revenue (USD Million) by Application (2021-2032)
11.1.3. Asia Pacific Dairy and Frozen Product Flavors Revenue (USD Million) by Product (2021-2032)
By Type
Natural
Artificial
By Application
Dairy Products
Meat
Bakery & Confectionery
Others
Chapter 12. South America Dairy and Frozen Product Flavors Analysis and Outlook
12.1. South America Dairy and Frozen Product Flavors Revenue (USD Million), by Segments (2021-2032)
12.1.1. South America Dairy and Frozen Product Flavors Revenue (USD Million) by Type (2021-2032)
12.1.2. South America Dairy and Frozen Product Flavors Revenue (USD Million) by Application (2021-2032)
12.1.3. South America Dairy and Frozen Product Flavors Revenue (USD Million) by Product (2021-2032)
By Type
Natural
Artificial
By Application
Dairy Products
Meat
Bakery & Confectionery
Others
Chapter 13. Middle East and Africa Dairy and Frozen Product Flavors Analysis and Outlook
13.1. Middle East and Africa Dairy and Frozen Product Flavors Revenue (USD Million), by Segments (2021-2032)
13.1.1. Middle East and Africa Dairy and Frozen Product Flavors Revenue (USD Million) by Type (2021-2032)
13.1.2. Middle East and Africa Dairy and Frozen Product Flavors Revenue (USD Million) by Application (2021-2032)
13.1.3. Middle East and Africa Dairy and Frozen Product Flavors Revenue (USD Million) by Product (2021-2032)
By Type
Natural
Artificial
By Application
Dairy Products
Meat
Bakery & Confectionery
Others
Chapter 14. Dairy and Frozen Product Flavors Company Profiles
14.1 Business Overview
14.2 Product Profiles
14.3 SWOT Profiles
14.5 Recent Developments
14.6 Financial Profile
List of Companies
Firmenich SA
Frutarom Industries
Givaudan SA
Huabao International
International Flavors & Fragrances Inc (IFF)
Kerry Group Plc
Robertet
Sensient Technologies Corp
Symrise AG
Takasago
V. Mane Fils
15. Methodology and Data Sources
15.1 Customization Offerings
15.2 Subscription Services
15.3 Related Reports
15.4 Publisher Expertise
LIST OF TABLES
Table 1 Market Segmentation Analysis
Table 2 Global Dairy and Frozen Product Flavors Market Share of Leading Companies, 2023
Table 3 Product Offerings of Leading Companies
Table 4 Low Growth Scenario Forecasts
Table 5 Reference Case Growth Scenario
Table 6 High Growth Case Scenario
Table 7 Global Dairy and Frozen Product Flavors Revenue (USD Million) And CAGR (%) By Type (2021-2032)
Table 8 Global Dairy and Frozen Product Flavors Revenue (USD Million) And CAGR (%) By Application (2021-2032)
Table 9 Global Dairy and Frozen Product Flavors Revenue (USD Million) And CAGR (%) By Product (2021-2032)
Table 10 Global Dairy and Frozen Product Flavors Market Revenue (USD Million) By Regions (2021-2032)
Table 11 Global Dairy and Frozen Product Flavors Market Share (%) By Regions (2021-2032)
Table 12 North America Dairy and Frozen Product Flavors Revenue (USD Million) By Country (2021-2032)
Table 13 Europe Dairy and Frozen Product Flavors Revenue (USD Million) By Country (2021-2032)
Table 14 Asia Pacific Dairy and Frozen Product Flavors Revenue (USD Million) By Country (2021-2032)
Table 15 South America Dairy and Frozen Product Flavors Revenue (USD Million) By Country (2021-2032)
Table 16 Middle East and Africa Dairy and Frozen Product Flavors Revenue (USD Million) By Region (2021-2032)
Table 17 North America Dairy and Frozen Product Flavors Revenue (USD Million) By Type (2021-2032)
Table 18 North America Dairy and Frozen Product Flavors Revenue (USD Million) By Application (2021-2032)
Table 19 North America Dairy and Frozen Product Flavors Revenue (USD Million) By Product (2021-2032)
Table 20 Europe Dairy and Frozen Product Flavors Revenue (USD Million) By Type (2021-2032)
Table 21 Europe Dairy and Frozen Product Flavors Revenue (USD Million) By Application (2021-2032)
Table 22 Europe Dairy and Frozen Product Flavors Revenue (USD Million) By Product (2021-2032)
Table 23 Asia Pacific Dairy and Frozen Product Flavors Revenue (USD Million) By Type (2021-2032)
Table 24 Asia Pacific Dairy and Frozen Product Flavors Revenue (USD Million) By Application (2021-2032)
Table 25 Asia Pacific Dairy and Frozen Product Flavors Revenue (USD Million) By Product (2021-2032)
Table 26 South America Dairy and Frozen Product Flavors Revenue (USD Million) By Type (2021-2032)
Table 27 South America Dairy and Frozen Product Flavors Revenue (USD Million) By Application (2021-2032)
Table 28 South America Dairy and Frozen Product Flavors Revenue (USD Million) By Product (2021-2032)
Table 29 Middle East and Africa Dairy and Frozen Product Flavors Revenue (USD Million) By Type (2021-2032)
Table 30 Middle East and Africa Dairy and Frozen Product Flavors Revenue (USD Million) By Application (2021-2032)
Table 31 Middle East and Africa Dairy and Frozen Product Flavors Revenue (USD Million) By Product (2021-2032)
LIST OF FIGURES
Figure 1. Market Scope
Figure 2. Pricing Forecasts Per Unit, 2023- 2032
Figure 3. Porter’s Five Forces
Figure 4. Global Dairy and Frozen Product Flavors Market Revenue (USD Million) By Regions (2021-2032)
Figure 5. Global Dairy and Frozen Product Flavors Market Share (%) By Regions (2023)
Figure 6. North America Dairy and Frozen Product Flavors Revenue (USD Million) By Country (2021-2032)
Figure 7. United States Dairy and Frozen Product Flavors Revenue (USD Million) By Country (2021-2032)
Figure 8. Canada Dairy and Frozen Product Flavors Revenue (USD Million) By Country (2021-2032)
Figure 9. Mexico Dairy and Frozen Product Flavors Revenue (USD Million) By Country (2021-2032)
Figure 10. Europe Dairy and Frozen Product Flavors Revenue (USD Million) By Country (2021-2032)
Figure 11. Germany Dairy and Frozen Product Flavors Revenue (USD Million) By Country (2021-2032)
Figure 12. France Dairy and Frozen Product Flavors Revenue (USD Million) By Country (2021-2032)
Figure 13. United Kingdom Dairy and Frozen Product Flavors Revenue (USD Million) By Country (2021-2032)
Figure 14. Spain Dairy and Frozen Product Flavors Revenue (USD Million) By Country (2021-2032)
Figure 15. Italy Dairy and Frozen Product Flavors Revenue (USD Million) By Country (2021-2032)
Figure 16. Russia Dairy and Frozen Product Flavors Revenue (USD Million) By Country (2021-2032)
Figure 17. Rest of Europe Dairy and Frozen Product Flavors Revenue (USD Million) By Country (2021-2032)
Figure 11. Asia Pacific Dairy and Frozen Product Flavors Revenue (USD Million) By Country (2021-2032)
Figure 12. China Dairy and Frozen Product Flavors Revenue (USD Million) By Country (2021-2032)
Figure 13. Japan Dairy and Frozen Product Flavors Revenue (USD Million) By Country (2021-2032)
Figure 14. India Dairy and Frozen Product Flavors Revenue (USD Million) By Country (2021-2032)
Figure 15. South Korea Dairy and Frozen Product Flavors Revenue (USD Million) By Country (2021-2032)
Figure 16. Australia Dairy and Frozen Product Flavors Revenue (USD Million) By Country (2021-2032)
Figure 17. South East Asia Dairy and Frozen Product Flavors Revenue (USD Million) By Country (2021-2032)
Figure 18. South America Dairy and Frozen Product Flavors Revenue (USD Million) By Country (2021-2032)
Figure 19. Brazil Dairy and Frozen Product Flavors Revenue (USD Million) By Country (2021-2032)
Figure 20. Argentina Dairy and Frozen Product Flavors Revenue (USD Million) By Country (2021-2032)
Figure 21. Rest of Asia Pacific Dairy and Frozen Product Flavors Revenue (USD Million) By Country (2021-2032)
Figure 22. Middle East and Africa Dairy and Frozen Product Flavors Revenue (USD Million) By Region (2021-2032)
Figure 23. Saudi Arabia Dairy and Frozen Product Flavors Revenue (USD Million) By Region (2021-2032)
Figure 24. The UAE Dairy and Frozen Product Flavors Revenue (USD Million) By Region (2021-2032)
Figure 25. Rest of Middle East Dairy and Frozen Product Flavors Revenue (USD Million) By Region (2021-2032)
Figure 26. South Africa Dairy and Frozen Product Flavors Revenue (USD Million) By Region (2021-2032)
Figure 27. Africa Dairy and Frozen Product Flavors Revenue (USD Million) By Region (2021-2032)
Figure 28. North America Dairy and Frozen Product Flavors Revenue (USD Million) By Type (2021-2032)
Figure 29. North America Dairy and Frozen Product Flavors Revenue (USD Million) By Application (2021-2032)
Figure 30. North America Dairy and Frozen Product Flavors Revenue (USD Million) By Product (2021-2032)
Figure 31. Europe Dairy and Frozen Product Flavors Revenue (USD Million) By Type (2021-2032)
Figure 32. Europe Dairy and Frozen Product Flavors Revenue (USD Million) By Application (2021-2032)
Figure 33. Europe Dairy and Frozen Product Flavors Revenue (USD Million) By Product (2021-2032)
Figure 34. Asia Pacific Dairy and Frozen Product Flavors Revenue (USD Million) By Type (2021-2032)
Figure 35. Asia Pacific Dairy and Frozen Product Flavors Revenue (USD Million) By Application (2021-2032)
Figure 36. Asia Pacific Dairy and Frozen Product Flavors Revenue (USD Million) By Product (2021-2032)
Figure 37. South America Dairy and Frozen Product Flavors Revenue (USD Million) By Type (2021-2032)
Figure 38. South America Dairy and Frozen Product Flavors Revenue (USD Million) By Application (2021-2032)
Figure 39. South America Dairy and Frozen Product Flavors Revenue (USD Million) By Product (2021-2032)
Figure 40. Middle East and Africa Dairy and Frozen Product Flavors Revenue (USD Million) By Type (2021-2032)
Figure 41. Middle East and Africa Dairy and Frozen Product Flavors Revenue (USD Million) By Application (2021-2032)
Figure 42. Middle East and Africa Dairy and Frozen Product Flavors Revenue (USD Million) By Product (2021-2032)
By Type
Natural
Artificial
By Application
Dairy Products
Meat
Bakery & Confectionery
Others
Countries Analyzed
North America (US, Canada, Mexico)
Europe (Germany, UK, France, Spain, Italy, Russia, Rest of Europe)
Asia Pacific (China, India, Japan, South Korea, Australia, South East Asia, Rest of Asia)
South America (Brazil, Argentina, Rest of South America)
Middle East and Africa (Saudi Arabia, UAE, Rest of Middle East, South Africa, Egypt, Rest of Africa)
