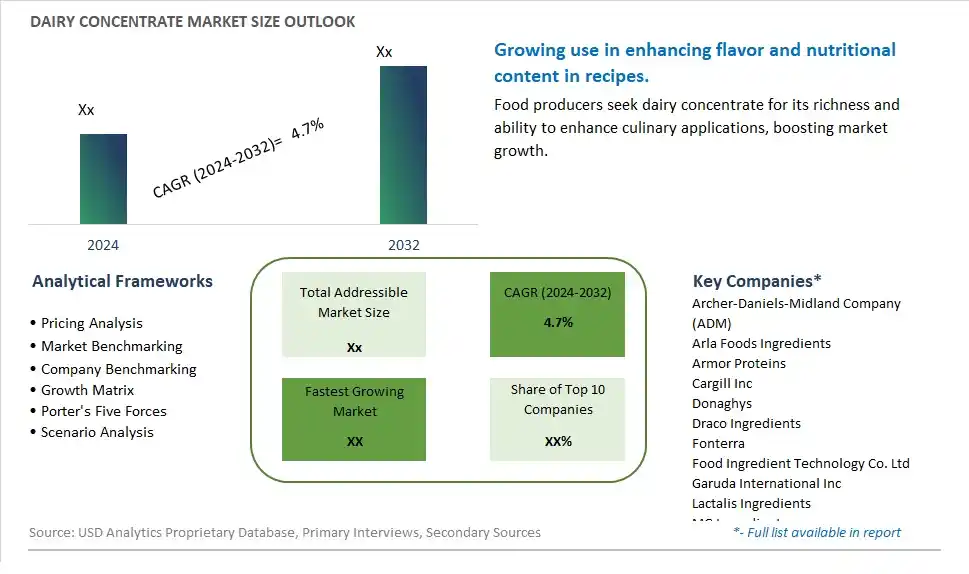
Global Dairy Concentrate Market Size is valued at $XX Million in 2024 and is forecast to register a growth rate (CAGR) of 4.7% to reach $XX Million by 2032.
The global Dairy Concentrate Market Comprehensive Study analyzes and forecasts the market size across 6 regions and 24 countries for diverse segments -By Protein Content (Low, Medium, High), By Concentrate (Compounds, Blends, Straights)
An Introduction to Dairy Concentrate Market
The Dairy Concentrate market in 202
Dairy Concentrate Competitive Landscape
The market report analyses the leading companies in the industry including Archer-Daniels-Midland Company (ADM), Arla Foods Ingredients, Armor Proteins, Cargill Inc, Donaghys, Draco Ingredients, Fonterra, Food Ingredient Technology Co. Ltd, Garuda International Inc, Lactalis Ingredients, MG Ingredients, Ricegrowers Ltd trading, White oak mills, and Others.
Dairy Concentrate Market Dynamics
Dairy Concentrate Market Trend: Growing Demand for Convenience and Shelf Stability
One prominent market trend in the dairy concentrate market is the growing demand for convenience and shelf stability. Consumers and food manufacturers are increasingly seeking dairy concentrates that offer longer shelf life, easy storage, and convenient use in various food and beverage applications. This trend is driven by the need for efficient and cost-effective dairy ingredients that maintain quality and functionality over extended periods.
Dairy Concentrate Market Driver: Expansion of Food Processing Industry
A significant market driver for dairy concentrate products is the expansion of the food processing industry. With the growth of packaged foods, ready-to-drink beverages, bakery products, and dairy-based desserts, there is a rising demand for concentrated dairy ingredients such as milk powders, whey concentrates, and cream concentrates. The demand from food processors and manufacturers for dairy concentrates is driven by their versatility, functionality, and ability to enhance the flavor, texture, and nutritional profile of finished products.
Dairy Concentrate Market Opportunity: Customized Solutions and Specialty Formulations
An exciting potential opportunity in the dairy concentrate market lies in offering customized solutions and specialty formulations. Manufacturers can capitalize on this opportunity by developing tailored dairy concentrates to meet specific customer requirements, such as customized fat content, protein levels, flavor profiles, and functional properties. Additionally, creating specialty formulations such as lactose-free concentrates, organic concentrates, or fortified concentrates with added vitamins and minerals can cater to niche market segments and address evolving consumer preferences for specialized dairy ingredients.
Dairy Concentrate Market Share Analysis: High segment generated the highest revenue share in the industry
The High Protein Content segment is the largest in the Dairy Concentrate Market. This segment's dominance is driven by the increasing consumer demand for high-protein diets, which are essential for muscle building, weight management, and overall health. High-protein dairy concentrates are widely used in various food and beverage applications, including sports nutrition products, functional foods, and meal replacements. The health and wellness trend has significantly contributed to the popularity of high-protein products, as more consumers are aware of the benefits of protein for maintaining a healthy lifestyle. Additionally, the versatility of high-protein dairy concentrates allows them to be incorporated into a variety of formulations, from beverages and snacks to dietary supplements, further expanding their market reach. The robust growth in the fitness and wellness industries also supports the continued demand for high-protein dairy concentrates, ensuring their position as the largest segment in the market.
Dairy Concentrate Market Share Analysis: Blends is the fastest growing segment over the forecast period to 2032
The Blends segment is expected to be the fastest-growing in the Dairy Concentrate Market by 2032. This growth is fueled by the increasing demand for customized and multifunctional dairy ingredients that cater to specific nutritional needs and product formulations. Blends of dairy concentrates offer a unique advantage by combining various protein sources and functional ingredients to achieve desired nutritional profiles and functional properties. This flexibility allows manufacturers to tailor their products to meet the evolving preferences of health-conscious consumers, including those seeking high protein, low sugar, or specific dietary requirements. The rising trend of personalized nutrition and the growing popularity of functional foods and beverages are significant drivers of this segment's rapid growth. Additionally, advancements in food technology and ingredient formulation are enabling the development of innovative dairy concentrate blends that enhance the taste, texture, and nutritional value of end products. As the market continues to evolve, the demand for versatile and high-performance dairy concentrate blends is expected to increase, making it the fastest-growing segment in the coming years.
Dairy Concentrate Market Segmentation
By Protein Content
Low
Medium
High
By Concentrate
Compounds
Blends
Straights
Countries Analyzed
North America (US, Canada, Mexico)
Europe (Germany, UK, France, Spain, Italy, Russia, Rest of Europe)
Asia Pacific (China, India, Japan, South Korea, Australia, South East Asia, Rest of Asia)
South America (Brazil, Argentina, Rest of South America)
Middle East and Africa (Saudi Arabia, UAE, Rest of Middle East, South Africa, Egypt, Rest of Africa)
Dairy Concentrate Companies Profiled in the Study
Archer-Daniels-Midland Company (ADM)
Arla Foods Ingredients
Armor Proteins
Cargill Inc
Donaghys
Draco Ingredients
Fonterra
Food Ingredient Technology Co. Ltd
Garuda International Inc
Lactalis Ingredients
MG Ingredients
Ricegrowers Ltd trading
White oak mills
*- List Not Exhaustive
Chapter 1. TABLE OF CONTENTS
Chapter 2. Introduction to Dairy Concentrate Market
2.1. Market Overview
2.2. Key Statistics and Report Highlights
2.3. Scope of the Comprehensive Study
2.3.1. Market Definition
2.3.2 Countries and Regions Covered
2.3.3 Research Objective
2.3.4 Units, Currency, and Conversions
2.3.5 Industry Value Chain
2.4. Key Market Segments
2.5. Key Companies
2.6. Study Period
Chapter 3. Strategic Analysis Review
3.1. Dairy Concentrate Pricing Analysis and Forecast
3.2. Porter’s Five Forces
3.3. Market Ecosystem
3.4. SWOT Analysis
3.5. Regulatory Scenario
3.3. Effects of Inflation, Russia-Ukraine War, moderating economic growth, and other macroeconomic factors
Chapter 4. Competitive Landscape
4.1. Market Share Analysis
4.1.1. Global Dairy Concentrate Market Share by Company, 2023
4.1.2. Product Offerings of Leading Dairy Concentrate Companies
4.2. Market Entropy
4.2.1. New Product Launches in the Industry
4.2.2. Mergers, Acquisitions, Joint ventures, and Partnerships
4.3. Key Strategies and Best Practices
Chapter 5. Global Market Projections: Best, Reference, and Low Case Scenarios
5.1. Growth Analysis- Case Scenario Definitions
5.2. Low Growth Case Scenario Forecasts
5.3. Reference Growth Case Scenario Forecasts
5.4. High Growth Case Scenario Forecasts
Chapter 6. Market Dynamics
6.1. Dairy Concentrate Market Drivers
6.2. Dairy Concentrate Market Challenges
6.6. Dairy Concentrate Market Opportunities
6.4. Dairy Concentrate Market Trends
Chapter 7. Global Dairy Concentrate Market Outlook Trends
7.1. Global Dairy Concentrate Revenue (USD Million) and CAGR (%) by Type (2021-2032)
7.2. Global Dairy Concentrate Revenue (USD Million) and CAGR (%) by Application (2021-2032)
7.3. Global Dairy Concentrate Revenue (USD Million) and CAGR (%) by Product (2021-2032)
By Protein Content
Low
Medium
High
By Concentrate
Compounds
Blends
Straights
Chapter 8. Global Dairy Concentrate Regional Analysis and Outlook
8.1. Global Dairy Concentrate Revenue (USD Million) By Regions (2021- 2032)
8.2. North America Dairy Concentrate Revenue (USD Million) by Country (2021-2032)
8.2.1. United States Dairy Concentrate Regional Analysis and Outlook
8.2.2. Canada Dairy Concentrate Regional Analysis and Outlook
8.2.3. Mexico Dairy Concentrate Regional Analysis and Outlook
8.3. Europe Dairy Concentrate Revenue (USD Million), by Country (2021-2032)
8.3.1. Germany Dairy Concentrate Regional Analysis and Outlook
8.3.2. France Dairy Concentrate Regional Analysis and Outlook
8.3.3. United Kingdom Dairy Concentrate Regional Analysis and Outlook
8.3.4. Spain Dairy Concentrate Regional Analysis and Outlook
8.3.5. Italy Dairy Concentrate Regional Analysis and Outlook
8.3.6. Russia Dairy Concentrate Regional Analysis and Outlook
8.3.7. Rest of Europe Dairy Concentrate Regional Analysis and Outlook
8.4. Asia Pacific Dairy Concentrate Revenue (USD Million) by Country (2021-2032)
8.4.1. China Dairy Concentrate Regional Analysis and Outlook
8.4.2. Japan Dairy Concentrate Regional Analysis and Outlook
8.4.3. India Dairy Concentrate Regional Analysis and Outlook
8.4.4. South Korea Dairy Concentrate Regional Analysis and Outlook
8.4.5. Australia Dairy Concentrate Regional Analysis and Outlook
8.4.6. South East Asia Dairy Concentrate Regional Analysis and Outlook
8.4.7. Rest of Asia Pacific Dairy Concentrate Regional Analysis and Outlook
8.5. South America Dairy Concentrate Revenue (USD Million), by Country (2021-2032)
8.5.1. Brazil Dairy Concentrate Regional Analysis and Outlook
8.5.2. Argentina Dairy Concentrate Regional Analysis and Outlook
8.5.3. Rest of South America Dairy Concentrate Regional Analysis and Outlook
8.6. Middle East and Africa Dairy Concentrate Revenue (USD Million) by Country (2021-2032)
8.6.1. Middle East Dairy Concentrate Regional Analysis and Outlook
8.6.2. Africa Dairy Concentrate Regional Analysis and Outlook
Chapter 9. North America Dairy Concentrate Analysis and Outlook
9.1. North America Dairy Concentrate Revenue (USD Million) by Segments (2021-2032)
9.1.1. North America Dairy Concentrate Revenue (USD Million) by Type (2021-2032)
9.1.2. North America Dairy Concentrate Revenue (USD Million) by Application (2021-2032)
9.1.3. North America Dairy Concentrate Revenue (USD Million) by Product (2021-2032)
By Protein Content
Low
Medium
High
By Concentrate
Compounds
Blends
Straights
Chapter 10. Europe Dairy Concentrate Analysis and Outlook
10.1. Europe Dairy Concentrate Revenue (USD Million), by Segments (USD Million) (2021-2032)
10.1.1. Europe Dairy Concentrate Revenue (USD Million) by Type (2021-2032)
10.1.2. Europe Dairy Concentrate Revenue (USD Million) by Application (2021-2032)
10.1.3. Europe Dairy Concentrate Revenue (USD Million) by Product (2021-2032)
By Protein Content
Low
Medium
High
By Concentrate
Compounds
Blends
Straights
Chapter 11. Asia Pacific Dairy Concentrate Analysis and Outlook
11.1. Asia Pacific Dairy Concentrate Revenue (USD Million), and Revenue (USD Million) by Segments (2021-2032)
11.1.1. Asia Pacific Dairy Concentrate Revenue (USD Million) by Type (2021-2032)
11.1.2. Asia Pacific Dairy Concentrate Revenue (USD Million) by Application (2021-2032)
11.1.3. Asia Pacific Dairy Concentrate Revenue (USD Million) by Product (2021-2032)
By Protein Content
Low
Medium
High
By Concentrate
Compounds
Blends
Straights
Chapter 12. South America Dairy Concentrate Analysis and Outlook
12.1. South America Dairy Concentrate Revenue (USD Million), by Segments (2021-2032)
12.1.1. South America Dairy Concentrate Revenue (USD Million) by Type (2021-2032)
12.1.2. South America Dairy Concentrate Revenue (USD Million) by Application (2021-2032)
12.1.3. South America Dairy Concentrate Revenue (USD Million) by Product (2021-2032)
By Protein Content
Low
Medium
High
By Concentrate
Compounds
Blends
Straights
Chapter 13. Middle East and Africa Dairy Concentrate Analysis and Outlook
13.1. Middle East and Africa Dairy Concentrate Revenue (USD Million), by Segments (2021-2032)
13.1.1. Middle East and Africa Dairy Concentrate Revenue (USD Million) by Type (2021-2032)
13.1.2. Middle East and Africa Dairy Concentrate Revenue (USD Million) by Application (2021-2032)
13.1.3. Middle East and Africa Dairy Concentrate Revenue (USD Million) by Product (2021-2032)
By Protein Content
Low
Medium
High
By Concentrate
Compounds
Blends
Straights
Chapter 14. Dairy Concentrate Company Profiles
14.1 Business Overview
14.2 Product Profiles
14.3 SWOT Profiles
14.5 Recent Developments
14.6 Financial Profile
List of Companies
Archer-Daniels-Midland Company (ADM)
Arla Foods Ingredients
Armor Proteins
Cargill Inc
Donaghys
Draco Ingredients
Fonterra
Food Ingredient Technology Co. Ltd
Garuda International Inc
Lactalis Ingredients
MG Ingredients
Ricegrowers Ltd trading
White oak mills
15. Methodology and Data Sources
15.1 Customization Offerings
15.2 Subscription Services
15.3 Related Reports
15.4 Publisher Expertise
LIST OF TABLES
Table 1 Market Segmentation Analysis
Table 2 Global Dairy Concentrate Market Share of Leading Companies, 2023
Table 3 Product Offerings of Leading Companies
Table 4 Low Growth Scenario Forecasts
Table 5 Reference Case Growth Scenario
Table 6 High Growth Case Scenario
Table 7 Global Dairy Concentrate Revenue (USD Million) And CAGR (%) By Type (2021-2032)
Table 8 Global Dairy Concentrate Revenue (USD Million) And CAGR (%) By Application (2021-2032)
Table 9 Global Dairy Concentrate Revenue (USD Million) And CAGR (%) By Product (2021-2032)
Table 10 Global Dairy Concentrate Market Revenue (USD Million) By Regions (2021-2032)
Table 11 Global Dairy Concentrate Market Share (%) By Regions (2021-2032)
Table 12 North America Dairy Concentrate Revenue (USD Million) By Country (2021-2032)
Table 13 Europe Dairy Concentrate Revenue (USD Million) By Country (2021-2032)
Table 14 Asia Pacific Dairy Concentrate Revenue (USD Million) By Country (2021-2032)
Table 15 South America Dairy Concentrate Revenue (USD Million) By Country (2021-2032)
Table 16 Middle East and Africa Dairy Concentrate Revenue (USD Million) By Region (2021-2032)
Table 17 North America Dairy Concentrate Revenue (USD Million) By Type (2021-2032)
Table 18 North America Dairy Concentrate Revenue (USD Million) By Application (2021-2032)
Table 19 North America Dairy Concentrate Revenue (USD Million) By Product (2021-2032)
Table 20 Europe Dairy Concentrate Revenue (USD Million) By Type (2021-2032)
Table 21 Europe Dairy Concentrate Revenue (USD Million) By Application (2021-2032)
Table 22 Europe Dairy Concentrate Revenue (USD Million) By Product (2021-2032)
Table 23 Asia Pacific Dairy Concentrate Revenue (USD Million) By Type (2021-2032)
Table 24 Asia Pacific Dairy Concentrate Revenue (USD Million) By Application (2021-2032)
Table 25 Asia Pacific Dairy Concentrate Revenue (USD Million) By Product (2021-2032)
Table 26 South America Dairy Concentrate Revenue (USD Million) By Type (2021-2032)
Table 27 South America Dairy Concentrate Revenue (USD Million) By Application (2021-2032)
Table 28 South America Dairy Concentrate Revenue (USD Million) By Product (2021-2032)
Table 29 Middle East and Africa Dairy Concentrate Revenue (USD Million) By Type (2021-2032)
Table 30 Middle East and Africa Dairy Concentrate Revenue (USD Million) By Application (2021-2032)
Table 31 Middle East and Africa Dairy Concentrate Revenue (USD Million) By Product (2021-2032)
LIST OF FIGURES
Figure 1. Market Scope
Figure 2. Pricing Forecasts Per Unit, 2023- 2032
Figure 3. Porter’s Five Forces
Figure 4. Global Dairy Concentrate Market Revenue (USD Million) By Regions (2021-2032)
Figure 5. Global Dairy Concentrate Market Share (%) By Regions (2023)
Figure 6. North America Dairy Concentrate Revenue (USD Million) By Country (2021-2032)
Figure 7. United States Dairy Concentrate Revenue (USD Million) By Country (2021-2032)
Figure 8. Canada Dairy Concentrate Revenue (USD Million) By Country (2021-2032)
Figure 9. Mexico Dairy Concentrate Revenue (USD Million) By Country (2021-2032)
Figure 10. Europe Dairy Concentrate Revenue (USD Million) By Country (2021-2032)
Figure 11. Germany Dairy Concentrate Revenue (USD Million) By Country (2021-2032)
Figure 12. France Dairy Concentrate Revenue (USD Million) By Country (2021-2032)
Figure 13. United Kingdom Dairy Concentrate Revenue (USD Million) By Country (2021-2032)
Figure 14. Spain Dairy Concentrate Revenue (USD Million) By Country (2021-2032)
Figure 15. Italy Dairy Concentrate Revenue (USD Million) By Country (2021-2032)
Figure 16. Russia Dairy Concentrate Revenue (USD Million) By Country (2021-2032)
Figure 17. Rest of Europe Dairy Concentrate Revenue (USD Million) By Country (2021-2032)
Figure 11. Asia Pacific Dairy Concentrate Revenue (USD Million) By Country (2021-2032)
Figure 12. China Dairy Concentrate Revenue (USD Million) By Country (2021-2032)
Figure 13. Japan Dairy Concentrate Revenue (USD Million) By Country (2021-2032)
Figure 14. India Dairy Concentrate Revenue (USD Million) By Country (2021-2032)
Figure 15. South Korea Dairy Concentrate Revenue (USD Million) By Country (2021-2032)
Figure 16. Australia Dairy Concentrate Revenue (USD Million) By Country (2021-2032)
Figure 17. South East Asia Dairy Concentrate Revenue (USD Million) By Country (2021-2032)
Figure 18. South America Dairy Concentrate Revenue (USD Million) By Country (2021-2032)
Figure 19. Brazil Dairy Concentrate Revenue (USD Million) By Country (2021-2032)
Figure 20. Argentina Dairy Concentrate Revenue (USD Million) By Country (2021-2032)
Figure 21. Rest of Asia Pacific Dairy Concentrate Revenue (USD Million) By Country (2021-2032)
Figure 22. Middle East and Africa Dairy Concentrate Revenue (USD Million) By Region (2021-2032)
Figure 23. Saudi Arabia Dairy Concentrate Revenue (USD Million) By Region (2021-2032)
Figure 24. The UAE Dairy Concentrate Revenue (USD Million) By Region (2021-2032)
Figure 25. Rest of Middle East Dairy Concentrate Revenue (USD Million) By Region (2021-2032)
Figure 26. South Africa Dairy Concentrate Revenue (USD Million) By Region (2021-2032)
Figure 27. Africa Dairy Concentrate Revenue (USD Million) By Region (2021-2032)
Figure 28. North America Dairy Concentrate Revenue (USD Million) By Type (2021-2032)
Figure 29. North America Dairy Concentrate Revenue (USD Million) By Application (2021-2032)
Figure 30. North America Dairy Concentrate Revenue (USD Million) By Product (2021-2032)
Figure 31. Europe Dairy Concentrate Revenue (USD Million) By Type (2021-2032)
Figure 32. Europe Dairy Concentrate Revenue (USD Million) By Application (2021-2032)
Figure 33. Europe Dairy Concentrate Revenue (USD Million) By Product (2021-2032)
Figure 34. Asia Pacific Dairy Concentrate Revenue (USD Million) By Type (2021-2032)
Figure 35. Asia Pacific Dairy Concentrate Revenue (USD Million) By Application (2021-2032)
Figure 36. Asia Pacific Dairy Concentrate Revenue (USD Million) By Product (2021-2032)
Figure 37. South America Dairy Concentrate Revenue (USD Million) By Type (2021-2032)
Figure 38. South America Dairy Concentrate Revenue (USD Million) By Application (2021-2032)
Figure 39. South America Dairy Concentrate Revenue (USD Million) By Product (2021-2032)
Figure 40. Middle East and Africa Dairy Concentrate Revenue (USD Million) By Type (2021-2032)
Figure 41. Middle East and Africa Dairy Concentrate Revenue (USD Million) By Application (2021-2032)
Figure 42. Middle East and Africa Dairy Concentrate Revenue (USD Million) By Product (2021-2032)
By Protein Content
Low
Medium
High
By Concentrate
Compounds
Blends
Straights
Countries Analyzed
North America (US, Canada, Mexico)
Europe (Germany, UK, France, Spain, Italy, Russia, Rest of Europe)
Asia Pacific (China, India, Japan, South Korea, Australia, South East Asia, Rest of Asia)
South America (Brazil, Argentina, Rest of South America)
Middle East and Africa (Saudi Arabia, UAE, Rest of Middle East, South Africa, Egypt, Rest of Africa)
