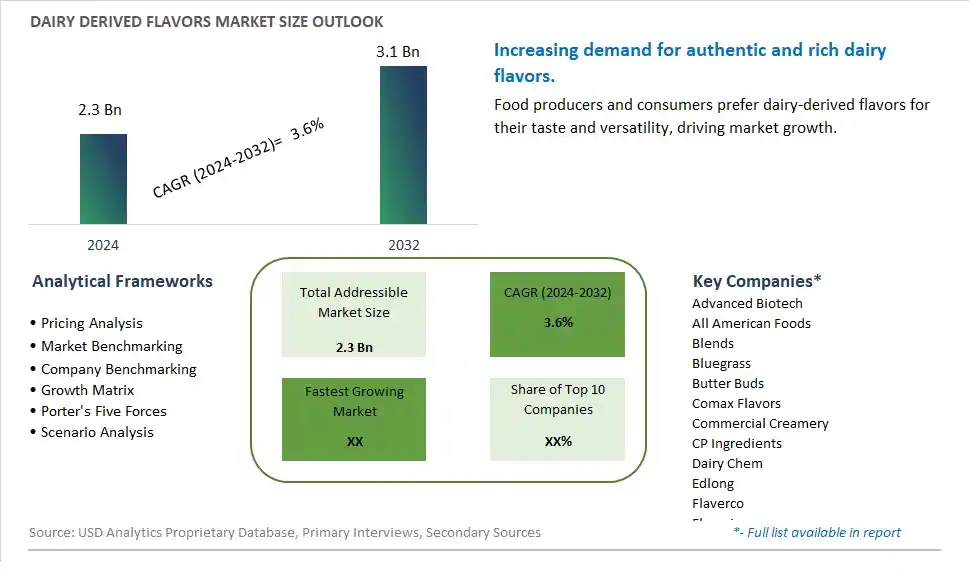
Global Dairy Derived Flavors Market Size is valued at $2.3 Billion in 2024 and is forecast to register a growth rate (CAGR) of 3.6% to reach $3.1 Billion by 2032.
The global Dairy Derived Flavors Market Comprehensive Study analyzes and forecasts the market size across 6 regions and 24 countries for diverse segments -By Type (Cheese, Butter, Cream, Milk, Yogurt, Butter Milk, Others), By Application (Bakery, Confectionery, Beverages, Breakfast Cereals, Others)
An Introduction to Dairy Derived Flavors Market
The Dairy Derived Flavors market in 2024 is expanding rapidly, driven by the increasing demand for authentic and rich flavors in the food and beverage industry. Dairy derived flavors, obtained from milk, butter, cheese, and other dairy products, are used to enhance the taste and aroma of a wide range of products, including snacks, sauces, and baked goods. The market is supported by the growing trend towards premium and artisanal foods. Advances in flavor extraction and formulation technologies are enhancing the quality, intensity, and stability of dairy derived flavors. The market is also benefiting from the trend towards clean-label and natural ingredients, appealing to manufacturers and consumers seeking high-quality and authentic flavor solutions.
Dairy Derived Flavors Competitive Landscape
The market report analyses the leading companies in the industry including Advanced Biotech, All American Foods, Blends, Bluegrass, Butter Buds, Comax Flavors, Commercial Creamery, CP Ingredients, Dairy Chem, Edlong, Flaverco, Flavorjen, FONA, Gamay, Givaudan SA, Glanbia Plc, HL Commodity Foods, Jeneil Biotech, Kerry Group Plc, Ornua Ingredients, Stringer Flavours, Sunspray, Synergy Flavors, Ungerer, and Others.
Dairy Derived Flavors Market Dynamics
Dairy Derived Flavors Market Trend: Growing Demand for Natural and Clean Label Products
The dairy-derived flavors market is experiencing a significant trend towards natural and clean label products. Consumers are increasingly seeking healthier and more authentic food options, leading to a rise in demand for natural flavors derived from dairy sources. This trend is driven by a growing awareness of the health benefits of natural ingredients and a desire for transparency in food labeling. As a result, manufacturers in the dairy-derived flavors market are focusing on developing clean label solutions that meet consumer preferences for natural and sustainable products.
Dairy Derived Flavors Market Driver: Increasing Preference for Dairy-Free Alternatives
One of the key drivers influencing the dairy-derived flavors market is the increasing consumer preference for dairy-free alternatives. With the rise of lactose intolerance, veganism, and dairy-related allergies, there is a growing demand for flavors that replicate the taste and aroma of dairy products without using actual dairy ingredients. This driver has led to innovations in the development of plant-based and non-dairy flavors, providing opportunities for manufacturers to cater to a broader range of dietary preferences and requirements.
Dairy Derived Flavors Market Opportunity: Expansion in Emerging Markets
An exciting opportunity in the dairy-derived flavors market lies in the expansion into emerging markets. As global food preferences evolve, emerging economies are becoming significant contributors to the demand for flavored dairy products. These markets present opportunities for companies to introduce a diverse range of dairy-derived flavors tailored to local tastes and preferences. Additionally, the rising disposable incomes in these regions are fueling the consumption of premium food products, including flavored dairy alternatives, creating a lucrative market opportunity for industry players to expand their presence and capture new customer segments.
Dairy Derived Flavors Market Share Analysis: Cheese segment generated the highest revenue share in the industry
The Cheese segment is the largest in the Dairy Derived Flavors Market. This dominance is driven by the widespread popularity and versatile application of cheese flavors across various food products. Cheese flavors are highly favored in the food industry due to their rich, savory taste and ability to enhance the overall flavor profile of a wide range of products, including snacks, sauces, dressings, and ready-to-eat meals. The strong demand for cheese-flavored products in both the retail and foodservice sectors further solidifies this segment's leading position. Additionally, the increasing consumer preference for gourmet and artisanal flavors, combined with the rising trend of convenience foods, has significantly boosted the usage of cheese flavors. As a result, cheese remains the most prominent and sought-after dairy-derived flavor in the market.
Dairy Derived Flavors Market Share Analysis: Beverages is the fastest growing segment over the forecast period to 2032
The Beverages segment is expected to be the fastest-growing in the Dairy Derived Flavors Market by 2032. This growth is primarily fueled by the increasing innovation and demand for flavored dairy beverages and functional drinks. Dairy-derived flavors are being extensively used in the formulation of a variety of beverages, including flavored milk, smoothies, protein shakes, and specialty coffees. The rising consumer interest in health and wellness has led to the development of beverages that not only offer refreshing taste but also provide nutritional benefits, such as fortified and probiotic drinks. Additionally, the expanding market for plant-based beverages that incorporate dairy-derived flavors to mimic traditional dairy tastes is contributing to this segment's rapid growth. With consumers seeking diverse and convenient beverage options that cater to their health needs and taste preferences, the demand for dairy-derived flavors in the beverage industry is set to experience significant expansion in the coming years.
Dairy Derived Flavors Market Segmentation
By Type
Cheese
Butter
Cream
Milk
Yogurt
Butter Milk
Others
By Application
Bakery
Confectionery
Beverages
Breakfast Cereals
Others
Countries Analyzed
North America (US, Canada, Mexico)
Europe (Germany, UK, France, Spain, Italy, Russia, Rest of Europe)
Asia Pacific (China, India, Japan, South Korea, Australia, South East Asia, Rest of Asia)
South America (Brazil, Argentina, Rest of South America)
Middle East and Africa (Saudi Arabia, UAE, Rest of Middle East, South Africa, Egypt, Rest of Africa)
Dairy Derived Flavors Companies Profiled in the Study
Advanced Biotech
All American Foods
Blends
Bluegrass
Butter Buds
Comax Flavors
Commercial Creamery
CP Ingredients
Dairy Chem
Edlong
Flaverco
Flavorjen
FONA
Gamay
Givaudan SA
Glanbia Plc
HL Commodity Foods
Jeneil Biotech
Kerry Group Plc
Ornua Ingredients
Stringer Flavours
Sunspray
Synergy Flavors
Ungerer
*- List Not Exhaustive
Chapter 1. TABLE OF CONTENTS
Chapter 2. Introduction to Dairy Derived Flavors Market
2.1. Market Overview
2.2. Key Statistics and Report Highlights
2.3. Scope of the Comprehensive Study
2.3.1. Market Definition
2.3.2 Countries and Regions Covered
2.3.3 Research Objective
2.3.4 Units, Currency, and Conversions
2.3.5 Industry Value Chain
2.4. Key Market Segments
2.5. Key Companies
2.6. Study Period
Chapter 3. Strategic Analysis Review
3.1. Dairy Derived Flavors Pricing Analysis and Forecast
3.2. Porter’s Five Forces
3.3. Market Ecosystem
3.4. SWOT Analysis
3.5. Regulatory Scenario
3.3. Effects of Inflation, Russia-Ukraine War, moderating economic growth, and other macroeconomic factors
Chapter 4. Competitive Landscape
4.1. Market Share Analysis
4.1.1. Global Dairy Derived Flavors Market Share by Company, 2023
4.1.2. Product Offerings of Leading Dairy Derived Flavors Companies
4.2. Market Entropy
4.2.1. New Product Launches in the Industry
4.2.2. Mergers, Acquisitions, Joint ventures, and Partnerships
4.3. Key Strategies and Best Practices
Chapter 5. Global Market Projections: Best, Reference, and Low Case Scenarios
5.1. Growth Analysis- Case Scenario Definitions
5.2. Low Growth Case Scenario Forecasts
5.3. Reference Growth Case Scenario Forecasts
5.4. High Growth Case Scenario Forecasts
Chapter 6. Market Dynamics
6.1. Dairy Derived Flavors Market Drivers
6.2. Dairy Derived Flavors Market Challenges
6.6. Dairy Derived Flavors Market Opportunities
6.4. Dairy Derived Flavors Market Trends
Chapter 7. Global Dairy Derived Flavors Market Outlook Trends
7.1. Global Dairy Derived Flavors Revenue (USD Million) and CAGR (%) by Type (2021-2032)
7.2. Global Dairy Derived Flavors Revenue (USD Million) and CAGR (%) by Application (2021-2032)
7.3. Global Dairy Derived Flavors Revenue (USD Million) and CAGR (%) by Product (2021-2032)
By Type
Cheese
Butter
Cream
Milk
Yogurt
Butter Milk
Others
By Application
Bakery
Confectionery
Beverages
Breakfast Cereals
Others
Chapter 8. Global Dairy Derived Flavors Regional Analysis and Outlook
8.1. Global Dairy Derived Flavors Revenue (USD Million) By Regions (2021- 2032)
8.2. North America Dairy Derived Flavors Revenue (USD Million) by Country (2021-2032)
8.2.1. United States Dairy Derived Flavors Regional Analysis and Outlook
8.2.2. Canada Dairy Derived Flavors Regional Analysis and Outlook
8.2.3. Mexico Dairy Derived Flavors Regional Analysis and Outlook
8.3. Europe Dairy Derived Flavors Revenue (USD Million), by Country (2021-2032)
8.3.1. Germany Dairy Derived Flavors Regional Analysis and Outlook
8.3.2. France Dairy Derived Flavors Regional Analysis and Outlook
8.3.3. United Kingdom Dairy Derived Flavors Regional Analysis and Outlook
8.3.4. Spain Dairy Derived Flavors Regional Analysis and Outlook
8.3.5. Italy Dairy Derived Flavors Regional Analysis and Outlook
8.3.6. Russia Dairy Derived Flavors Regional Analysis and Outlook
8.3.7. Rest of Europe Dairy Derived Flavors Regional Analysis and Outlook
8.4. Asia Pacific Dairy Derived Flavors Revenue (USD Million) by Country (2021-2032)
8.4.1. China Dairy Derived Flavors Regional Analysis and Outlook
8.4.2. Japan Dairy Derived Flavors Regional Analysis and Outlook
8.4.3. India Dairy Derived Flavors Regional Analysis and Outlook
8.4.4. South Korea Dairy Derived Flavors Regional Analysis and Outlook
8.4.5. Australia Dairy Derived Flavors Regional Analysis and Outlook
8.4.6. South East Asia Dairy Derived Flavors Regional Analysis and Outlook
8.4.7. Rest of Asia Pacific Dairy Derived Flavors Regional Analysis and Outlook
8.5. South America Dairy Derived Flavors Revenue (USD Million), by Country (2021-2032)
8.5.1. Brazil Dairy Derived Flavors Regional Analysis and Outlook
8.5.2. Argentina Dairy Derived Flavors Regional Analysis and Outlook
8.5.3. Rest of South America Dairy Derived Flavors Regional Analysis and Outlook
8.6. Middle East and Africa Dairy Derived Flavors Revenue (USD Million) by Country (2021-2032)
8.6.1. Middle East Dairy Derived Flavors Regional Analysis and Outlook
8.6.2. Africa Dairy Derived Flavors Regional Analysis and Outlook
Chapter 9. North America Dairy Derived Flavors Analysis and Outlook
9.1. North America Dairy Derived Flavors Revenue (USD Million) by Segments (2021-2032)
9.1.1. North America Dairy Derived Flavors Revenue (USD Million) by Type (2021-2032)
9.1.2. North America Dairy Derived Flavors Revenue (USD Million) by Application (2021-2032)
9.1.3. North America Dairy Derived Flavors Revenue (USD Million) by Product (2021-2032)
By Type
Cheese
Butter
Cream
Milk
Yogurt
Butter Milk
Others
By Application
Bakery
Confectionery
Beverages
Breakfast Cereals
Others
Chapter 10. Europe Dairy Derived Flavors Analysis and Outlook
10.1. Europe Dairy Derived Flavors Revenue (USD Million), by Segments (USD Million) (2021-2032)
10.1.1. Europe Dairy Derived Flavors Revenue (USD Million) by Type (2021-2032)
10.1.2. Europe Dairy Derived Flavors Revenue (USD Million) by Application (2021-2032)
10.1.3. Europe Dairy Derived Flavors Revenue (USD Million) by Product (2021-2032)
By Type
Cheese
Butter
Cream
Milk
Yogurt
Butter Milk
Others
By Application
Bakery
Confectionery
Beverages
Breakfast Cereals
Others
Chapter 11. Asia Pacific Dairy Derived Flavors Analysis and Outlook
11.1. Asia Pacific Dairy Derived Flavors Revenue (USD Million), and Revenue (USD Million) by Segments (2021-2032)
11.1.1. Asia Pacific Dairy Derived Flavors Revenue (USD Million) by Type (2021-2032)
11.1.2. Asia Pacific Dairy Derived Flavors Revenue (USD Million) by Application (2021-2032)
11.1.3. Asia Pacific Dairy Derived Flavors Revenue (USD Million) by Product (2021-2032)
By Type
Cheese
Butter
Cream
Milk
Yogurt
Butter Milk
Others
By Application
Bakery
Confectionery
Beverages
Breakfast Cereals
Others
Chapter 12. South America Dairy Derived Flavors Analysis and Outlook
12.1. South America Dairy Derived Flavors Revenue (USD Million), by Segments (2021-2032)
12.1.1. South America Dairy Derived Flavors Revenue (USD Million) by Type (2021-2032)
12.1.2. South America Dairy Derived Flavors Revenue (USD Million) by Application (2021-2032)
12.1.3. South America Dairy Derived Flavors Revenue (USD Million) by Product (2021-2032)
By Type
Cheese
Butter
Cream
Milk
Yogurt
Butter Milk
Others
By Application
Bakery
Confectionery
Beverages
Breakfast Cereals
Others
Chapter 13. Middle East and Africa Dairy Derived Flavors Analysis and Outlook
13.1. Middle East and Africa Dairy Derived Flavors Revenue (USD Million), by Segments (2021-2032)
13.1.1. Middle East and Africa Dairy Derived Flavors Revenue (USD Million) by Type (2021-2032)
13.1.2. Middle East and Africa Dairy Derived Flavors Revenue (USD Million) by Application (2021-2032)
13.1.3. Middle East and Africa Dairy Derived Flavors Revenue (USD Million) by Product (2021-2032)
By Type
Cheese
Butter
Cream
Milk
Yogurt
Butter Milk
Others
By Application
Bakery
Confectionery
Beverages
Breakfast Cereals
Others
Chapter 14. Dairy Derived Flavors Company Profiles
14.1 Business Overview
14.2 Product Profiles
14.3 SWOT Profiles
14.5 Recent Developments
14.6 Financial Profile
List of Companies
Advanced Biotech
All American Foods
Blends
Bluegrass
Butter Buds
Comax Flavors
Commercial Creamery
CP Ingredients
Dairy Chem
Edlong
Flaverco
Flavorjen
FONA
Gamay
Givaudan SA
Glanbia Plc
HL Commodity Foods
Jeneil Biotech
Kerry Group Plc
Ornua Ingredients
Stringer Flavours
Sunspray
Synergy Flavors
Ungerer
15. Methodology and Data Sources
15.1 Customization Offerings
15.2 Subscription Services
15.3 Related Reports
15.4 Publisher Expertise
LIST OF TABLES
Table 1 Market Segmentation Analysis
Table 2 Global Dairy Derived Flavors Market Share of Leading Companies, 2023
Table 3 Product Offerings of Leading Companies
Table 4 Low Growth Scenario Forecasts
Table 5 Reference Case Growth Scenario
Table 6 High Growth Case Scenario
Table 7 Global Dairy Derived Flavors Revenue (USD Million) And CAGR (%) By Type (2021-2032)
Table 8 Global Dairy Derived Flavors Revenue (USD Million) And CAGR (%) By Application (2021-2032)
Table 9 Global Dairy Derived Flavors Revenue (USD Million) And CAGR (%) By Product (2021-2032)
Table 10 Global Dairy Derived Flavors Market Revenue (USD Million) By Regions (2021-2032)
Table 11 Global Dairy Derived Flavors Market Share (%) By Regions (2021-2032)
Table 12 North America Dairy Derived Flavors Revenue (USD Million) By Country (2021-2032)
Table 13 Europe Dairy Derived Flavors Revenue (USD Million) By Country (2021-2032)
Table 14 Asia Pacific Dairy Derived Flavors Revenue (USD Million) By Country (2021-2032)
Table 15 South America Dairy Derived Flavors Revenue (USD Million) By Country (2021-2032)
Table 16 Middle East and Africa Dairy Derived Flavors Revenue (USD Million) By Region (2021-2032)
Table 17 North America Dairy Derived Flavors Revenue (USD Million) By Type (2021-2032)
Table 18 North America Dairy Derived Flavors Revenue (USD Million) By Application (2021-2032)
Table 19 North America Dairy Derived Flavors Revenue (USD Million) By Product (2021-2032)
Table 20 Europe Dairy Derived Flavors Revenue (USD Million) By Type (2021-2032)
Table 21 Europe Dairy Derived Flavors Revenue (USD Million) By Application (2021-2032)
Table 22 Europe Dairy Derived Flavors Revenue (USD Million) By Product (2021-2032)
Table 23 Asia Pacific Dairy Derived Flavors Revenue (USD Million) By Type (2021-2032)
Table 24 Asia Pacific Dairy Derived Flavors Revenue (USD Million) By Application (2021-2032)
Table 25 Asia Pacific Dairy Derived Flavors Revenue (USD Million) By Product (2021-2032)
Table 26 South America Dairy Derived Flavors Revenue (USD Million) By Type (2021-2032)
Table 27 South America Dairy Derived Flavors Revenue (USD Million) By Application (2021-2032)
Table 28 South America Dairy Derived Flavors Revenue (USD Million) By Product (2021-2032)
Table 29 Middle East and Africa Dairy Derived Flavors Revenue (USD Million) By Type (2021-2032)
Table 30 Middle East and Africa Dairy Derived Flavors Revenue (USD Million) By Application (2021-2032)
Table 31 Middle East and Africa Dairy Derived Flavors Revenue (USD Million) By Product (2021-2032)
LIST OF FIGURES
Figure 1. Market Scope
Figure 2. Pricing Forecasts Per Unit, 2023- 2032
Figure 3. Porter’s Five Forces
Figure 4. Global Dairy Derived Flavors Market Revenue (USD Million) By Regions (2021-2032)
Figure 5. Global Dairy Derived Flavors Market Share (%) By Regions (2023)
Figure 6. North America Dairy Derived Flavors Revenue (USD Million) By Country (2021-2032)
Figure 7. United States Dairy Derived Flavors Revenue (USD Million) By Country (2021-2032)
Figure 8. Canada Dairy Derived Flavors Revenue (USD Million) By Country (2021-2032)
Figure 9. Mexico Dairy Derived Flavors Revenue (USD Million) By Country (2021-2032)
Figure 10. Europe Dairy Derived Flavors Revenue (USD Million) By Country (2021-2032)
Figure 11. Germany Dairy Derived Flavors Revenue (USD Million) By Country (2021-2032)
Figure 12. France Dairy Derived Flavors Revenue (USD Million) By Country (2021-2032)
Figure 13. United Kingdom Dairy Derived Flavors Revenue (USD Million) By Country (2021-2032)
Figure 14. Spain Dairy Derived Flavors Revenue (USD Million) By Country (2021-2032)
Figure 15. Italy Dairy Derived Flavors Revenue (USD Million) By Country (2021-2032)
Figure 16. Russia Dairy Derived Flavors Revenue (USD Million) By Country (2021-2032)
Figure 17. Rest of Europe Dairy Derived Flavors Revenue (USD Million) By Country (2021-2032)
Figure 11. Asia Pacific Dairy Derived Flavors Revenue (USD Million) By Country (2021-2032)
Figure 12. China Dairy Derived Flavors Revenue (USD Million) By Country (2021-2032)
Figure 13. Japan Dairy Derived Flavors Revenue (USD Million) By Country (2021-2032)
Figure 14. India Dairy Derived Flavors Revenue (USD Million) By Country (2021-2032)
Figure 15. South Korea Dairy Derived Flavors Revenue (USD Million) By Country (2021-2032)
Figure 16. Australia Dairy Derived Flavors Revenue (USD Million) By Country (2021-2032)
Figure 17. South East Asia Dairy Derived Flavors Revenue (USD Million) By Country (2021-2032)
Figure 18. South America Dairy Derived Flavors Revenue (USD Million) By Country (2021-2032)
Figure 19. Brazil Dairy Derived Flavors Revenue (USD Million) By Country (2021-2032)
Figure 20. Argentina Dairy Derived Flavors Revenue (USD Million) By Country (2021-2032)
Figure 21. Rest of Asia Pacific Dairy Derived Flavors Revenue (USD Million) By Country (2021-2032)
Figure 22. Middle East and Africa Dairy Derived Flavors Revenue (USD Million) By Region (2021-2032)
Figure 23. Saudi Arabia Dairy Derived Flavors Revenue (USD Million) By Region (2021-2032)
Figure 24. The UAE Dairy Derived Flavors Revenue (USD Million) By Region (2021-2032)
Figure 25. Rest of Middle East Dairy Derived Flavors Revenue (USD Million) By Region (2021-2032)
Figure 26. South Africa Dairy Derived Flavors Revenue (USD Million) By Region (2021-2032)
Figure 27. Africa Dairy Derived Flavors Revenue (USD Million) By Region (2021-2032)
Figure 28. North America Dairy Derived Flavors Revenue (USD Million) By Type (2021-2032)
Figure 29. North America Dairy Derived Flavors Revenue (USD Million) By Application (2021-2032)
Figure 30. North America Dairy Derived Flavors Revenue (USD Million) By Product (2021-2032)
Figure 31. Europe Dairy Derived Flavors Revenue (USD Million) By Type (2021-2032)
Figure 32. Europe Dairy Derived Flavors Revenue (USD Million) By Application (2021-2032)
Figure 33. Europe Dairy Derived Flavors Revenue (USD Million) By Product (2021-2032)
Figure 34. Asia Pacific Dairy Derived Flavors Revenue (USD Million) By Type (2021-2032)
Figure 35. Asia Pacific Dairy Derived Flavors Revenue (USD Million) By Application (2021-2032)
Figure 36. Asia Pacific Dairy Derived Flavors Revenue (USD Million) By Product (2021-2032)
Figure 37. South America Dairy Derived Flavors Revenue (USD Million) By Type (2021-2032)
Figure 38. South America Dairy Derived Flavors Revenue (USD Million) By Application (2021-2032)
Figure 39. South America Dairy Derived Flavors Revenue (USD Million) By Product (2021-2032)
Figure 40. Middle East and Africa Dairy Derived Flavors Revenue (USD Million) By Type (2021-2032)
Figure 41. Middle East and Africa Dairy Derived Flavors Revenue (USD Million) By Application (2021-2032)
Figure 42. Middle East and Africa Dairy Derived Flavors Revenue (USD Million) By Product (2021-2032)
By Type
Cheese
Butter
Cream
Milk
Yogurt
Butter Milk
Others
By Application
Bakery
Confectionery
Beverages
Breakfast Cereals
Others
Countries Analyzed
North America (US, Canada, Mexico)
Europe (Germany, UK, France, Spain, Italy, Russia, Rest of Europe)
Asia Pacific (China, India, Japan, South Korea, Australia, South East Asia, Rest of Asia)
South America (Brazil, Argentina, Rest of South America)
Middle East and Africa (Saudi Arabia, UAE, Rest of Middle East, South Africa, Egypt, Rest of Africa)
