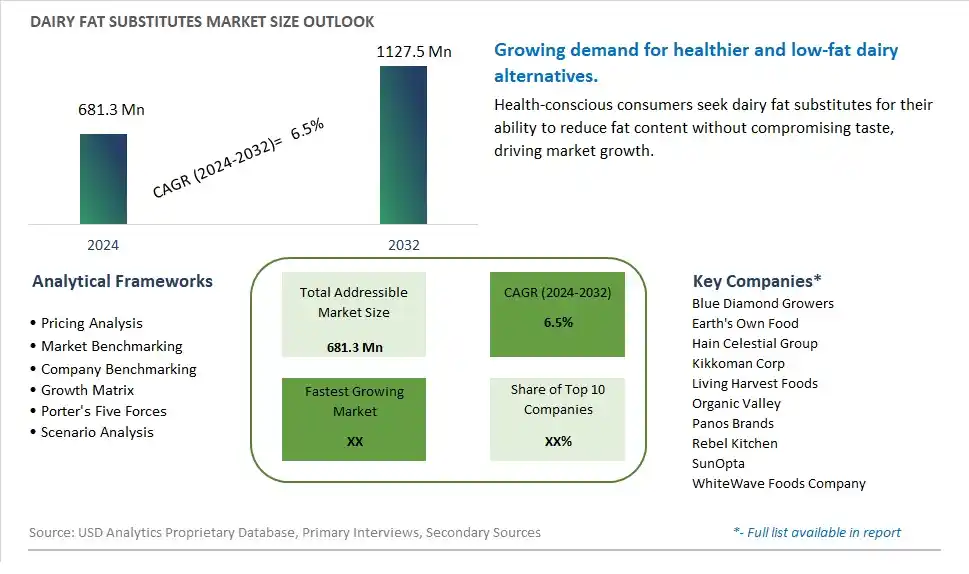
Global Dairy Fat Substitutes Market Size is valued at $681.3 Million in 2024 and is forecast to register a growth rate (CAGR) of 6.5% to reach $1127.5 Million by 2032.
The global Dairy Fat Substitutes Market Comprehensive Study analyzes and forecasts the market size across 6 regions and 24 countries for diverse segments -By Type (Soy, Almond, Others), By Application (Bakery & confectioneries, Dairy & frozen desserts, Beverages, Processed meat, Dressings, margarines, and spreads, Convenience foods, Others)
An Introduction to Dairy Fat Substitutes Market
The Dairy Fat Substitutes market in 2024 is expanding rapidly, driven by the increasing demand for healthier and lower-fat alternatives in the food and beverage industry. Dairy fat substitutes, made from ingredients such as whey protein, starches, and vegetable oils, are used to replicate the texture and mouthfeel of dairy fat while reducing calorie and fat content. The market is supported by the growing trend towards healthy eating and the demand for reduced-fat and low-calorie products. Advances in formulation and processing technologies are enhancing the functionality, taste, and nutritional profile of dairy fat substitutes. The market is also benefiting from the trend towards clean-label and natural ingredients, appealing to health-conscious consumers seeking healthier dairy alternatives.
Dairy Fat Substitutes Competitive Landscape
The market report analyses the leading companies in the industry including Blue Diamond Growers, Earth's Own Food, Hain Celestial Group, Kikkoman Corp, Living Harvest Foods, Organic Valley, Panos Brands, Rebel Kitchen, SunOpta, WhiteWave Foods Company, and Others.
Dairy Fat Substitutes Market Dynamics
Dairy Fat Substitutes Market Trend: Shift Towards Healthier Dietary Choices
A significant trend in the dairy fat substitutes market is the global shift towards healthier dietary choices. With increasing concerns about obesity, cardiovascular diseases, and other health issues related to high-fat diets, consumers are actively seeking alternatives to traditional dairy fats. This trend is driven by a growing awareness of the importance of healthy eating habits and the benefits of reducing saturated fats in the diet. As a result, there is a rising demand for dairy fat substitutes that can mimic the taste and texture of traditional dairy fats while offering lower calorie and healthier options.
Dairy Fat Substitutes Market Driver: Regulatory Initiatives and Health Guidelines
A key driver influencing the dairy fat substitutes market is the regulatory initiatives and health guidelines aimed at reducing the consumption of saturated fats. Government agencies and health organizations worldwide are advocating for healthier food choices and recommending limits on saturated fat intake to improve public health. This driver is pushing manufacturers to develop innovative dairy fat substitutes that meet regulatory standards while satisfying consumer preferences for taste and texture. The focus on reducing saturated fats in diets is driving the adoption of dairy fat substitutes across various food and beverage applications.
Dairy Fat Substitutes Market Opportunity: Expansion in Functional and Specialty Products
An exciting opportunity in the dairy fat substitutes market lies in the expansion into functional and specialty products. As consumers become more health-conscious and adventurous in their food choices, there is a growing demand for dairy fat substitutes that offer additional functional benefits. This includes products fortified with vitamins, minerals, omega-3 fatty acids, and other nutritional enhancements. Manufacturers can capitalize on this opportunity by developing dairy fat substitutes that not only reduce calories and saturated fats but also provide added nutritional value, catering to the evolving preferences of health-conscious consumers and driving innovation in the market.
Dairy Fat Substitutes Market Share Analysis: Soy segment generated the highest revenue share in the industry
The Soy segment is the largest in the Dairy Fat Substitutes Market by type. Soy-based fat substitutes have gained significant popularity due to their versatility, nutritional benefits, and functional properties. Soy is rich in protein and essential fatty acids, making it an excellent substitute for dairy fat in various food products. Its ability to mimic the texture and mouthfeel of dairy fat while providing a lower-calorie and cholesterol-free alternative makes it highly desirable in the production of low-fat and health-oriented food products. Soy-based substitutes are widely used in a range of applications, including dairy alternatives like soy milk, cheese, and yogurt, as well as in baked goods, dressings, and spreads. The increasing consumer demand for plant-based and vegan products has further boosted the popularity of soy as a fat substitute, solidifying its position as the largest segment in this market.
Dairy Fat Substitutes Market Share Analysis: Dairy & Frozen Desserts is the fastest growing segment over the forecast period to 2032
The Dairy & Frozen Desserts segment is expected to be the fastest-growing in the Dairy Fat Substitutes Market by 2032. This growth is driven by the rising consumer demand for healthier and lower-fat alternatives in their favorite dairy and dessert products. As health consciousness continues to grow, consumers are increasingly seeking products that offer indulgence without the associated high fat and calorie content. Dairy fat substitutes play a crucial role in reformulating traditional dairy and frozen desserts to meet these health demands without compromising on taste and texture. The surge in popularity of vegan and plant-based diets also contributes to the demand for dairy-free and low-fat frozen desserts, which rely heavily on fat substitutes to achieve the desired creamy consistency. Innovations in food technology are enabling manufacturers to develop more appealing and nutritionally balanced products, further fueling the growth of this segment. As the market for healthier indulgences expands, the Dairy & Frozen Desserts segment is poised for significant growth, outpacing other applications in the use of dairy fat substitutes.
Dairy Fat Substitutes Market Segmentation
By Type
Soy
Almond
Others
By Application
Bakery & confectioneries
Dairy & frozen desserts
Beverages
Processed meat
Dressings, margarines, and spreads
Convenience foods
Others
Countries Analyzed
North America (US, Canada, Mexico)
Europe (Germany, UK, France, Spain, Italy, Russia, Rest of Europe)
Asia Pacific (China, India, Japan, South Korea, Australia, South East Asia, Rest of Asia)
South America (Brazil, Argentina, Rest of South America)
Middle East and Africa (Saudi Arabia, UAE, Rest of Middle East, South Africa, Egypt, Rest of Africa)
Dairy Fat Substitutes Companies Profiled in the Study
Blue Diamond Growers
Earth's Own Food
Hain Celestial Group
Kikkoman Corp
Living Harvest Foods
Organic Valley
Panos Brands
Rebel Kitchen
SunOpta
WhiteWave Foods Company
*- List Not Exhaustive
Chapter 1. TABLE OF CONTENTS
Chapter 2. Introduction to Dairy Fat Substitutes Market
2.1. Market Overview
2.2. Key Statistics and Report Highlights
2.3. Scope of the Comprehensive Study
2.3.1. Market Definition
2.3.2 Countries and Regions Covered
2.3.3 Research Objective
2.3.4 Units, Currency, and Conversions
2.3.5 Industry Value Chain
2.4. Key Market Segments
2.5. Key Companies
2.6. Study Period
Chapter 3. Strategic Analysis Review
3.1. Dairy Fat Substitutes Pricing Analysis and Forecast
3.2. Porter’s Five Forces
3.3. Market Ecosystem
3.4. SWOT Analysis
3.5. Regulatory Scenario
3.3. Effects of Inflation, Russia-Ukraine War, moderating economic growth, and other macroeconomic factors
Chapter 4. Competitive Landscape
4.1. Market Share Analysis
4.1.1. Global Dairy Fat Substitutes Market Share by Company, 2023
4.1.2. Product Offerings of Leading Dairy Fat Substitutes Companies
4.2. Market Entropy
4.2.1. New Product Launches in the Industry
4.2.2. Mergers, Acquisitions, Joint ventures, and Partnerships
4.3. Key Strategies and Best Practices
Chapter 5. Global Market Projections: Best, Reference, and Low Case Scenarios
5.1. Growth Analysis- Case Scenario Definitions
5.2. Low Growth Case Scenario Forecasts
5.3. Reference Growth Case Scenario Forecasts
5.4. High Growth Case Scenario Forecasts
Chapter 6. Market Dynamics
6.1. Dairy Fat Substitutes Market Drivers
6.2. Dairy Fat Substitutes Market Challenges
6.6. Dairy Fat Substitutes Market Opportunities
6.4. Dairy Fat Substitutes Market Trends
Chapter 7. Global Dairy Fat Substitutes Market Outlook Trends
7.1. Global Dairy Fat Substitutes Revenue (USD Million) and CAGR (%) by Type (2021-2032)
7.2. Global Dairy Fat Substitutes Revenue (USD Million) and CAGR (%) by Application (2021-2032)
7.3. Global Dairy Fat Substitutes Revenue (USD Million) and CAGR (%) by Product (2021-2032)
By Type
Soy
Almond
Others
By Application
Bakery & confectioneries
Dairy & frozen desserts
Beverages
Processed meat
Dressings, margarines, and spreads
Convenience foods
Others
Chapter 8. Global Dairy Fat Substitutes Regional Analysis and Outlook
8.1. Global Dairy Fat Substitutes Revenue (USD Million) By Regions (2021- 2032)
8.2. North America Dairy Fat Substitutes Revenue (USD Million) by Country (2021-2032)
8.2.1. United States Dairy Fat Substitutes Regional Analysis and Outlook
8.2.2. Canada Dairy Fat Substitutes Regional Analysis and Outlook
8.2.3. Mexico Dairy Fat Substitutes Regional Analysis and Outlook
8.3. Europe Dairy Fat Substitutes Revenue (USD Million), by Country (2021-2032)
8.3.1. Germany Dairy Fat Substitutes Regional Analysis and Outlook
8.3.2. France Dairy Fat Substitutes Regional Analysis and Outlook
8.3.3. United Kingdom Dairy Fat Substitutes Regional Analysis and Outlook
8.3.4. Spain Dairy Fat Substitutes Regional Analysis and Outlook
8.3.5. Italy Dairy Fat Substitutes Regional Analysis and Outlook
8.3.6. Russia Dairy Fat Substitutes Regional Analysis and Outlook
8.3.7. Rest of Europe Dairy Fat Substitutes Regional Analysis and Outlook
8.4. Asia Pacific Dairy Fat Substitutes Revenue (USD Million) by Country (2021-2032)
8.4.1. China Dairy Fat Substitutes Regional Analysis and Outlook
8.4.2. Japan Dairy Fat Substitutes Regional Analysis and Outlook
8.4.3. India Dairy Fat Substitutes Regional Analysis and Outlook
8.4.4. South Korea Dairy Fat Substitutes Regional Analysis and Outlook
8.4.5. Australia Dairy Fat Substitutes Regional Analysis and Outlook
8.4.6. South East Asia Dairy Fat Substitutes Regional Analysis and Outlook
8.4.7. Rest of Asia Pacific Dairy Fat Substitutes Regional Analysis and Outlook
8.5. South America Dairy Fat Substitutes Revenue (USD Million), by Country (2021-2032)
8.5.1. Brazil Dairy Fat Substitutes Regional Analysis and Outlook
8.5.2. Argentina Dairy Fat Substitutes Regional Analysis and Outlook
8.5.3. Rest of South America Dairy Fat Substitutes Regional Analysis and Outlook
8.6. Middle East and Africa Dairy Fat Substitutes Revenue (USD Million) by Country (2021-2032)
8.6.1. Middle East Dairy Fat Substitutes Regional Analysis and Outlook
8.6.2. Africa Dairy Fat Substitutes Regional Analysis and Outlook
Chapter 9. North America Dairy Fat Substitutes Analysis and Outlook
9.1. North America Dairy Fat Substitutes Revenue (USD Million) by Segments (2021-2032)
9.1.1. North America Dairy Fat Substitutes Revenue (USD Million) by Type (2021-2032)
9.1.2. North America Dairy Fat Substitutes Revenue (USD Million) by Application (2021-2032)
9.1.3. North America Dairy Fat Substitutes Revenue (USD Million) by Product (2021-2032)
By Type
Soy
Almond
Others
By Application
Bakery & confectioneries
Dairy & frozen desserts
Beverages
Processed meat
Dressings, margarines, and spreads
Convenience foods
Others
Chapter 10. Europe Dairy Fat Substitutes Analysis and Outlook
10.1. Europe Dairy Fat Substitutes Revenue (USD Million), by Segments (USD Million) (2021-2032)
10.1.1. Europe Dairy Fat Substitutes Revenue (USD Million) by Type (2021-2032)
10.1.2. Europe Dairy Fat Substitutes Revenue (USD Million) by Application (2021-2032)
10.1.3. Europe Dairy Fat Substitutes Revenue (USD Million) by Product (2021-2032)
By Type
Soy
Almond
Others
By Application
Bakery & confectioneries
Dairy & frozen desserts
Beverages
Processed meat
Dressings, margarines, and spreads
Convenience foods
Others
Chapter 11. Asia Pacific Dairy Fat Substitutes Analysis and Outlook
11.1. Asia Pacific Dairy Fat Substitutes Revenue (USD Million), and Revenue (USD Million) by Segments (2021-2032)
11.1.1. Asia Pacific Dairy Fat Substitutes Revenue (USD Million) by Type (2021-2032)
11.1.2. Asia Pacific Dairy Fat Substitutes Revenue (USD Million) by Application (2021-2032)
11.1.3. Asia Pacific Dairy Fat Substitutes Revenue (USD Million) by Product (2021-2032)
By Type
Soy
Almond
Others
By Application
Bakery & confectioneries
Dairy & frozen desserts
Beverages
Processed meat
Dressings, margarines, and spreads
Convenience foods
Others
Chapter 12. South America Dairy Fat Substitutes Analysis and Outlook
12.1. South America Dairy Fat Substitutes Revenue (USD Million), by Segments (2021-2032)
12.1.1. South America Dairy Fat Substitutes Revenue (USD Million) by Type (2021-2032)
12.1.2. South America Dairy Fat Substitutes Revenue (USD Million) by Application (2021-2032)
12.1.3. South America Dairy Fat Substitutes Revenue (USD Million) by Product (2021-2032)
By Type
Soy
Almond
Others
By Application
Bakery & confectioneries
Dairy & frozen desserts
Beverages
Processed meat
Dressings, margarines, and spreads
Convenience foods
Others
Chapter 13. Middle East and Africa Dairy Fat Substitutes Analysis and Outlook
13.1. Middle East and Africa Dairy Fat Substitutes Revenue (USD Million), by Segments (2021-2032)
13.1.1. Middle East and Africa Dairy Fat Substitutes Revenue (USD Million) by Type (2021-2032)
13.1.2. Middle East and Africa Dairy Fat Substitutes Revenue (USD Million) by Application (2021-2032)
13.1.3. Middle East and Africa Dairy Fat Substitutes Revenue (USD Million) by Product (2021-2032)
By Type
Soy
Almond
Others
By Application
Bakery & confectioneries
Dairy & frozen desserts
Beverages
Processed meat
Dressings, margarines, and spreads
Convenience foods
Others
Chapter 14. Dairy Fat Substitutes Company Profiles
14.1 Business Overview
14.2 Product Profiles
14.3 SWOT Profiles
14.5 Recent Developments
14.6 Financial Profile
List of Companies
Blue Diamond Growers
Earth's Own Food
Hain Celestial Group
Kikkoman Corp
Living Harvest Foods
Organic Valley
Panos Brands
Rebel Kitchen
SunOpta
WhiteWave Foods Company
15. Methodology and Data Sources
15.1 Customization Offerings
15.2 Subscription Services
15.3 Related Reports
15.4 Publisher Expertise
LIST OF TABLES
Table 1 Market Segmentation Analysis
Table 2 Global Dairy Fat Substitutes Market Share of Leading Companies, 2023
Table 3 Product Offerings of Leading Companies
Table 4 Low Growth Scenario Forecasts
Table 5 Reference Case Growth Scenario
Table 6 High Growth Case Scenario
Table 7 Global Dairy Fat Substitutes Revenue (USD Million) And CAGR (%) By Type (2021-2032)
Table 8 Global Dairy Fat Substitutes Revenue (USD Million) And CAGR (%) By Application (2021-2032)
Table 9 Global Dairy Fat Substitutes Revenue (USD Million) And CAGR (%) By Product (2021-2032)
Table 10 Global Dairy Fat Substitutes Market Revenue (USD Million) By Regions (2021-2032)
Table 11 Global Dairy Fat Substitutes Market Share (%) By Regions (2021-2032)
Table 12 North America Dairy Fat Substitutes Revenue (USD Million) By Country (2021-2032)
Table 13 Europe Dairy Fat Substitutes Revenue (USD Million) By Country (2021-2032)
Table 14 Asia Pacific Dairy Fat Substitutes Revenue (USD Million) By Country (2021-2032)
Table 15 South America Dairy Fat Substitutes Revenue (USD Million) By Country (2021-2032)
Table 16 Middle East and Africa Dairy Fat Substitutes Revenue (USD Million) By Region (2021-2032)
Table 17 North America Dairy Fat Substitutes Revenue (USD Million) By Type (2021-2032)
Table 18 North America Dairy Fat Substitutes Revenue (USD Million) By Application (2021-2032)
Table 19 North America Dairy Fat Substitutes Revenue (USD Million) By Product (2021-2032)
Table 20 Europe Dairy Fat Substitutes Revenue (USD Million) By Type (2021-2032)
Table 21 Europe Dairy Fat Substitutes Revenue (USD Million) By Application (2021-2032)
Table 22 Europe Dairy Fat Substitutes Revenue (USD Million) By Product (2021-2032)
Table 23 Asia Pacific Dairy Fat Substitutes Revenue (USD Million) By Type (2021-2032)
Table 24 Asia Pacific Dairy Fat Substitutes Revenue (USD Million) By Application (2021-2032)
Table 25 Asia Pacific Dairy Fat Substitutes Revenue (USD Million) By Product (2021-2032)
Table 26 South America Dairy Fat Substitutes Revenue (USD Million) By Type (2021-2032)
Table 27 South America Dairy Fat Substitutes Revenue (USD Million) By Application (2021-2032)
Table 28 South America Dairy Fat Substitutes Revenue (USD Million) By Product (2021-2032)
Table 29 Middle East and Africa Dairy Fat Substitutes Revenue (USD Million) By Type (2021-2032)
Table 30 Middle East and Africa Dairy Fat Substitutes Revenue (USD Million) By Application (2021-2032)
Table 31 Middle East and Africa Dairy Fat Substitutes Revenue (USD Million) By Product (2021-2032)
LIST OF FIGURES
Figure 1. Market Scope
Figure 2. Pricing Forecasts Per Unit, 2023- 2032
Figure 3. Porter’s Five Forces
Figure 4. Global Dairy Fat Substitutes Market Revenue (USD Million) By Regions (2021-2032)
Figure 5. Global Dairy Fat Substitutes Market Share (%) By Regions (2023)
Figure 6. North America Dairy Fat Substitutes Revenue (USD Million) By Country (2021-2032)
Figure 7. United States Dairy Fat Substitutes Revenue (USD Million) By Country (2021-2032)
Figure 8. Canada Dairy Fat Substitutes Revenue (USD Million) By Country (2021-2032)
Figure 9. Mexico Dairy Fat Substitutes Revenue (USD Million) By Country (2021-2032)
Figure 10. Europe Dairy Fat Substitutes Revenue (USD Million) By Country (2021-2032)
Figure 11. Germany Dairy Fat Substitutes Revenue (USD Million) By Country (2021-2032)
Figure 12. France Dairy Fat Substitutes Revenue (USD Million) By Country (2021-2032)
Figure 13. United Kingdom Dairy Fat Substitutes Revenue (USD Million) By Country (2021-2032)
Figure 14. Spain Dairy Fat Substitutes Revenue (USD Million) By Country (2021-2032)
Figure 15. Italy Dairy Fat Substitutes Revenue (USD Million) By Country (2021-2032)
Figure 16. Russia Dairy Fat Substitutes Revenue (USD Million) By Country (2021-2032)
Figure 17. Rest of Europe Dairy Fat Substitutes Revenue (USD Million) By Country (2021-2032)
Figure 11. Asia Pacific Dairy Fat Substitutes Revenue (USD Million) By Country (2021-2032)
Figure 12. China Dairy Fat Substitutes Revenue (USD Million) By Country (2021-2032)
Figure 13. Japan Dairy Fat Substitutes Revenue (USD Million) By Country (2021-2032)
Figure 14. India Dairy Fat Substitutes Revenue (USD Million) By Country (2021-2032)
Figure 15. South Korea Dairy Fat Substitutes Revenue (USD Million) By Country (2021-2032)
Figure 16. Australia Dairy Fat Substitutes Revenue (USD Million) By Country (2021-2032)
Figure 17. South East Asia Dairy Fat Substitutes Revenue (USD Million) By Country (2021-2032)
Figure 18. South America Dairy Fat Substitutes Revenue (USD Million) By Country (2021-2032)
Figure 19. Brazil Dairy Fat Substitutes Revenue (USD Million) By Country (2021-2032)
Figure 20. Argentina Dairy Fat Substitutes Revenue (USD Million) By Country (2021-2032)
Figure 21. Rest of Asia Pacific Dairy Fat Substitutes Revenue (USD Million) By Country (2021-2032)
Figure 22. Middle East and Africa Dairy Fat Substitutes Revenue (USD Million) By Region (2021-2032)
Figure 23. Saudi Arabia Dairy Fat Substitutes Revenue (USD Million) By Region (2021-2032)
Figure 24. The UAE Dairy Fat Substitutes Revenue (USD Million) By Region (2021-2032)
Figure 25. Rest of Middle East Dairy Fat Substitutes Revenue (USD Million) By Region (2021-2032)
Figure 26. South Africa Dairy Fat Substitutes Revenue (USD Million) By Region (2021-2032)
Figure 27. Africa Dairy Fat Substitutes Revenue (USD Million) By Region (2021-2032)
Figure 28. North America Dairy Fat Substitutes Revenue (USD Million) By Type (2021-2032)
Figure 29. North America Dairy Fat Substitutes Revenue (USD Million) By Application (2021-2032)
Figure 30. North America Dairy Fat Substitutes Revenue (USD Million) By Product (2021-2032)
Figure 31. Europe Dairy Fat Substitutes Revenue (USD Million) By Type (2021-2032)
Figure 32. Europe Dairy Fat Substitutes Revenue (USD Million) By Application (2021-2032)
Figure 33. Europe Dairy Fat Substitutes Revenue (USD Million) By Product (2021-2032)
Figure 34. Asia Pacific Dairy Fat Substitutes Revenue (USD Million) By Type (2021-2032)
Figure 35. Asia Pacific Dairy Fat Substitutes Revenue (USD Million) By Application (2021-2032)
Figure 36. Asia Pacific Dairy Fat Substitutes Revenue (USD Million) By Product (2021-2032)
Figure 37. South America Dairy Fat Substitutes Revenue (USD Million) By Type (2021-2032)
Figure 38. South America Dairy Fat Substitutes Revenue (USD Million) By Application (2021-2032)
Figure 39. South America Dairy Fat Substitutes Revenue (USD Million) By Product (2021-2032)
Figure 40. Middle East and Africa Dairy Fat Substitutes Revenue (USD Million) By Type (2021-2032)
Figure 41. Middle East and Africa Dairy Fat Substitutes Revenue (USD Million) By Application (2021-2032)
Figure 42. Middle East and Africa Dairy Fat Substitutes Revenue (USD Million) By Product (2021-2032)
By Type
Soy
Almond
Others
By Application
Bakery & confectioneries
Dairy & frozen desserts
Beverages
Processed meat
Dressings, margarines, and spreads
Convenience foods
Others
Countries Analyzed
North America (US, Canada, Mexico)
Europe (Germany, UK, France, Spain, Italy, Russia, Rest of Europe)
Asia Pacific (China, India, Japan, South Korea, Australia, South East Asia, Rest of Asia)
South America (Brazil, Argentina, Rest of South America)
Middle East and Africa (Saudi Arabia, UAE, Rest of Middle East, South Africa, Egypt, Rest of Africa)
