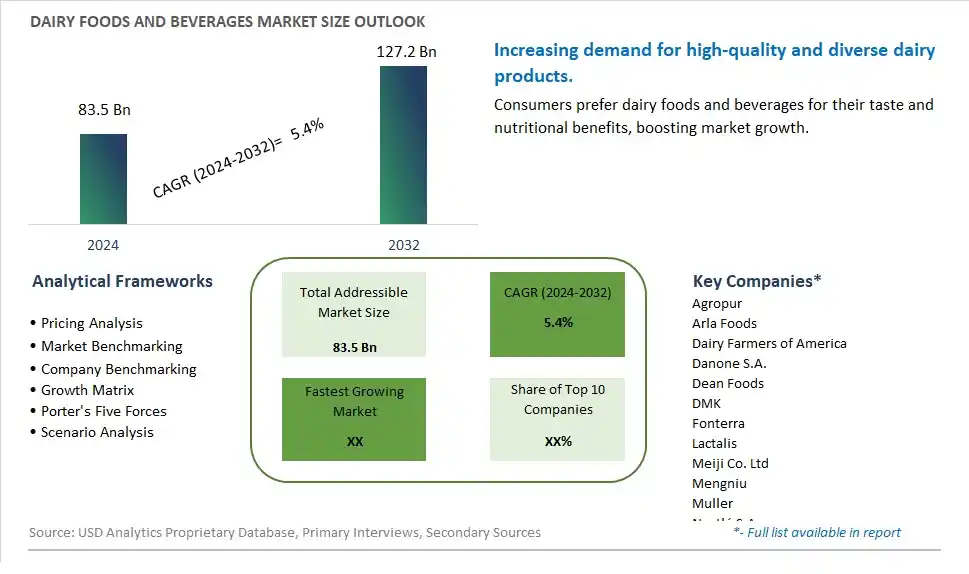
Global Dairy Foods and Beverages Market Size is valued at $83.5 Billion in 2024 and is forecast to register a growth rate (CAGR) of 5.4% to reach $127.2 Billion by 2032.
The global Dairy Foods and Beverages Market Comprehensive Study analyzes and forecasts the market size across 6 regions and 24 countries for diverse segments -By Type (Milk, Butter and Ghee, Cheese, Ice Cream, Yoghurt, Milk Powder, Others), By Application (Frozen Food, Bakery and Confectionary, Clinical Nutrition, Channel), By Channel (Direct Sales, Distribution Channel)
An Introduction to Dairy Foods and Beverages Market
In 2024, the Dairy Foods and Beverages market is witnessing robust growth, driven by the increasing demand for a diverse range of high-quality dairy products. The market includes items such as milk, yogurt, cheese, butter, and dairy-based beverages, all valued for their nutritional benefits and culinary versatility. The market is supported by the growing trend towards healthy eating and the rising demand for premium and organic dairy products. Advances in dairy processing and packaging technologies are enhancing the quality, safety, and shelf life of dairy foods and beverages. The market is also benefiting from the trend towards functional and fortified dairy products, appealing to health-conscious consumers seeking nutritious and delicious options.
Dairy Foods and Beverages Competitive Landscape
The market report analyses the leading companies in the industry including Agropur, Arla Foods, Dairy Farmers of America, Danone S.A., Dean Foods, DMK, Fonterra, Lactalis, Meiji Co. Ltd, Mengniu, Muller, Nestlé S.A., Royal FrieslandCampina N.V., Saputo, Savencia, Schreiber Foods, Sodiaal, The Kraft Heinz Company, Unilever, Yili, and Others.
Dairy Foods and Beverages Market Dynamics
Dairy Foods and Beverages Market Trend: Rise in Demand for Plant-Based Alternatives
A prominent trend in the dairy foods and beverages market is the increasing demand for plant-based alternatives. As consumers become more health-conscious and environmentally aware, there is a growing preference for dairy-free options made from plant sources such as almonds, soy, coconut, and oats. This trend is driven by concerns about animal welfare, sustainability, and the perceived health benefits of plant-based diets. Manufacturers in the dairy industry are responding to this trend by developing a wide range of plant-based dairy alternatives, including milk, yogurt, cheese, and ice cream, to cater to the evolving preferences of consumers.
Dairy Foods and Beverages Market Driver: Health and Wellness Consciousness
A key driver influencing the dairy foods and beverages market is the rising health and wellness consciousness among consumers. With an increasing focus on preventive healthcare and nutrition, consumers are seeking dairy products that offer functional benefits such as probiotics, protein fortification, vitamins, and minerals. This driver is pushing manufacturers to innovate and introduce healthier variants of traditional dairy foods and beverages, including low-fat, reduced-sugar, and fortified options. The growing awareness of the link between diet and health outcomes is driving the demand for dairy products that support overall well-being and address specific health concerns.
Dairy Foods and Beverages Market Opportunity: Expansion in Functional Dairy Products
An exciting opportunity in the dairy foods and beverages market lies in the expansion of functional dairy products. Consumers are looking for dairy items that not only taste good but also provide additional health benefits. This includes products like probiotic yogurt for digestive health, fortified milk for bone health, and protein-enriched beverages for muscle recovery. Manufacturers can capitalize on this opportunity by developing a diverse range of functional dairy products that meet the nutritional needs and preferences of different consumer segments. The trend towards functional foods and beverages presents avenues for innovation and differentiation in the dairy market, creating opportunities for companies to expand their product portfolios and capture new market segments.
Dairy Foods and Beverages Market Share Analysis: Milk segment generated the highest revenue share in the industry
The Milk segment is the largest in the Dairy Foods and Beverages Market by type. Milk's dominance in this market is due to its fundamental role as a staple food and beverage across the globe. It is widely consumed for its nutritional benefits, providing essential nutrients such as calcium, protein, and vitamins. The versatility of milk also contributes to its leading position, as it serves as a base ingredient for numerous dairy products, including cheese, butter, yogurt, and ice cream. Additionally, milk's extensive use in various culinary applications and its consumption by people of all age groups further bolster its market presence. The continuous demand for fresh milk, along with the growing popularity of flavored and fortified milk variants, ensures that milk remains the largest segment in the dairy foods and beverages market.
Dairy Foods and Beverages Market Share Analysis: Clinical Nutrition is the fastest growing segment over the forecast period to 2032
The Clinical Nutrition segment is expected to be the fastest-growing in the Dairy Foods and Beverages Market by 2032. This growth is driven by the increasing focus on health and wellness, particularly among aging populations and individuals with specific dietary needs. Clinical nutrition products are designed to meet the dietary requirements of patients recovering from illness, surgery, or those with chronic conditions, and dairy-based ingredients play a crucial role in formulating these products due to their high nutritional value. The rising prevalence of lifestyle-related diseases, such as diabetes and cardiovascular diseases, is also driving the demand for specialized nutrition products that include dairy components for their beneficial properties. Innovations in dairy processing and the development of new formulations tailored for clinical nutrition are further propelling this segment's growth. As awareness about the importance of nutrition in disease management and recovery continues to rise, the clinical nutrition segment is set to experience significant expansion.
Dairy Foods and Beverages Market Share Analysis: Offline Distribution Channel segment generated the highest revenue share in the industry
The Offline Distribution Channel segment is the largest in the Dairy Foods and Beverages Market by channel. This segment's dominance is attributed to the extensive network of wholesalers, retailers, and distributors that facilitate the widespread availability of dairy products. Distribution channels include supermarkets, hypermarkets, convenience stores, and specialty stores, which are essential for reaching a broad consumer base. These channels provide consumers with convenient access to a wide variety of dairy products, ensuring that fresh and processed dairy items are readily available. The role of distribution channels is crucial in maintaining the supply chain efficiency and ensuring that products meet consumer demand. The continuous expansion of retail infrastructure, particularly in emerging markets, supports the growth and dominance of the distribution channel segment in the dairy foods and beverages market.
Dairy Foods and Beverages Market Segmentation
By Type
Milk
Butter and Ghee
Cheese
Ice Cream
Yoghurt
Milk Powder
Others
By Application
Frozen Food
Bakery and Confectionary
Clinical Nutrition
Channel
By Channel
Direct Sales
Distribution Channel
Countries Analyzed
North America (US, Canada, Mexico)
Europe (Germany, UK, France, Spain, Italy, Russia, Rest of Europe)
Asia Pacific (China, India, Japan, South Korea, Australia, South East Asia, Rest of Asia)
South America (Brazil, Argentina, Rest of South America)
Middle East and Africa (Saudi Arabia, UAE, Rest of Middle East, South Africa, Egypt, Rest of Africa)
Dairy Foods and Beverages Companies Profiled in the Study
Agropur
Arla Foods
Dairy Farmers of America
Danone S.A.
Dean Foods
DMK
Fonterra
Lactalis
Meiji Co. Ltd
Mengniu
Muller
Nestlé S.A.
Royal FrieslandCampina N.V.
Saputo
Savencia
Schreiber Foods
Sodiaal
The Kraft Heinz Company
Unilever
Yili
*- List Not Exhaustive
Chapter 1. TABLE OF CONTENTS
Chapter 2. Introduction to Dairy Foods and Beverages Market
2.1. Market Overview
2.2. Key Statistics and Report Highlights
2.3. Scope of the Comprehensive Study
2.3.1. Market Definition
2.3.2 Countries and Regions Covered
2.3.3 Research Objective
2.3.4 Units, Currency, and Conversions
2.3.5 Industry Value Chain
2.4. Key Market Segments
2.5. Key Companies
2.6. Study Period
Chapter 3. Strategic Analysis Review
3.1. Dairy Foods and Beverages Pricing Analysis and Forecast
3.2. Porter’s Five Forces
3.3. Market Ecosystem
3.4. SWOT Analysis
3.5. Regulatory Scenario
3.3. Effects of Inflation, Russia-Ukraine War, moderating economic growth, and other macroeconomic factors
Chapter 4. Competitive Landscape
4.1. Market Share Analysis
4.1.1. Global Dairy Foods and Beverages Market Share by Company, 2023
4.1.2. Product Offerings of Leading Dairy Foods and Beverages Companies
4.2. Market Entropy
4.2.1. New Product Launches in the Industry
4.2.2. Mergers, Acquisitions, Joint ventures, and Partnerships
4.3. Key Strategies and Best Practices
Chapter 5. Global Market Projections: Best, Reference, and Low Case Scenarios
5.1. Growth Analysis- Case Scenario Definitions
5.2. Low Growth Case Scenario Forecasts
5.3. Reference Growth Case Scenario Forecasts
5.4. High Growth Case Scenario Forecasts
Chapter 6. Market Dynamics
6.1. Dairy Foods and Beverages Market Drivers
6.2. Dairy Foods and Beverages Market Challenges
6.6. Dairy Foods and Beverages Market Opportunities
6.4. Dairy Foods and Beverages Market Trends
Chapter 7. Global Dairy Foods and Beverages Market Outlook Trends
7.1. Global Dairy Foods and Beverages Revenue (USD Million) and CAGR (%) by Type (2021-2032)
7.2. Global Dairy Foods and Beverages Revenue (USD Million) and CAGR (%) by Application (2021-2032)
7.3. Global Dairy Foods and Beverages Revenue (USD Million) and CAGR (%) by Product (2021-2032)
By Type
Milk
Butter and Ghee
Cheese
Ice Cream
Yoghurt
Milk Powder
Others
By Application
Frozen Food
Bakery and Confectionary
Clinical Nutrition
Channel
By Channel
Direct Sales
Distribution Channel
Chapter 8. Global Dairy Foods and Beverages Regional Analysis and Outlook
8.1. Global Dairy Foods and Beverages Revenue (USD Million) By Regions (2021- 2032)
8.2. North America Dairy Foods and Beverages Revenue (USD Million) by Country (2021-2032)
8.2.1. United States Dairy Foods and Beverages Regional Analysis and Outlook
8.2.2. Canada Dairy Foods and Beverages Regional Analysis and Outlook
8.2.3. Mexico Dairy Foods and Beverages Regional Analysis and Outlook
8.3. Europe Dairy Foods and Beverages Revenue (USD Million), by Country (2021-2032)
8.3.1. Germany Dairy Foods and Beverages Regional Analysis and Outlook
8.3.2. France Dairy Foods and Beverages Regional Analysis and Outlook
8.3.3. United Kingdom Dairy Foods and Beverages Regional Analysis and Outlook
8.3.4. Spain Dairy Foods and Beverages Regional Analysis and Outlook
8.3.5. Italy Dairy Foods and Beverages Regional Analysis and Outlook
8.3.6. Russia Dairy Foods and Beverages Regional Analysis and Outlook
8.3.7. Rest of Europe Dairy Foods and Beverages Regional Analysis and Outlook
8.4. Asia Pacific Dairy Foods and Beverages Revenue (USD Million) by Country (2021-2032)
8.4.1. China Dairy Foods and Beverages Regional Analysis and Outlook
8.4.2. Japan Dairy Foods and Beverages Regional Analysis and Outlook
8.4.3. India Dairy Foods and Beverages Regional Analysis and Outlook
8.4.4. South Korea Dairy Foods and Beverages Regional Analysis and Outlook
8.4.5. Australia Dairy Foods and Beverages Regional Analysis and Outlook
8.4.6. South East Asia Dairy Foods and Beverages Regional Analysis and Outlook
8.4.7. Rest of Asia Pacific Dairy Foods and Beverages Regional Analysis and Outlook
8.5. South America Dairy Foods and Beverages Revenue (USD Million), by Country (2021-2032)
8.5.1. Brazil Dairy Foods and Beverages Regional Analysis and Outlook
8.5.2. Argentina Dairy Foods and Beverages Regional Analysis and Outlook
8.5.3. Rest of South America Dairy Foods and Beverages Regional Analysis and Outlook
8.6. Middle East and Africa Dairy Foods and Beverages Revenue (USD Million) by Country (2021-2032)
8.6.1. Middle East Dairy Foods and Beverages Regional Analysis and Outlook
8.6.2. Africa Dairy Foods and Beverages Regional Analysis and Outlook
Chapter 9. North America Dairy Foods and Beverages Analysis and Outlook
9.1. North America Dairy Foods and Beverages Revenue (USD Million) by Segments (2021-2032)
9.1.1. North America Dairy Foods and Beverages Revenue (USD Million) by Type (2021-2032)
9.1.2. North America Dairy Foods and Beverages Revenue (USD Million) by Application (2021-2032)
9.1.3. North America Dairy Foods and Beverages Revenue (USD Million) by Product (2021-2032)
By Type
Milk
Butter and Ghee
Cheese
Ice Cream
Yoghurt
Milk Powder
Others
By Application
Frozen Food
Bakery and Confectionary
Clinical Nutrition
Channel
By Channel
Direct Sales
Distribution Channel
Chapter 10. Europe Dairy Foods and Beverages Analysis and Outlook
10.1. Europe Dairy Foods and Beverages Revenue (USD Million), by Segments (USD Million) (2021-2032)
10.1.1. Europe Dairy Foods and Beverages Revenue (USD Million) by Type (2021-2032)
10.1.2. Europe Dairy Foods and Beverages Revenue (USD Million) by Application (2021-2032)
10.1.3. Europe Dairy Foods and Beverages Revenue (USD Million) by Product (2021-2032)
By Type
Milk
Butter and Ghee
Cheese
Ice Cream
Yoghurt
Milk Powder
Others
By Application
Frozen Food
Bakery and Confectionary
Clinical Nutrition
Channel
By Channel
Direct Sales
Distribution Channel
Chapter 11. Asia Pacific Dairy Foods and Beverages Analysis and Outlook
11.1. Asia Pacific Dairy Foods and Beverages Revenue (USD Million), and Revenue (USD Million) by Segments (2021-2032)
11.1.1. Asia Pacific Dairy Foods and Beverages Revenue (USD Million) by Type (2021-2032)
11.1.2. Asia Pacific Dairy Foods and Beverages Revenue (USD Million) by Application (2021-2032)
11.1.3. Asia Pacific Dairy Foods and Beverages Revenue (USD Million) by Product (2021-2032)
By Type
Milk
Butter and Ghee
Cheese
Ice Cream
Yoghurt
Milk Powder
Others
By Application
Frozen Food
Bakery and Confectionary
Clinical Nutrition
Channel
By Channel
Direct Sales
Distribution Channel
Chapter 12. South America Dairy Foods and Beverages Analysis and Outlook
12.1. South America Dairy Foods and Beverages Revenue (USD Million), by Segments (2021-2032)
12.1.1. South America Dairy Foods and Beverages Revenue (USD Million) by Type (2021-2032)
12.1.2. South America Dairy Foods and Beverages Revenue (USD Million) by Application (2021-2032)
12.1.3. South America Dairy Foods and Beverages Revenue (USD Million) by Product (2021-2032)
By Type
Milk
Butter and Ghee
Cheese
Ice Cream
Yoghurt
Milk Powder
Others
By Application
Frozen Food
Bakery and Confectionary
Clinical Nutrition
Channel
By Channel
Direct Sales
Distribution Channel
Chapter 13. Middle East and Africa Dairy Foods and Beverages Analysis and Outlook
13.1. Middle East and Africa Dairy Foods and Beverages Revenue (USD Million), by Segments (2021-2032)
13.1.1. Middle East and Africa Dairy Foods and Beverages Revenue (USD Million) by Type (2021-2032)
13.1.2. Middle East and Africa Dairy Foods and Beverages Revenue (USD Million) by Application (2021-2032)
13.1.3. Middle East and Africa Dairy Foods and Beverages Revenue (USD Million) by Product (2021-2032)
By Type
Milk
Butter and Ghee
Cheese
Ice Cream
Yoghurt
Milk Powder
Others
By Application
Frozen Food
Bakery and Confectionary
Clinical Nutrition
Channel
By Channel
Direct Sales
Distribution Channel
Chapter 14. Dairy Foods and Beverages Company Profiles
14.1 Business Overview
14.2 Product Profiles
14.3 SWOT Profiles
14.5 Recent Developments
14.6 Financial Profile
List of Companies
Agropur
Arla Foods
Dairy Farmers of America
Danone S.A.
Dean Foods
DMK
Fonterra
Lactalis
Meiji Co. Ltd
Mengniu
Muller
Nestlé S.A.
Royal FrieslandCampina N.V.
Saputo
Savencia
Schreiber Foods
Sodiaal
The Kraft Heinz Company
Unilever
Yili
15. Methodology and Data Sources
15.1 Customization Offerings
15.2 Subscription Services
15.3 Related Reports
15.4 Publisher Expertise
LIST OF TABLES
Table 1 Market Segmentation Analysis
Table 2 Global Dairy Foods and Beverages Market Share of Leading Companies, 2023
Table 3 Product Offerings of Leading Companies
Table 4 Low Growth Scenario Forecasts
Table 5 Reference Case Growth Scenario
Table 6 High Growth Case Scenario
Table 7 Global Dairy Foods and Beverages Revenue (USD Million) And CAGR (%) By Type (2021-2032)
Table 8 Global Dairy Foods and Beverages Revenue (USD Million) And CAGR (%) By Application (2021-2032)
Table 9 Global Dairy Foods and Beverages Revenue (USD Million) And CAGR (%) By Product (2021-2032)
Table 10 Global Dairy Foods and Beverages Market Revenue (USD Million) By Regions (2021-2032)
Table 11 Global Dairy Foods and Beverages Market Share (%) By Regions (2021-2032)
Table 12 North America Dairy Foods and Beverages Revenue (USD Million) By Country (2021-2032)
Table 13 Europe Dairy Foods and Beverages Revenue (USD Million) By Country (2021-2032)
Table 14 Asia Pacific Dairy Foods and Beverages Revenue (USD Million) By Country (2021-2032)
Table 15 South America Dairy Foods and Beverages Revenue (USD Million) By Country (2021-2032)
Table 16 Middle East and Africa Dairy Foods and Beverages Revenue (USD Million) By Region (2021-2032)
Table 17 North America Dairy Foods and Beverages Revenue (USD Million) By Type (2021-2032)
Table 18 North America Dairy Foods and Beverages Revenue (USD Million) By Application (2021-2032)
Table 19 North America Dairy Foods and Beverages Revenue (USD Million) By Product (2021-2032)
Table 20 Europe Dairy Foods and Beverages Revenue (USD Million) By Type (2021-2032)
Table 21 Europe Dairy Foods and Beverages Revenue (USD Million) By Application (2021-2032)
Table 22 Europe Dairy Foods and Beverages Revenue (USD Million) By Product (2021-2032)
Table 23 Asia Pacific Dairy Foods and Beverages Revenue (USD Million) By Type (2021-2032)
Table 24 Asia Pacific Dairy Foods and Beverages Revenue (USD Million) By Application (2021-2032)
Table 25 Asia Pacific Dairy Foods and Beverages Revenue (USD Million) By Product (2021-2032)
Table 26 South America Dairy Foods and Beverages Revenue (USD Million) By Type (2021-2032)
Table 27 South America Dairy Foods and Beverages Revenue (USD Million) By Application (2021-2032)
Table 28 South America Dairy Foods and Beverages Revenue (USD Million) By Product (2021-2032)
Table 29 Middle East and Africa Dairy Foods and Beverages Revenue (USD Million) By Type (2021-2032)
Table 30 Middle East and Africa Dairy Foods and Beverages Revenue (USD Million) By Application (2021-2032)
Table 31 Middle East and Africa Dairy Foods and Beverages Revenue (USD Million) By Product (2021-2032)
LIST OF FIGURES
Figure 1. Market Scope
Figure 2. Pricing Forecasts Per Unit, 2023- 2032
Figure 3. Porter’s Five Forces
Figure 4. Global Dairy Foods and Beverages Market Revenue (USD Million) By Regions (2021-2032)
Figure 5. Global Dairy Foods and Beverages Market Share (%) By Regions (2023)
Figure 6. North America Dairy Foods and Beverages Revenue (USD Million) By Country (2021-2032)
Figure 7. United States Dairy Foods and Beverages Revenue (USD Million) By Country (2021-2032)
Figure 8. Canada Dairy Foods and Beverages Revenue (USD Million) By Country (2021-2032)
Figure 9. Mexico Dairy Foods and Beverages Revenue (USD Million) By Country (2021-2032)
Figure 10. Europe Dairy Foods and Beverages Revenue (USD Million) By Country (2021-2032)
Figure 11. Germany Dairy Foods and Beverages Revenue (USD Million) By Country (2021-2032)
Figure 12. France Dairy Foods and Beverages Revenue (USD Million) By Country (2021-2032)
Figure 13. United Kingdom Dairy Foods and Beverages Revenue (USD Million) By Country (2021-2032)
Figure 14. Spain Dairy Foods and Beverages Revenue (USD Million) By Country (2021-2032)
Figure 15. Italy Dairy Foods and Beverages Revenue (USD Million) By Country (2021-2032)
Figure 16. Russia Dairy Foods and Beverages Revenue (USD Million) By Country (2021-2032)
Figure 17. Rest of Europe Dairy Foods and Beverages Revenue (USD Million) By Country (2021-2032)
Figure 11. Asia Pacific Dairy Foods and Beverages Revenue (USD Million) By Country (2021-2032)
Figure 12. China Dairy Foods and Beverages Revenue (USD Million) By Country (2021-2032)
Figure 13. Japan Dairy Foods and Beverages Revenue (USD Million) By Country (2021-2032)
Figure 14. India Dairy Foods and Beverages Revenue (USD Million) By Country (2021-2032)
Figure 15. South Korea Dairy Foods and Beverages Revenue (USD Million) By Country (2021-2032)
Figure 16. Australia Dairy Foods and Beverages Revenue (USD Million) By Country (2021-2032)
Figure 17. South East Asia Dairy Foods and Beverages Revenue (USD Million) By Country (2021-2032)
Figure 18. South America Dairy Foods and Beverages Revenue (USD Million) By Country (2021-2032)
Figure 19. Brazil Dairy Foods and Beverages Revenue (USD Million) By Country (2021-2032)
Figure 20. Argentina Dairy Foods and Beverages Revenue (USD Million) By Country (2021-2032)
Figure 21. Rest of Asia Pacific Dairy Foods and Beverages Revenue (USD Million) By Country (2021-2032)
Figure 22. Middle East and Africa Dairy Foods and Beverages Revenue (USD Million) By Region (2021-2032)
Figure 23. Saudi Arabia Dairy Foods and Beverages Revenue (USD Million) By Region (2021-2032)
Figure 24. The UAE Dairy Foods and Beverages Revenue (USD Million) By Region (2021-2032)
Figure 25. Rest of Middle East Dairy Foods and Beverages Revenue (USD Million) By Region (2021-2032)
Figure 26. South Africa Dairy Foods and Beverages Revenue (USD Million) By Region (2021-2032)
Figure 27. Africa Dairy Foods and Beverages Revenue (USD Million) By Region (2021-2032)
Figure 28. North America Dairy Foods and Beverages Revenue (USD Million) By Type (2021-2032)
Figure 29. North America Dairy Foods and Beverages Revenue (USD Million) By Application (2021-2032)
Figure 30. North America Dairy Foods and Beverages Revenue (USD Million) By Product (2021-2032)
Figure 31. Europe Dairy Foods and Beverages Revenue (USD Million) By Type (2021-2032)
Figure 32. Europe Dairy Foods and Beverages Revenue (USD Million) By Application (2021-2032)
Figure 33. Europe Dairy Foods and Beverages Revenue (USD Million) By Product (2021-2032)
Figure 34. Asia Pacific Dairy Foods and Beverages Revenue (USD Million) By Type (2021-2032)
Figure 35. Asia Pacific Dairy Foods and Beverages Revenue (USD Million) By Application (2021-2032)
Figure 36. Asia Pacific Dairy Foods and Beverages Revenue (USD Million) By Product (2021-2032)
Figure 37. South America Dairy Foods and Beverages Revenue (USD Million) By Type (2021-2032)
Figure 38. South America Dairy Foods and Beverages Revenue (USD Million) By Application (2021-2032)
Figure 39. South America Dairy Foods and Beverages Revenue (USD Million) By Product (2021-2032)
Figure 40. Middle East and Africa Dairy Foods and Beverages Revenue (USD Million) By Type (2021-2032)
Figure 41. Middle East and Africa Dairy Foods and Beverages Revenue (USD Million) By Application (2021-2032)
Figure 42. Middle East and Africa Dairy Foods and Beverages Revenue (USD Million) By Product (2021-2032)
By Type
Milk
Butter and Ghee
Cheese
Ice Cream
Yoghurt
Milk Powder
Others
By Application
Frozen Food
Bakery and Confectionary
Clinical Nutrition
Channel
By Channel
Direct Sales
Distribution Channel
Countries Analyzed
North America (US, Canada, Mexico)
Europe (Germany, UK, France, Spain, Italy, Russia, Rest of Europe)
Asia Pacific (China, India, Japan, South Korea, Australia, South East Asia, Rest of Asia)
South America (Brazil, Argentina, Rest of South America)
Middle East and Africa (Saudi Arabia, UAE, Rest of Middle East, South Africa, Egypt, Rest of Africa)
