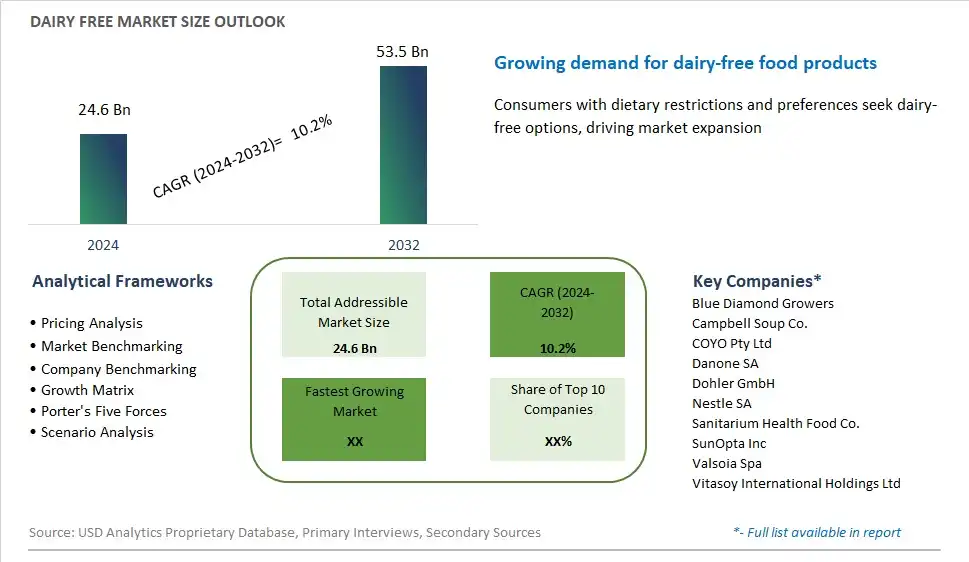
Global Dairy Free Market Size is valued at $24.6 Billion in 2024 and is forecast to register a growth rate (CAGR) of 10.2% to reach $53.5 Billion by 2032.
The global Dairy Free Market Comprehensive Study analyzes and forecasts the market size across 6 regions and 24 countries for diverse segments -By Type (Beverages, Foods), By Distribution Channel (Supermarkets/Hypermarkets, Convenience Stores, Online Retail, Others)
An Introduction to Dairy Free Market
In 2024, the dairy-free market segment is thriving as consumers increasingly seek alternatives to dairy products due to lactose intolerance, dietary preferences, and health concerns. Dairy-free products exclude all forms of dairy-derived ingredients, including milk, cheese, yogurt, and butter, catering to individuals with lactose intolerance, dairy allergies, or those following vegan or plant-based diets. The market is driven by factors such as growing awareness of lactose intolerance, rising demand for plant-based foods, and the availability of innovative dairy-free alternatives that replicate the taste and texture of traditional dairy products. Moreover, advancements in food science, ingredient sourcing, and formulation techniques ensure that dairy-free products offer nutritional benefits, flavor variety, and culinary versatility to meet the diverse needs and preferences of consumers. As the dairy-free movement continues to gain momentum and influence purchasing decisions, the market presents opportunities for manufacturers to innovate, expand product offerings, and capture market share in a competitive and rapidly growing segment of the food industry.
Dairy Free Competitive Landscape
The market report analyses the leading companies in the industry including Blue Diamond Growers, Campbell Soup Co., COYO Pty Ltd, Danone SA, Dohler GmbH, Nestle SA, Sanitarium Health Food Co., SunOpta Inc, Valsoia Spa, Vitasoy International Holdings Ltd, and Others.
Dairy Free Market Dynamics
Dairy Free Market Trend: Growing Consumer Demand for Dairy-Free Products
A significant trend in the dairy-free market is the increasing consumer demand for dairy-free products across various categories, including milk, yogurt, cheese, and ice cream. This trend is driven by several factors, including health concerns, dietary restrictions, and ethical considerations. More consumers are opting for dairy-free alternatives due to lactose intolerance, milk allergies, or concerns about the environmental impact of dairy farming. Additionally, the rise of veganism and plant-based diets has contributed to the mainstream acceptance of dairy-free options. As a result, manufacturers are expanding their dairy-free product lines and investing in research and development to meet the evolving preferences of consumers.
Market Driver: Health Consciousness and Wellness Trends
A key driver behind the growth of the dairy-free market is the increasing emphasis on health consciousness and wellness trends among consumers. Many individuals are becoming more aware of the potential health risks associated with consuming dairy products, such as high cholesterol and saturated fats. As a result, they are seeking healthier alternatives that offer similar taste and nutritional benefits without the drawbacks of dairy. Dairy-free products are often perceived as being lower in calories, cholesterol-free, and rich in vitamins and minerals, making them a preferred choice for health-conscious consumers. Moreover, dairy-free options are often fortified with additional nutrients, such as calcium and vitamin D, further enhancing their nutritional value and appeal.
Market Opportunity: Expansion into Convenience and On-the-Go Formats
An opportunity for the dairy-free market lies in the expansion into convenience and on-the-go formats to cater to the busy lifestyles of modern consumers. With an increasing demand for convenient and portable food and beverage options, dairy-free manufacturers can capitalize on this trend by offering products in single-serve packaging, grab-and-go formats, and ready-to-drink beverages. This includes dairy-free milk alternatives in tetra packs, yogurt cups, cheese snacks, and individually portioned ice cream treats. By providing convenient options for consumption outside the home, such as at work, school, or while traveling, dairy-free brands can enhance accessibility and appeal to a wider audience, driving sales growth and market expansion.
Dairy Free Market Share Analysis: Beverages held the dominant market share in 2024
In the Dairy-Free Market segmented by type, the largest segment is Beverages, primarily due to the increasing demand for dairy alternatives among consumers seeking plant-based options for their beverages. Dairy-free beverages encompass a wide range of products such as almond milk, soy milk, oat milk, coconut milk, and others, offering consumers a variety of choices to suit their taste preferences and dietary needs. These beverages are popular among individuals with lactose intolerance, dairy allergies, or those following vegan or plant-based diets. Additionally, dairy-free beverages are versatile ingredients used in various recipes, including smoothies, coffee drinks, teas, and protein shakes, contributing to their widespread consumption. Further, the growing awareness of the environmental impact of dairy farming and the health benefits associated with plant-based diets further drive the demand for dairy-free beverages. While dairy-free foods also hold significance in the market, the Beverages segment maintains its dominance, reflecting consumers' preference for convenient and versatile alternatives to traditional dairy products.
Dairy Free Market Share Analysis: Online Retail market is poised to register the fastest growth rae over the forecast period to 2032
In the Dairy-Free Market segmented by distribution channel, the fastest-growing segment is Online Retail, fueled by the increasing popularity of e-commerce platforms and the convenience they offer to consumers seeking dairy-free alternatives. Online retail channels provide a convenient and accessible platform for consumers to explore a wide variety of dairy-free products, including beverages, foods, and snacks, from the comfort of their homes. With the rise of digitalization and the COVID-19 pandemic accelerating online shopping trends, consumers are increasingly turning to online platforms to purchase their groceries and specialty items, including dairy-free products. Additionally, online retailers often offer a broader selection of dairy-free brands and products compared to brick-and-mortar stores, allowing consumers to discover new options and cater to specific dietary preferences. The convenience of doorstep delivery and the availability of subscription services further contribute to the growth of online retail in the Dairy-Free market, appealing to busy consumers seeking convenience and accessibility in their shopping experience. While supermarkets/hypermarkets and convenience stores remain significant distribution channels, the Online Retail segment demonstrates rapid expansion, reflecting evolving consumer preferences and the digital transformation of the retail landscape.
Dairy Free Market Segmentation
By Type
Beverages
Foods
By Distribution Channel
Supermarkets/Hypermarkets
Convenience Stores
Online Retail
Others
Countries Analyzed
North America (US, Canada, Mexico)
Europe (Germany, UK, France, Spain, Italy, Russia, Rest of Europe)
Asia Pacific (China, India, Japan, South Korea, Australia, South East Asia, Rest of Asia)
South America (Brazil, Argentina, Rest of South America)
Middle East and Africa (Saudi Arabia, UAE, Rest of Middle East, South Africa, Egypt, Rest of Africa)
Dairy Free Companies Profiled in the Study
Blue Diamond Growers
Campbell Soup Co.
COYO Pty Ltd
Danone SA
Dohler GmbH
Nestle SA
Sanitarium Health Food Co.
SunOpta Inc
Valsoia Spa
Vitasoy International Holdings Ltd
*- List Not Exhaustive
Chapter 1. TABLE OF CONTENTS
Chapter 2. Introduction to Dairy Free Market
2.1. Market Overview
2.2. Key Statistics and Report Highlights
2.3. Scope of the Comprehensive Study
2.3.1. Market Definition
2.3.2 Countries and Regions Covered
2.3.3 Research Objective
2.3.4 Units, Currency, and Conversions
2.3.5 Industry Value Chain
2.4. Key Market Segments
2.5. Key Companies
2.6. Study Period
Chapter 3. Strategic Analysis Review
3.1. Dairy Free Pricing Analysis and Forecast
3.2. Porter’s Five Forces
3.3. Market Ecosystem
3.4. SWOT Analysis
3.5. Regulatory Scenario
3.3. Effects of Inflation, Russia-Ukraine War, moderating economic growth, and other macroeconomic factors
Chapter 4. Competitive Landscape
4.1. Market Share Analysis
4.1.1. Global Dairy Free Market Share by Company, 2023
4.1.2. Product Offerings of Leading Dairy Free Companies
4.2. Market Entropy
4.2.1. New Product Launches in the Industry
4.2.2. Mergers, Acquisitions, Joint ventures, and Partnerships
4.3. Key Strategies and Best Practices
Chapter 5. Global Market Projections: Best, Reference, and Low Case Scenarios
5.1. Growth Analysis- Case Scenario Definitions
5.2. Low Growth Case Scenario Forecasts
5.3. Reference Growth Case Scenario Forecasts
5.4. High Growth Case Scenario Forecasts
Chapter 6. Market Dynamics
6.1. Dairy Free Market Drivers
6.2. Dairy Free Market Challenges
6.6. Dairy Free Market Opportunities
6.4. Dairy Free Market Trends
Chapter 7. Global Dairy Free Market Outlook Trends
7.1. Global Dairy Free Revenue (USD Million) and CAGR (%) by Type (2021-2032)
7.2. Global Dairy Free Revenue (USD Million) and CAGR (%) by Application (2021-2032)
7.3. Global Dairy Free Revenue (USD Million) and CAGR (%) by Product (2021-2032)
By Type
Beverages
Foods
By Distribution Channel
Supermarkets/Hypermarkets
Convenience Stores
Online Retail
Others
Chapter 8. Global Dairy Free Regional Analysis and Outlook
8.1. Global Dairy Free Revenue (USD Million) By Regions (2021- 2032)
8.2. North America Dairy Free Revenue (USD Million) by Country (2021-2032)
8.2.1. United States Dairy Free Regional Analysis and Outlook
8.2.2. Canada Dairy Free Regional Analysis and Outlook
8.2.3. Mexico Dairy Free Regional Analysis and Outlook
8.3. Europe Dairy Free Revenue (USD Million), by Country (2021-2032)
8.3.1. Germany Dairy Free Regional Analysis and Outlook
8.3.2. France Dairy Free Regional Analysis and Outlook
8.3.3. United Kingdom Dairy Free Regional Analysis and Outlook
8.3.4. Spain Dairy Free Regional Analysis and Outlook
8.3.5. Italy Dairy Free Regional Analysis and Outlook
8.3.6. Russia Dairy Free Regional Analysis and Outlook
8.3.7. Rest of Europe Dairy Free Regional Analysis and Outlook
8.4. Asia Pacific Dairy Free Revenue (USD Million) by Country (2021-2032)
8.4.1. China Dairy Free Regional Analysis and Outlook
8.4.2. Japan Dairy Free Regional Analysis and Outlook
8.4.3. India Dairy Free Regional Analysis and Outlook
8.4.4. South Korea Dairy Free Regional Analysis and Outlook
8.4.5. Australia Dairy Free Regional Analysis and Outlook
8.4.6. South East Asia Dairy Free Regional Analysis and Outlook
8.4.7. Rest of Asia Pacific Dairy Free Regional Analysis and Outlook
8.5. South America Dairy Free Revenue (USD Million), by Country (2021-2032)
8.5.1. Brazil Dairy Free Regional Analysis and Outlook
8.5.2. Argentina Dairy Free Regional Analysis and Outlook
8.5.3. Rest of South America Dairy Free Regional Analysis and Outlook
8.6. Middle East and Africa Dairy Free Revenue (USD Million) by Country (2021-2032)
8.6.1. Middle East Dairy Free Regional Analysis and Outlook
8.6.2. Africa Dairy Free Regional Analysis and Outlook
Chapter 9. North America Dairy Free Analysis and Outlook
9.1. North America Dairy Free Revenue (USD Million) by Segments (2021-2032)
9.1.1. North America Dairy Free Revenue (USD Million) by Type (2021-2032)
9.1.2. North America Dairy Free Revenue (USD Million) by Application (2021-2032)
9.1.3. North America Dairy Free Revenue (USD Million) by Product (2021-2032)
By Type
Beverages
Foods
By Distribution Channel
Supermarkets/Hypermarkets
Convenience Stores
Online Retail
Others
Chapter 10. Europe Dairy Free Analysis and Outlook
10.1. Europe Dairy Free Revenue (USD Million), by Segments (USD Million) (2021-2032)
10.1.1. Europe Dairy Free Revenue (USD Million) by Type (2021-2032)
10.1.2. Europe Dairy Free Revenue (USD Million) by Application (2021-2032)
10.1.3. Europe Dairy Free Revenue (USD Million) by Product (2021-2032)
By Type
Beverages
Foods
By Distribution Channel
Supermarkets/Hypermarkets
Convenience Stores
Online Retail
Others
Chapter 11. Asia Pacific Dairy Free Analysis and Outlook
11.1. Asia Pacific Dairy Free Revenue (USD Million), and Revenue (USD Million) by Segments (2021-2032)
11.1.1. Asia Pacific Dairy Free Revenue (USD Million) by Type (2021-2032)
11.1.2. Asia Pacific Dairy Free Revenue (USD Million) by Application (2021-2032)
11.1.3. Asia Pacific Dairy Free Revenue (USD Million) by Product (2021-2032)
By Type
Beverages
Foods
By Distribution Channel
Supermarkets/Hypermarkets
Convenience Stores
Online Retail
Others
Chapter 12. South America Dairy Free Analysis and Outlook
12.1. South America Dairy Free Revenue (USD Million), by Segments (2021-2032)
12.1.1. South America Dairy Free Revenue (USD Million) by Type (2021-2032)
12.1.2. South America Dairy Free Revenue (USD Million) by Application (2021-2032)
12.1.3. South America Dairy Free Revenue (USD Million) by Product (2021-2032)
By Type
Beverages
Foods
By Distribution Channel
Supermarkets/Hypermarkets
Convenience Stores
Online Retail
Others
Chapter 13. Middle East and Africa Dairy Free Analysis and Outlook
13.1. Middle East and Africa Dairy Free Revenue (USD Million), by Segments (2021-2032)
13.1.1. Middle East and Africa Dairy Free Revenue (USD Million) by Type (2021-2032)
13.1.2. Middle East and Africa Dairy Free Revenue (USD Million) by Application (2021-2032)
13.1.3. Middle East and Africa Dairy Free Revenue (USD Million) by Product (2021-2032)
By Type
Beverages
Foods
By Distribution Channel
Supermarkets/Hypermarkets
Convenience Stores
Online Retail
Others
Chapter 14. Dairy Free Company Profiles
14.1 Business Overview
14.2 Product Profiles
14.3 SWOT Profiles
14.5 Recent Developments
14.6 Financial Profile
List of Companies
Blue Diamond Growers
Campbell Soup Co.
COYO Pty Ltd
Danone SA
Dohler GmbH
Nestle SA
Sanitarium Health Food Co.
SunOpta Inc
Valsoia Spa
Vitasoy International Holdings Ltd
15. Methodology and Data Sources
15.1 Customization Offerings
15.2 Subscription Services
15.3 Related Reports
15.4 Publisher Expertise
LIST OF TABLES
Table 1 Market Segmentation Analysis
Table 2 Global Dairy Free Market Share of Leading Companies, 2023
Table 3 Product Offerings of Leading Companies
Table 4 Low Growth Scenario Forecasts
Table 5 Reference Case Growth Scenario
Table 6 High Growth Case Scenario
Table 7 Global Dairy Free Revenue (USD Million) And CAGR (%) By Type (2021-2032)
Table 8 Global Dairy Free Revenue (USD Million) And CAGR (%) By Application (2021-2032)
Table 9 Global Dairy Free Revenue (USD Million) And CAGR (%) By Product (2021-2032)
Table 10 Global Dairy Free Market Revenue (USD Million) By Regions (2021-2032)
Table 11 Global Dairy Free Market Share (%) By Regions (2021-2032)
Table 12 North America Dairy Free Revenue (USD Million) By Country (2021-2032)
Table 13 Europe Dairy Free Revenue (USD Million) By Country (2021-2032)
Table 14 Asia Pacific Dairy Free Revenue (USD Million) By Country (2021-2032)
Table 15 South America Dairy Free Revenue (USD Million) By Country (2021-2032)
Table 16 Middle East and Africa Dairy Free Revenue (USD Million) By Region (2021-2032)
Table 17 North America Dairy Free Revenue (USD Million) By Type (2021-2032)
Table 18 North America Dairy Free Revenue (USD Million) By Application (2021-2032)
Table 19 North America Dairy Free Revenue (USD Million) By Product (2021-2032)
Table 20 Europe Dairy Free Revenue (USD Million) By Type (2021-2032)
Table 21 Europe Dairy Free Revenue (USD Million) By Application (2021-2032)
Table 22 Europe Dairy Free Revenue (USD Million) By Product (2021-2032)
Table 23 Asia Pacific Dairy Free Revenue (USD Million) By Type (2021-2032)
Table 24 Asia Pacific Dairy Free Revenue (USD Million) By Application (2021-2032)
Table 25 Asia Pacific Dairy Free Revenue (USD Million) By Product (2021-2032)
Table 26 South America Dairy Free Revenue (USD Million) By Type (2021-2032)
Table 27 South America Dairy Free Revenue (USD Million) By Application (2021-2032)
Table 28 South America Dairy Free Revenue (USD Million) By Product (2021-2032)
Table 29 Middle East and Africa Dairy Free Revenue (USD Million) By Type (2021-2032)
Table 30 Middle East and Africa Dairy Free Revenue (USD Million) By Application (2021-2032)
Table 31 Middle East and Africa Dairy Free Revenue (USD Million) By Product (2021-2032)
LIST OF FIGURES
Figure 1. Market Scope
Figure 2. Pricing Forecasts Per Unit, 2023- 2032
Figure 3. Porter’s Five Forces
Figure 4. Global Dairy Free Market Revenue (USD Million) By Regions (2021-2032)
Figure 5. Global Dairy Free Market Share (%) By Regions (2023)
Figure 6. North America Dairy Free Revenue (USD Million) By Country (2021-2032)
Figure 7. United States Dairy Free Revenue (USD Million) By Country (2021-2032)
Figure 8. Canada Dairy Free Revenue (USD Million) By Country (2021-2032)
Figure 9. Mexico Dairy Free Revenue (USD Million) By Country (2021-2032)
Figure 10. Europe Dairy Free Revenue (USD Million) By Country (2021-2032)
Figure 11. Germany Dairy Free Revenue (USD Million) By Country (2021-2032)
Figure 12. France Dairy Free Revenue (USD Million) By Country (2021-2032)
Figure 13. United Kingdom Dairy Free Revenue (USD Million) By Country (2021-2032)
Figure 14. Spain Dairy Free Revenue (USD Million) By Country (2021-2032)
Figure 15. Italy Dairy Free Revenue (USD Million) By Country (2021-2032)
Figure 16. Russia Dairy Free Revenue (USD Million) By Country (2021-2032)
Figure 17. Rest of Europe Dairy Free Revenue (USD Million) By Country (2021-2032)
Figure 11. Asia Pacific Dairy Free Revenue (USD Million) By Country (2021-2032)
Figure 12. China Dairy Free Revenue (USD Million) By Country (2021-2032)
Figure 13. Japan Dairy Free Revenue (USD Million) By Country (2021-2032)
Figure 14. India Dairy Free Revenue (USD Million) By Country (2021-2032)
Figure 15. South Korea Dairy Free Revenue (USD Million) By Country (2021-2032)
Figure 16. Australia Dairy Free Revenue (USD Million) By Country (2021-2032)
Figure 17. South East Asia Dairy Free Revenue (USD Million) By Country (2021-2032)
Figure 18. South America Dairy Free Revenue (USD Million) By Country (2021-2032)
Figure 19. Brazil Dairy Free Revenue (USD Million) By Country (2021-2032)
Figure 20. Argentina Dairy Free Revenue (USD Million) By Country (2021-2032)
Figure 21. Rest of Asia Pacific Dairy Free Revenue (USD Million) By Country (2021-2032)
Figure 22. Middle East and Africa Dairy Free Revenue (USD Million) By Region (2021-2032)
Figure 23. Saudi Arabia Dairy Free Revenue (USD Million) By Region (2021-2032)
Figure 24. The UAE Dairy Free Revenue (USD Million) By Region (2021-2032)
Figure 25. Rest of Middle East Dairy Free Revenue (USD Million) By Region (2021-2032)
Figure 26. South Africa Dairy Free Revenue (USD Million) By Region (2021-2032)
Figure 27. Africa Dairy Free Revenue (USD Million) By Region (2021-2032)
Figure 28. North America Dairy Free Revenue (USD Million) By Type (2021-2032)
Figure 29. North America Dairy Free Revenue (USD Million) By Application (2021-2032)
Figure 30. North America Dairy Free Revenue (USD Million) By Product (2021-2032)
Figure 31. Europe Dairy Free Revenue (USD Million) By Type (2021-2032)
Figure 32. Europe Dairy Free Revenue (USD Million) By Application (2021-2032)
Figure 33. Europe Dairy Free Revenue (USD Million) By Product (2021-2032)
Figure 34. Asia Pacific Dairy Free Revenue (USD Million) By Type (2021-2032)
Figure 35. Asia Pacific Dairy Free Revenue (USD Million) By Application (2021-2032)
Figure 36. Asia Pacific Dairy Free Revenue (USD Million) By Product (2021-2032)
Figure 37. South America Dairy Free Revenue (USD Million) By Type (2021-2032)
Figure 38. South America Dairy Free Revenue (USD Million) By Application (2021-2032)
Figure 39. South America Dairy Free Revenue (USD Million) By Product (2021-2032)
Figure 40. Middle East and Africa Dairy Free Revenue (USD Million) By Type (2021-2032)
Figure 41. Middle East and Africa Dairy Free Revenue (USD Million) By Application (2021-2032)
Figure 42. Middle East and Africa Dairy Free Revenue (USD Million) By Product (2021-2032)
By Type
Beverages
Foods
By Distribution Channel
Supermarkets/Hypermarkets
Convenience Stores
Online Retail
Others
Countries Analyzed
North America (US, Canada, Mexico)
Europe (Germany, UK, France, Spain, Italy, Russia, Rest of Europe)
Asia Pacific (China, India, Japan, South Korea, Australia, South East Asia, Rest of Asia)
South America (Brazil, Argentina, Rest of South America)
Middle East and Africa (Saudi Arabia, UAE, Rest of Middle East, South Africa, Egypt, Rest of Africa)
