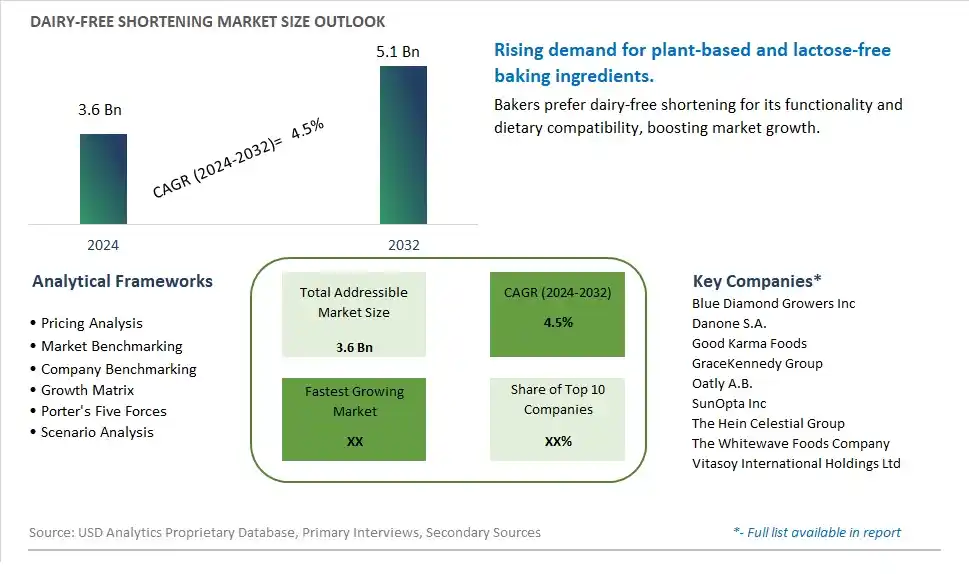
Global Dairy-Free Shortening Market Size is valued at $3.6 Billion in 2024 and is forecast to register a growth rate (CAGR) of 4.5% to reach $5.1 Billion by 2032.
The global Dairy-Free Shortening Market Comprehensive Study analyzes and forecasts the market size across 6 regions and 24 countries for diverse segments -By Product (Beverages, Milk, Dairy-free Kefir, Bakery Products), By Application (Household, Commercial)
An Introduction to Dairy-Free Shortening Market
The Dairy-Free Shortening Market involves the production and sale of shortening made from plant-based ingredients, catering to consumers seeking dairy-free and lactose-free options. These shortenings are used in baking and cooking to provide texture and flavor. The market is driven by increasing prevalence of lactose intolerance and dairy allergies, rising popularity of vegan and plant-based diets, and growing demand for convenient and high-quality baking ingredients. Additionally, advancements in shortening formulations and the expansion of product offerings support market growth.
Dairy Free Shortening Competitive Landscape
The market report analyses the leading companies in the industry including Blue Diamond Growers Inc, Danone S.A., Good Karma Foods, GraceKennedy Group, Oatly A.B., SunOpta Inc, The Hein Celestial Group, The Whitewave Foods Company, Vitasoy International Holdings Ltd, and Others.
Dairy Free Shortening Market Dynamics
Market Trend: Shift Towards Healthier and Plant-Based Ingredients
A prominent trend in the dairy-free shortening market is the shift towards healthier and plant-based ingredients. With increasing consumer awareness about the health impacts of saturated fats and cholesterol, there is a growing demand for shortening alternatives made from plant sources such as palm oil, coconut oil, and vegetable oils. This trend is driven by health-conscious choices, dietary preferences, and the desire for cleaner label products without compromising on functionality in baking and cooking applications.
Market Driver: Dietary Restrictions and Allergen Concerns
A key driver influencing the dairy-free shortening market is the rise in dietary restrictions and allergen concerns among consumers. Factors such as lactose intolerance, dairy allergies, veganism, and gluten-free diets are driving the demand for shortening options that are free from dairy ingredients. This driver is pushing manufacturers to innovate and develop dairy-free shortening products that not only provide the desired texture and performance in baked goods but also meet the needs of consumers with specific dietary requirements and allergen sensitivities.
Market Opportunity: Expansion into Health-Conscious and Specialty Segments
An exciting opportunity in the dairy-free shortening market lies in the expansion into health-conscious and specialty segments. As more consumers prioritize health and wellness, there is a demand for dairy-free shortening products that offer additional nutritional benefits, such as being non-GMO, organic, trans-fat-free, and cholesterol-free. Manufacturers can capitalize on this opportunity by introducing specialty dairy-free shortening variants tailored to specific dietary preferences and lifestyle choices. This expansion into health-conscious and specialty segments allows companies to differentiate their products, attract a broader consumer base, and tap into emerging trends in the baking and food industry.
Dairy-Free Shortening Market Share Analysis- Largest Segment by Product
The Bakery Products segment is the largest in the Dairy-Free Shortening Market by product. This dominance is driven by the extensive use of shortening in the baking industry, where it plays a crucial role in achieving the desired texture and consistency of baked goods. Dairy-free shortening is increasingly preferred in bakery products due to the rising demand for vegan and lactose-free options among consumers. The versatility of shortening in various baked items, including cakes, cookies, pastries, and bread, contributes to its significant market share. Additionally, the continuous innovation in dairy-free shortening formulations, such as those offering better taste, texture, and nutritional benefits, enhances their appeal in the bakery sector. The increasing number of health-conscious consumers and the growing trend of veganism and plant-based diets further support the dominance of the bakery products segment in the dairy-free shortening market.
Dairy-Free Shortening Market Share Analysis- Fastest Growing Segment by Application
The Commercial segment is poised to grow the fastest in the Dairy-Free Shortening Market by application over the next five years. This rapid growth is driven by the increasing demand for dairy-free baked goods and confections in restaurants, cafes, bakeries, and other foodservice establishments. The rising trend of offering vegan and lactose-free options on menus to cater to diverse consumer preferences supports the adoption of dairy-free shortening in commercial settings. Additionally, the continuous innovation in dairy-free shortening formulations, including improved performance and nutritional profiles, makes them appealing for use in professional baking and cooking. The growth of the foodservice industry, coupled with the increasing consumer awareness of dietary restrictions and preferences, further drives the fast growth of the commercial segment. The expansion of distribution channels and partnerships between dairy-free shortening manufacturers and foodservice providers also enhance the accessibility and adoption of these products in commercial applications.
Dairy Free Shortening Market Segmentation
By Product
Beverages
Milk
Dairy-free Kefir
Bakery Products
By Application
Household
Commercial
Countries Analyzed
North America (US, Canada, Mexico)
Europe (Germany, UK, France, Spain, Italy, Russia, Rest of Europe)
Asia Pacific (China, India, Japan, South Korea, Australia, South East Asia, Rest of Asia)
South America (Brazil, Argentina, Rest of South America)
Middle East and Africa (Saudi Arabia, UAE, Rest of Middle East, South Africa, Egypt, Rest of Africa)
Dairy Free Shortening Companies Profiled in the Study
Blue Diamond Growers Inc
Danone S.A.
Good Karma Foods
GraceKennedy Group
Oatly A.B.
SunOpta Inc
The Hein Celestial Group
The Whitewave Foods Company
Vitasoy International Holdings Ltd
*- List Not Exhaustive
Chapter 1. TABLE OF CONTENTS
Chapter 2. Introduction to Dairy Free Shortening Market
2.1. Market Overview
2.2. Key Statistics and Report Highlights
2.3. Scope of the Comprehensive Study
2.3.1. Market Definition
2.3.2 Countries and Regions Covered
2.3.3 Research Objective
2.3.4 Units, Currency, and Conversions
2.3.5 Industry Value Chain
2.4. Key Market Segments
2.5. Key Companies
2.6. Study Period
Chapter 3. Strategic Analysis Review
3.1. Dairy Free Shortening Pricing Analysis and Forecast
3.2. Porter’s Five Forces
3.3. Market Ecosystem
3.4. SWOT Analysis
3.5. Regulatory Scenario
3.3. Effects of Inflation, Russia-Ukraine War, moderating economic growth, and other macroeconomic factors
Chapter 4. Competitive Landscape
4.1. Market Share Analysis
4.1.1. Global Dairy Free Shortening Market Share by Company, 2023
4.1.2. Product Offerings of Leading Dairy Free Shortening Companies
4.2. Market Entropy
4.2.1. New Product Launches in the Industry
4.2.2. Mergers, Acquisitions, Joint ventures, and Partnerships
4.3. Key Strategies and Best Practices
Chapter 5. Global Market Projections: Best, Reference, and Low Case Scenarios
5.1. Growth Analysis- Case Scenario Definitions
5.2. Low Growth Case Scenario Forecasts
5.3. Reference Growth Case Scenario Forecasts
5.4. High Growth Case Scenario Forecasts
Chapter 6. Market Dynamics
6.1. Dairy Free Shortening Market Drivers
6.2. Dairy Free Shortening Market Challenges
6.6. Dairy Free Shortening Market Opportunities
6.4. Dairy Free Shortening Market Trends
Chapter 7. Global Dairy Free Shortening Market Outlook Trends
7.1. Global Dairy Free Shortening Revenue (USD Million) and CAGR (%) by Type (2021-2032)
7.2. Global Dairy Free Shortening Revenue (USD Million) and CAGR (%) by Application (2021-2032)
7.3. Global Dairy Free Shortening Revenue (USD Million) and CAGR (%) by Product (2021-2032)
By Product
Beverages
Milk
Dairy-free Kefir
Bakery Products
By Application
Household
Commercial
Chapter 8. Global Dairy Free Shortening Regional Analysis and Outlook
8.1. Global Dairy Free Shortening Revenue (USD Million) By Regions (2021- 2032)
8.2. North America Dairy Free Shortening Revenue (USD Million) by Country (2021-2032)
8.2.1. United States Dairy Free Shortening Regional Analysis and Outlook
8.2.2. Canada Dairy Free Shortening Regional Analysis and Outlook
8.2.3. Mexico Dairy Free Shortening Regional Analysis and Outlook
8.3. Europe Dairy Free Shortening Revenue (USD Million), by Country (2021-2032)
8.3.1. Germany Dairy Free Shortening Regional Analysis and Outlook
8.3.2. France Dairy Free Shortening Regional Analysis and Outlook
8.3.3. United Kingdom Dairy Free Shortening Regional Analysis and Outlook
8.3.4. Spain Dairy Free Shortening Regional Analysis and Outlook
8.3.5. Italy Dairy Free Shortening Regional Analysis and Outlook
8.3.6. Russia Dairy Free Shortening Regional Analysis and Outlook
8.3.7. Rest of Europe Dairy Free Shortening Regional Analysis and Outlook
8.4. Asia Pacific Dairy Free Shortening Revenue (USD Million) by Country (2021-2032)
8.4.1. China Dairy Free Shortening Regional Analysis and Outlook
8.4.2. Japan Dairy Free Shortening Regional Analysis and Outlook
8.4.3. India Dairy Free Shortening Regional Analysis and Outlook
8.4.4. South Korea Dairy Free Shortening Regional Analysis and Outlook
8.4.5. Australia Dairy Free Shortening Regional Analysis and Outlook
8.4.6. South East Asia Dairy Free Shortening Regional Analysis and Outlook
8.4.7. Rest of Asia Pacific Dairy Free Shortening Regional Analysis and Outlook
8.5. South America Dairy Free Shortening Revenue (USD Million), by Country (2021-2032)
8.5.1. Brazil Dairy Free Shortening Regional Analysis and Outlook
8.5.2. Argentina Dairy Free Shortening Regional Analysis and Outlook
8.5.3. Rest of South America Dairy Free Shortening Regional Analysis and Outlook
8.6. Middle East and Africa Dairy Free Shortening Revenue (USD Million) by Country (2021-2032)
8.6.1. Middle East Dairy Free Shortening Regional Analysis and Outlook
8.6.2. Africa Dairy Free Shortening Regional Analysis and Outlook
Chapter 9. North America Dairy Free Shortening Analysis and Outlook
9.1. North America Dairy Free Shortening Revenue (USD Million) by Segments (2021-2032)
9.1.1. North America Dairy Free Shortening Revenue (USD Million) by Type (2021-2032)
9.1.2. North America Dairy Free Shortening Revenue (USD Million) by Application (2021-2032)
9.1.3. North America Dairy Free Shortening Revenue (USD Million) by Product (2021-2032)
By Product
Beverages
Milk
Dairy-free Kefir
Bakery Products
By Application
Household
Commercial
Chapter 10. Europe Dairy Free Shortening Analysis and Outlook
10.1. Europe Dairy Free Shortening Revenue (USD Million), by Segments (USD Million) (2021-2032)
10.1.1. Europe Dairy Free Shortening Revenue (USD Million) by Type (2021-2032)
10.1.2. Europe Dairy Free Shortening Revenue (USD Million) by Application (2021-2032)
10.1.3. Europe Dairy Free Shortening Revenue (USD Million) by Product (2021-2032)
By Product
Beverages
Milk
Dairy-free Kefir
Bakery Products
By Application
Household
Commercial
Chapter 11. Asia Pacific Dairy Free Shortening Analysis and Outlook
11.1. Asia Pacific Dairy Free Shortening Revenue (USD Million), and Revenue (USD Million) by Segments (2021-2032)
11.1.1. Asia Pacific Dairy Free Shortening Revenue (USD Million) by Type (2021-2032)
11.1.2. Asia Pacific Dairy Free Shortening Revenue (USD Million) by Application (2021-2032)
11.1.3. Asia Pacific Dairy Free Shortening Revenue (USD Million) by Product (2021-2032)
By Product
Beverages
Milk
Dairy-free Kefir
Bakery Products
By Application
Household
Commercial
Chapter 12. South America Dairy Free Shortening Analysis and Outlook
12.1. South America Dairy Free Shortening Revenue (USD Million), by Segments (2021-2032)
12.1.1. South America Dairy Free Shortening Revenue (USD Million) by Type (2021-2032)
12.1.2. South America Dairy Free Shortening Revenue (USD Million) by Application (2021-2032)
12.1.3. South America Dairy Free Shortening Revenue (USD Million) by Product (2021-2032)
By Product
Beverages
Milk
Dairy-free Kefir
Bakery Products
By Application
Household
Commercial
Chapter 13. Middle East and Africa Dairy Free Shortening Analysis and Outlook
13.1. Middle East and Africa Dairy Free Shortening Revenue (USD Million), by Segments (2021-2032)
13.1.1. Middle East and Africa Dairy Free Shortening Revenue (USD Million) by Type (2021-2032)
13.1.2. Middle East and Africa Dairy Free Shortening Revenue (USD Million) by Application (2021-2032)
13.1.3. Middle East and Africa Dairy Free Shortening Revenue (USD Million) by Product (2021-2032)
By Product
Beverages
Milk
Dairy-free Kefir
Bakery Products
By Application
Household
Commercial
Chapter 14. Dairy Free Shortening Company Profiles
14.1 Business Overview
14.2 Product Profiles
14.3 SWOT Profiles
14.5 Recent Developments
14.6 Financial Profile
List of Companies
Blue Diamond Growers Inc
Danone S.A.
Good Karma Foods
GraceKennedy Group
Oatly A.B.
SunOpta Inc
The Hein Celestial Group
The Whitewave Foods Company
Vitasoy International Holdings Ltd
15. Methodology and Data Sources
15.1 Customization Offerings
15.2 Subscription Services
15.3 Related Reports
15.4 Publisher Expertise
LIST OF TABLES
Table 1 Market Segmentation Analysis
Table 2 Global Dairy Free Shortening Market Share of Leading Companies, 2023
Table 3 Product Offerings of Leading Companies
Table 4 Low Growth Scenario Forecasts
Table 5 Reference Case Growth Scenario
Table 6 High Growth Case Scenario
Table 7 Global Dairy Free Shortening Revenue (USD Million) And CAGR (%) By Type (2021-2032)
Table 8 Global Dairy Free Shortening Revenue (USD Million) And CAGR (%) By Application (2021-2032)
Table 9 Global Dairy Free Shortening Revenue (USD Million) And CAGR (%) By Product (2021-2032)
Table 10 Global Dairy Free Shortening Market Revenue (USD Million) By Regions (2021-2032)
Table 11 Global Dairy Free Shortening Market Share (%) By Regions (2021-2032)
Table 12 North America Dairy Free Shortening Revenue (USD Million) By Country (2021-2032)
Table 13 Europe Dairy Free Shortening Revenue (USD Million) By Country (2021-2032)
Table 14 Asia Pacific Dairy Free Shortening Revenue (USD Million) By Country (2021-2032)
Table 15 South America Dairy Free Shortening Revenue (USD Million) By Country (2021-2032)
Table 16 Middle East and Africa Dairy Free Shortening Revenue (USD Million) By Region (2021-2032)
Table 17 North America Dairy Free Shortening Revenue (USD Million) By Type (2021-2032)
Table 18 North America Dairy Free Shortening Revenue (USD Million) By Application (2021-2032)
Table 19 North America Dairy Free Shortening Revenue (USD Million) By Product (2021-2032)
Table 20 Europe Dairy Free Shortening Revenue (USD Million) By Type (2021-2032)
Table 21 Europe Dairy Free Shortening Revenue (USD Million) By Application (2021-2032)
Table 22 Europe Dairy Free Shortening Revenue (USD Million) By Product (2021-2032)
Table 23 Asia Pacific Dairy Free Shortening Revenue (USD Million) By Type (2021-2032)
Table 24 Asia Pacific Dairy Free Shortening Revenue (USD Million) By Application (2021-2032)
Table 25 Asia Pacific Dairy Free Shortening Revenue (USD Million) By Product (2021-2032)
Table 26 South America Dairy Free Shortening Revenue (USD Million) By Type (2021-2032)
Table 27 South America Dairy Free Shortening Revenue (USD Million) By Application (2021-2032)
Table 28 South America Dairy Free Shortening Revenue (USD Million) By Product (2021-2032)
Table 29 Middle East and Africa Dairy Free Shortening Revenue (USD Million) By Type (2021-2032)
Table 30 Middle East and Africa Dairy Free Shortening Revenue (USD Million) By Application (2021-2032)
Table 31 Middle East and Africa Dairy Free Shortening Revenue (USD Million) By Product (2021-2032)
LIST OF FIGURES
Figure 1. Market Scope
Figure 2. Pricing Forecasts Per Unit, 2023- 2032
Figure 3. Porter’s Five Forces
Figure 4. Global Dairy Free Shortening Market Revenue (USD Million) By Regions (2021-2032)
Figure 5. Global Dairy Free Shortening Market Share (%) By Regions (2023)
Figure 6. North America Dairy Free Shortening Revenue (USD Million) By Country (2021-2032)
Figure 7. United States Dairy Free Shortening Revenue (USD Million) By Country (2021-2032)
Figure 8. Canada Dairy Free Shortening Revenue (USD Million) By Country (2021-2032)
Figure 9. Mexico Dairy Free Shortening Revenue (USD Million) By Country (2021-2032)
Figure 10. Europe Dairy Free Shortening Revenue (USD Million) By Country (2021-2032)
Figure 11. Germany Dairy Free Shortening Revenue (USD Million) By Country (2021-2032)
Figure 12. France Dairy Free Shortening Revenue (USD Million) By Country (2021-2032)
Figure 13. United Kingdom Dairy Free Shortening Revenue (USD Million) By Country (2021-2032)
Figure 14. Spain Dairy Free Shortening Revenue (USD Million) By Country (2021-2032)
Figure 15. Italy Dairy Free Shortening Revenue (USD Million) By Country (2021-2032)
Figure 16. Russia Dairy Free Shortening Revenue (USD Million) By Country (2021-2032)
Figure 17. Rest of Europe Dairy Free Shortening Revenue (USD Million) By Country (2021-2032)
Figure 11. Asia Pacific Dairy Free Shortening Revenue (USD Million) By Country (2021-2032)
Figure 12. China Dairy Free Shortening Revenue (USD Million) By Country (2021-2032)
Figure 13. Japan Dairy Free Shortening Revenue (USD Million) By Country (2021-2032)
Figure 14. India Dairy Free Shortening Revenue (USD Million) By Country (2021-2032)
Figure 15. South Korea Dairy Free Shortening Revenue (USD Million) By Country (2021-2032)
Figure 16. Australia Dairy Free Shortening Revenue (USD Million) By Country (2021-2032)
Figure 17. South East Asia Dairy Free Shortening Revenue (USD Million) By Country (2021-2032)
Figure 18. South America Dairy Free Shortening Revenue (USD Million) By Country (2021-2032)
Figure 19. Brazil Dairy Free Shortening Revenue (USD Million) By Country (2021-2032)
Figure 20. Argentina Dairy Free Shortening Revenue (USD Million) By Country (2021-2032)
Figure 21. Rest of Asia Pacific Dairy Free Shortening Revenue (USD Million) By Country (2021-2032)
Figure 22. Middle East and Africa Dairy Free Shortening Revenue (USD Million) By Region (2021-2032)
Figure 23. Saudi Arabia Dairy Free Shortening Revenue (USD Million) By Region (2021-2032)
Figure 24. The UAE Dairy Free Shortening Revenue (USD Million) By Region (2021-2032)
Figure 25. Rest of Middle East Dairy Free Shortening Revenue (USD Million) By Region (2021-2032)
Figure 26. South Africa Dairy Free Shortening Revenue (USD Million) By Region (2021-2032)
Figure 27. Africa Dairy Free Shortening Revenue (USD Million) By Region (2021-2032)
Figure 28. North America Dairy Free Shortening Revenue (USD Million) By Type (2021-2032)
Figure 29. North America Dairy Free Shortening Revenue (USD Million) By Application (2021-2032)
Figure 30. North America Dairy Free Shortening Revenue (USD Million) By Product (2021-2032)
Figure 31. Europe Dairy Free Shortening Revenue (USD Million) By Type (2021-2032)
Figure 32. Europe Dairy Free Shortening Revenue (USD Million) By Application (2021-2032)
Figure 33. Europe Dairy Free Shortening Revenue (USD Million) By Product (2021-2032)
Figure 34. Asia Pacific Dairy Free Shortening Revenue (USD Million) By Type (2021-2032)
Figure 35. Asia Pacific Dairy Free Shortening Revenue (USD Million) By Application (2021-2032)
Figure 36. Asia Pacific Dairy Free Shortening Revenue (USD Million) By Product (2021-2032)
Figure 37. South America Dairy Free Shortening Revenue (USD Million) By Type (2021-2032)
Figure 38. South America Dairy Free Shortening Revenue (USD Million) By Application (2021-2032)
Figure 39. South America Dairy Free Shortening Revenue (USD Million) By Product (2021-2032)
Figure 40. Middle East and Africa Dairy Free Shortening Revenue (USD Million) By Type (2021-2032)
Figure 41. Middle East and Africa Dairy Free Shortening Revenue (USD Million) By Application (2021-2032)
Figure 42. Middle East and Africa Dairy Free Shortening Revenue (USD Million) By Product (2021-2032)
By Product
Beverages
Milk
Dairy-free Kefir
Bakery Products
By Application
Household
Commercial
Countries Analyzed
North America (US, Canada, Mexico)
Europe (Germany, UK, France, Spain, Italy, Russia, Rest of Europe)
Asia Pacific (China, India, Japan, South Korea, Australia, South East Asia, Rest of Asia)
South America (Brazil, Argentina, Rest of South America)
Middle East and Africa (Saudi Arabia, UAE, Rest of Middle East, South Africa, Egypt, Rest of Africa)
