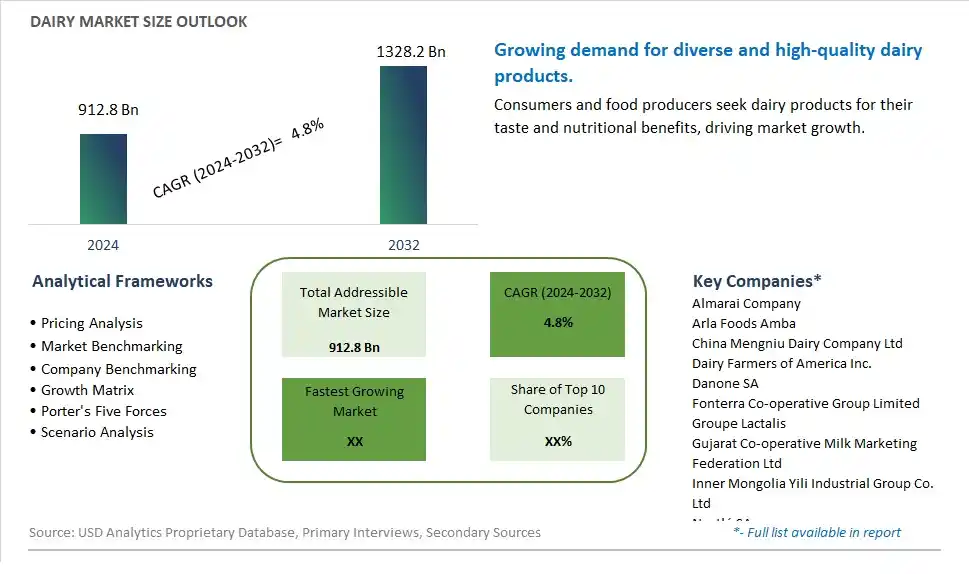
Global Dairy Market Size is valued at $912.8 Billion in 2024 and is forecast to register a growth rate (CAGR) of 4.8% to reach $1328.2 Billion by 2032.
The global Dairy Market Comprehensive Study analyzes and forecasts the market size across 6 regions and 24 countries for diverse segments -By Type (Butter, -Cultured Butter, -Uncultured Butter, Cheese, -Natural Cheese, -Processed Cheese, Cream, -Double Cream, -Single Cream, -Whipping Cream, -Others, Dairy Desserts, -Cheesecakes, -Frozen Desserts, -Ice Cream, -Mousses, -Others, Milk, -Condensed milk, -Flavored Milk, -Fresh Milk, -Powdered Milk, -UHT Milk, -Sour Milk Drinks, Yogurt, -Flavored Yogurt, -Unflavored Yogurt), By Distribution Channel (Off-Trade, -Convenience Stores, -Online Retail, -Specialist Retailers, -Supermarkets/Hypermarkets, -Others, On-Trade)
An Introduction to Dairy Market
In 2024, the Dairy market is witnessing robust growth, driven by the increasing global demand for diverse and high-quality dairy products. The dairy market includes a wide range of products such as milk, cheese, yogurt, and butter, valued for their nutritional benefits and versatile culinary applications. The market is supported by the growing trend towards premium, organic, and regionally produced dairy products. Advances in dairy farming, processing, and packaging technologies are enhancing the quality, safety, and nutritional profile of dairy products. The market is also benefiting from the trend towards clean-label and fortified dairy options, appealing to health-conscious and discerning consumers seeking nutritious and high-quality dairy products.
Dairy Competitive Landscape
The market report analyses the leading companies in the industry including Almarai Company, Arla Foods Amba, China Mengniu Dairy Company Ltd, Dairy Farmers of America Inc., Danone SA, Fonterra Co-operative Group Limited, Groupe Lactalis, Gujarat Co-operative Milk Marketing Federation Ltd, Inner Mongolia Yili Industrial Group Co. Ltd, Nestlé SA, Saputo Inc., Unilever PLC, and Others.
Dairy Market Dynamics
Dairy Market Trend: Growing Demand for Plant-Based Alternatives
One prominent market trend in the dairy market is the growing demand for plant-based alternatives. With increasing awareness of environmental sustainability, animal welfare concerns, and health-conscious consumer preferences, there is a rising interest in plant-based dairy products. This trend is driven by the desire for dairy alternatives that offer similar taste, texture, and nutritional benefits without the use of animal-derived ingredients.
Dairy Market Driver: Shift in Dietary Preferences and Lifestyles
A significant market driver for the dairy market is the shift in dietary preferences and lifestyles. Factors such as lactose intolerance, veganism, and flexitarian diets have led to a decline in traditional dairy consumption among certain consumer segments. The demand for plant-based dairy alternatives is driven by these shifting dietary patterns, as well as the desire for healthier and more sustainable food choices.
Dairy Market Opportunity: Innovation in Plant-Based Dairy Products
An exciting potential opportunity in the dairy market lies in innovation in plant-based dairy products. Manufacturers can capitalize on the growing demand for plant-based alternatives by developing a wide range of innovative products such as almond milk, coconut yogurt, oat-based cheese, and soy-based ice cream. By leveraging new ingredients, flavors, and formulations, companies can attract a broader customer base and meet the diverse needs of consumers looking for dairy-free options.
Dairy Market Share Analysis: Cheese segment generated the highest revenue share in the industry
The Cheese segment is the largest in the Dairy Market. This dominance stems from cheese's integral role in various cuisines globally and its extensive use in both household and commercial food preparation. Within the cheese category, natural cheese, which includes varieties such as cheddar, mozzarella, and parmesan, is particularly popular due to its authentic flavor and versatility in cooking. The demand for cheese is fueled by its nutritional value, offering a rich source of calcium, protein, and essential fats. Additionally, the growing trend of Westernized diets in emerging markets, along with the increasing popularity of fast food and ready-to-eat meals that frequently incorporate cheese, contributes to the segment's substantial market share. The expansion of artisanal and gourmet cheese varieties also enhances consumer interest and consumption, ensuring that cheese remains a leading product in the dairy sector.
Dairy Market Share Analysis: Online Retail is the fastest growing segment over the forecast period to 2032
The Online Retail segment is projected to be the fastest-growing in the Dairy Market by 2032. The growth of this segment is primarily driven by the increasing convenience and accessibility of online shopping platforms. Consumers are turning to online retail for grocery shopping due to the ease of home delivery, the ability to quickly compare prices and products, and the growing availability of a wide range of dairy products online. The Past few yearshas accelerated this trend, as safety concerns have prompted more consumers to opt for contactless shopping experiences. Additionally, online retailers are continuously improving their logistics and cold chain capabilities to ensure the freshness and quality of dairy products, which further boosts consumer confidence and reliance on online grocery shopping. With advancements in e-commerce technology and an increasing number of retailers investing in online platforms, the online retail segment is set to experience significant growth in the distribution of dairy products.
Dairy Market Segmentation
By Type
Butter
-Cultured Butter
-Uncultured Butter
Cheese
-Natural Cheese
-Processed Cheese
Cream
-Double Cream
-Single Cream
-Whipping Cream
-Others
Dairy Desserts
-Cheesecakes
-Frozen Desserts
-Ice Cream
-Mousses
-Others
Milk
-Condensed milk
-Flavored Milk
-Fresh Milk
-Powdered Milk
-UHT Milk
-Sour Milk Drinks
Yogurt
-Flavored Yogurt
-Unflavored Yogurt
By Distribution Channel
Off-Trade
-Convenience Stores
-Online Retail
-Specialist Retailers
-Supermarkets/Hypermarkets
-Others
On-Trade
Countries Analyzed
North America (US, Canada, Mexico)
Europe (Germany, UK, France, Spain, Italy, Russia, Rest of Europe)
Asia Pacific (China, India, Japan, South Korea, Australia, South East Asia, Rest of Asia)
South America (Brazil, Argentina, Rest of South America)
Middle East and Africa (Saudi Arabia, UAE, Rest of Middle East, South Africa, Egypt, Rest of Africa)
Dairy Companies Profiled in the Study
Almarai Company
Arla Foods Amba
China Mengniu Dairy Company Ltd
Dairy Farmers of America Inc.
Danone SA
Fonterra Co-operative Group Limited
Groupe Lactalis
Gujarat Co-operative Milk Marketing Federation Ltd
Inner Mongolia Yili Industrial Group Co. Ltd
Nestlé SA
Saputo Inc.
Unilever PLC
*- List Not Exhaustive
Chapter 1. TABLE OF CONTENTS
Chapter 2. Introduction to Dairy Market
2.1. Market Overview
2.2. Key Statistics and Report Highlights
2.3. Scope of the Comprehensive Study
2.3.1. Market Definition
2.3.2 Countries and Regions Covered
2.3.3 Research Objective
2.3.4 Units, Currency, and Conversions
2.3.5 Industry Value Chain
2.4. Key Market Segments
2.5. Key Companies
2.6. Study Period
Chapter 3. Strategic Analysis Review
3.1. Dairy Pricing Analysis and Forecast
3.2. Porter’s Five Forces
3.3. Market Ecosystem
3.4. SWOT Analysis
3.5. Regulatory Scenario
3.3. Effects of Inflation, Russia-Ukraine War, moderating economic growth, and other macroeconomic factors
Chapter 4. Competitive Landscape
4.1. Market Share Analysis
4.1.1. Global Dairy Market Share by Company, 2023
4.1.2. Product Offerings of Leading Dairy Companies
4.2. Market Entropy
4.2.1. New Product Launches in the Industry
4.2.2. Mergers, Acquisitions, Joint ventures, and Partnerships
4.3. Key Strategies and Best Practices
Chapter 5. Global Market Projections: Best, Reference, and Low Case Scenarios
5.1. Growth Analysis- Case Scenario Definitions
5.2. Low Growth Case Scenario Forecasts
5.3. Reference Growth Case Scenario Forecasts
5.4. High Growth Case Scenario Forecasts
Chapter 6. Market Dynamics
6.1. Dairy Market Drivers
6.2. Dairy Market Challenges
6.6. Dairy Market Opportunities
6.4. Dairy Market Trends
Chapter 7. Global Dairy Market Outlook Trends
7.1. Global Dairy Revenue (USD Million) and CAGR (%) by Type (2021-2032)
7.2. Global Dairy Revenue (USD Million) and CAGR (%) by Application (2021-2032)
7.3. Global Dairy Revenue (USD Million) and CAGR (%) by Product (2021-2032)
By Type
Butter
-Cultured Butter
-Uncultured Butter
Cheese
-Natural Cheese
-Processed Cheese
Cream
-Double Cream
-Single Cream
-Whipping Cream
-Others
Dairy Desserts
-Cheesecakes
-Frozen Desserts
-Ice Cream
-Mousses
-Others
Milk
-Condensed milk
-Flavored Milk
-Fresh Milk
-Powdered Milk
-UHT Milk
-Sour Milk Drinks
Yogurt
-Flavored Yogurt
-Unflavored Yogurt
By Distribution Channel
Off-Trade
-Convenience Stores
-Online Retail
-Specialist Retailers
-Supermarkets/Hypermarkets
-Others
On-Trade
Chapter 8. Global Dairy Regional Analysis and Outlook
8.1. Global Dairy Revenue (USD Million) By Regions (2021- 2032)
8.2. North America Dairy Revenue (USD Million) by Country (2021-2032)
8.2.1. United States Dairy Regional Analysis and Outlook
8.2.2. Canada Dairy Regional Analysis and Outlook
8.2.3. Mexico Dairy Regional Analysis and Outlook
8.3. Europe Dairy Revenue (USD Million), by Country (2021-2032)
8.3.1. Germany Dairy Regional Analysis and Outlook
8.3.2. France Dairy Regional Analysis and Outlook
8.3.3. United Kingdom Dairy Regional Analysis and Outlook
8.3.4. Spain Dairy Regional Analysis and Outlook
8.3.5. Italy Dairy Regional Analysis and Outlook
8.3.6. Russia Dairy Regional Analysis and Outlook
8.3.7. Rest of Europe Dairy Regional Analysis and Outlook
8.4. Asia Pacific Dairy Revenue (USD Million) by Country (2021-2032)
8.4.1. China Dairy Regional Analysis and Outlook
8.4.2. Japan Dairy Regional Analysis and Outlook
8.4.3. India Dairy Regional Analysis and Outlook
8.4.4. South Korea Dairy Regional Analysis and Outlook
8.4.5. Australia Dairy Regional Analysis and Outlook
8.4.6. South East Asia Dairy Regional Analysis and Outlook
8.4.7. Rest of Asia Pacific Dairy Regional Analysis and Outlook
8.5. South America Dairy Revenue (USD Million), by Country (2021-2032)
8.5.1. Brazil Dairy Regional Analysis and Outlook
8.5.2. Argentina Dairy Regional Analysis and Outlook
8.5.3. Rest of South America Dairy Regional Analysis and Outlook
8.6. Middle East and Africa Dairy Revenue (USD Million) by Country (2021-2032)
8.6.1. Middle East Dairy Regional Analysis and Outlook
8.6.2. Africa Dairy Regional Analysis and Outlook
Chapter 9. North America Dairy Analysis and Outlook
9.1. North America Dairy Revenue (USD Million) by Segments (2021-2032)
9.1.1. North America Dairy Revenue (USD Million) by Type (2021-2032)
9.1.2. North America Dairy Revenue (USD Million) by Application (2021-2032)
9.1.3. North America Dairy Revenue (USD Million) by Product (2021-2032)
By Type
Butter
-Cultured Butter
-Uncultured Butter
Cheese
-Natural Cheese
-Processed Cheese
Cream
-Double Cream
-Single Cream
-Whipping Cream
-Others
Dairy Desserts
-Cheesecakes
-Frozen Desserts
-Ice Cream
-Mousses
-Others
Milk
-Condensed milk
-Flavored Milk
-Fresh Milk
-Powdered Milk
-UHT Milk
-Sour Milk Drinks
Yogurt
-Flavored Yogurt
-Unflavored Yogurt
By Distribution Channel
Off-Trade
-Convenience Stores
-Online Retail
-Specialist Retailers
-Supermarkets/Hypermarkets
-Others
On-Trade
Chapter 10. Europe Dairy Analysis and Outlook
10.1. Europe Dairy Revenue (USD Million), by Segments (USD Million) (2021-2032)
10.1.1. Europe Dairy Revenue (USD Million) by Type (2021-2032)
10.1.2. Europe Dairy Revenue (USD Million) by Application (2021-2032)
10.1.3. Europe Dairy Revenue (USD Million) by Product (2021-2032)
By Type
Butter
-Cultured Butter
-Uncultured Butter
Cheese
-Natural Cheese
-Processed Cheese
Cream
-Double Cream
-Single Cream
-Whipping Cream
-Others
Dairy Desserts
-Cheesecakes
-Frozen Desserts
-Ice Cream
-Mousses
-Others
Milk
-Condensed milk
-Flavored Milk
-Fresh Milk
-Powdered Milk
-UHT Milk
-Sour Milk Drinks
Yogurt
-Flavored Yogurt
-Unflavored Yogurt
By Distribution Channel
Off-Trade
-Convenience Stores
-Online Retail
-Specialist Retailers
-Supermarkets/Hypermarkets
-Others
On-Trade
Chapter 11. Asia Pacific Dairy Analysis and Outlook
11.1. Asia Pacific Dairy Revenue (USD Million), and Revenue (USD Million) by Segments (2021-2032)
11.1.1. Asia Pacific Dairy Revenue (USD Million) by Type (2021-2032)
11.1.2. Asia Pacific Dairy Revenue (USD Million) by Application (2021-2032)
11.1.3. Asia Pacific Dairy Revenue (USD Million) by Product (2021-2032)
By Type
Butter
-Cultured Butter
-Uncultured Butter
Cheese
-Natural Cheese
-Processed Cheese
Cream
-Double Cream
-Single Cream
-Whipping Cream
-Others
Dairy Desserts
-Cheesecakes
-Frozen Desserts
-Ice Cream
-Mousses
-Others
Milk
-Condensed milk
-Flavored Milk
-Fresh Milk
-Powdered Milk
-UHT Milk
-Sour Milk Drinks
Yogurt
-Flavored Yogurt
-Unflavored Yogurt
By Distribution Channel
Off-Trade
-Convenience Stores
-Online Retail
-Specialist Retailers
-Supermarkets/Hypermarkets
-Others
On-Trade
Chapter 12. South America Dairy Analysis and Outlook
12.1. South America Dairy Revenue (USD Million), by Segments (2021-2032)
12.1.1. South America Dairy Revenue (USD Million) by Type (2021-2032)
12.1.2. South America Dairy Revenue (USD Million) by Application (2021-2032)
12.1.3. South America Dairy Revenue (USD Million) by Product (2021-2032)
By Type
Butter
-Cultured Butter
-Uncultured Butter
Cheese
-Natural Cheese
-Processed Cheese
Cream
-Double Cream
-Single Cream
-Whipping Cream
-Others
Dairy Desserts
-Cheesecakes
-Frozen Desserts
-Ice Cream
-Mousses
-Others
Milk
-Condensed milk
-Flavored Milk
-Fresh Milk
-Powdered Milk
-UHT Milk
-Sour Milk Drinks
Yogurt
-Flavored Yogurt
-Unflavored Yogurt
By Distribution Channel
Off-Trade
-Convenience Stores
-Online Retail
-Specialist Retailers
-Supermarkets/Hypermarkets
-Others
On-Trade
Chapter 13. Middle East and Africa Dairy Analysis and Outlook
13.1. Middle East and Africa Dairy Revenue (USD Million), by Segments (2021-2032)
13.1.1. Middle East and Africa Dairy Revenue (USD Million) by Type (2021-2032)
13.1.2. Middle East and Africa Dairy Revenue (USD Million) by Application (2021-2032)
13.1.3. Middle East and Africa Dairy Revenue (USD Million) by Product (2021-2032)
By Type
Butter
-Cultured Butter
-Uncultured Butter
Cheese
-Natural Cheese
-Processed Cheese
Cream
-Double Cream
-Single Cream
-Whipping Cream
-Others
Dairy Desserts
-Cheesecakes
-Frozen Desserts
-Ice Cream
-Mousses
-Others
Milk
-Condensed milk
-Flavored Milk
-Fresh Milk
-Powdered Milk
-UHT Milk
-Sour Milk Drinks
Yogurt
-Flavored Yogurt
-Unflavored Yogurt
By Distribution Channel
Off-Trade
-Convenience Stores
-Online Retail
-Specialist Retailers
-Supermarkets/Hypermarkets
-Others
On-Trade
Chapter 14. Dairy Company Profiles
14.1 Business Overview
14.2 Product Profiles
14.3 SWOT Profiles
14.5 Recent Developments
14.6 Financial Profile
List of Companies
Almarai Company
Arla Foods Amba
China Mengniu Dairy Company Ltd
Dairy Farmers of America Inc.
Danone SA
Fonterra Co-operative Group Limited
Groupe Lactalis
Gujarat Co-operative Milk Marketing Federation Ltd
Inner Mongolia Yili Industrial Group Co. Ltd
Nestlé SA
Saputo Inc.
Unilever PLC
15. Methodology and Data Sources
15.1 Customization Offerings
15.2 Subscription Services
15.3 Related Reports
15.4 Publisher Expertise
LIST OF TABLES
Table 1 Market Segmentation Analysis
Table 2 Global Dairy Market Share of Leading Companies, 2023
Table 3 Product Offerings of Leading Companies
Table 4 Low Growth Scenario Forecasts
Table 5 Reference Case Growth Scenario
Table 6 High Growth Case Scenario
Table 7 Global Dairy Revenue (USD Million) And CAGR (%) By Type (2021-2032)
Table 8 Global Dairy Revenue (USD Million) And CAGR (%) By Application (2021-2032)
Table 9 Global Dairy Revenue (USD Million) And CAGR (%) By Product (2021-2032)
Table 10 Global Dairy Market Revenue (USD Million) By Regions (2021-2032)
Table 11 Global Dairy Market Share (%) By Regions (2021-2032)
Table 12 North America Dairy Revenue (USD Million) By Country (2021-2032)
Table 13 Europe Dairy Revenue (USD Million) By Country (2021-2032)
Table 14 Asia Pacific Dairy Revenue (USD Million) By Country (2021-2032)
Table 15 South America Dairy Revenue (USD Million) By Country (2021-2032)
Table 16 Middle East and Africa Dairy Revenue (USD Million) By Region (2021-2032)
Table 17 North America Dairy Revenue (USD Million) By Type (2021-2032)
Table 18 North America Dairy Revenue (USD Million) By Application (2021-2032)
Table 19 North America Dairy Revenue (USD Million) By Product (2021-2032)
Table 20 Europe Dairy Revenue (USD Million) By Type (2021-2032)
Table 21 Europe Dairy Revenue (USD Million) By Application (2021-2032)
Table 22 Europe Dairy Revenue (USD Million) By Product (2021-2032)
Table 23 Asia Pacific Dairy Revenue (USD Million) By Type (2021-2032)
Table 24 Asia Pacific Dairy Revenue (USD Million) By Application (2021-2032)
Table 25 Asia Pacific Dairy Revenue (USD Million) By Product (2021-2032)
Table 26 South America Dairy Revenue (USD Million) By Type (2021-2032)
Table 27 South America Dairy Revenue (USD Million) By Application (2021-2032)
Table 28 South America Dairy Revenue (USD Million) By Product (2021-2032)
Table 29 Middle East and Africa Dairy Revenue (USD Million) By Type (2021-2032)
Table 30 Middle East and Africa Dairy Revenue (USD Million) By Application (2021-2032)
Table 31 Middle East and Africa Dairy Revenue (USD Million) By Product (2021-2032)
LIST OF FIGURES
Figure 1. Market Scope
Figure 2. Pricing Forecasts Per Unit, 2023- 2032
Figure 3. Porter’s Five Forces
Figure 4. Global Dairy Market Revenue (USD Million) By Regions (2021-2032)
Figure 5. Global Dairy Market Share (%) By Regions (2023)
Figure 6. North America Dairy Revenue (USD Million) By Country (2021-2032)
Figure 7. United States Dairy Revenue (USD Million) By Country (2021-2032)
Figure 8. Canada Dairy Revenue (USD Million) By Country (2021-2032)
Figure 9. Mexico Dairy Revenue (USD Million) By Country (2021-2032)
Figure 10. Europe Dairy Revenue (USD Million) By Country (2021-2032)
Figure 11. Germany Dairy Revenue (USD Million) By Country (2021-2032)
Figure 12. France Dairy Revenue (USD Million) By Country (2021-2032)
Figure 13. United Kingdom Dairy Revenue (USD Million) By Country (2021-2032)
Figure 14. Spain Dairy Revenue (USD Million) By Country (2021-2032)
Figure 15. Italy Dairy Revenue (USD Million) By Country (2021-2032)
Figure 16. Russia Dairy Revenue (USD Million) By Country (2021-2032)
Figure 17. Rest of Europe Dairy Revenue (USD Million) By Country (2021-2032)
Figure 11. Asia Pacific Dairy Revenue (USD Million) By Country (2021-2032)
Figure 12. China Dairy Revenue (USD Million) By Country (2021-2032)
Figure 13. Japan Dairy Revenue (USD Million) By Country (2021-2032)
Figure 14. India Dairy Revenue (USD Million) By Country (2021-2032)
Figure 15. South Korea Dairy Revenue (USD Million) By Country (2021-2032)
Figure 16. Australia Dairy Revenue (USD Million) By Country (2021-2032)
Figure 17. South East Asia Dairy Revenue (USD Million) By Country (2021-2032)
Figure 18. South America Dairy Revenue (USD Million) By Country (2021-2032)
Figure 19. Brazil Dairy Revenue (USD Million) By Country (2021-2032)
Figure 20. Argentina Dairy Revenue (USD Million) By Country (2021-2032)
Figure 21. Rest of Asia Pacific Dairy Revenue (USD Million) By Country (2021-2032)
Figure 22. Middle East and Africa Dairy Revenue (USD Million) By Region (2021-2032)
Figure 23. Saudi Arabia Dairy Revenue (USD Million) By Region (2021-2032)
Figure 24. The UAE Dairy Revenue (USD Million) By Region (2021-2032)
Figure 25. Rest of Middle East Dairy Revenue (USD Million) By Region (2021-2032)
Figure 26. South Africa Dairy Revenue (USD Million) By Region (2021-2032)
Figure 27. Africa Dairy Revenue (USD Million) By Region (2021-2032)
Figure 28. North America Dairy Revenue (USD Million) By Type (2021-2032)
Figure 29. North America Dairy Revenue (USD Million) By Application (2021-2032)
Figure 30. North America Dairy Revenue (USD Million) By Product (2021-2032)
Figure 31. Europe Dairy Revenue (USD Million) By Type (2021-2032)
Figure 32. Europe Dairy Revenue (USD Million) By Application (2021-2032)
Figure 33. Europe Dairy Revenue (USD Million) By Product (2021-2032)
Figure 34. Asia Pacific Dairy Revenue (USD Million) By Type (2021-2032)
Figure 35. Asia Pacific Dairy Revenue (USD Million) By Application (2021-2032)
Figure 36. Asia Pacific Dairy Revenue (USD Million) By Product (2021-2032)
Figure 37. South America Dairy Revenue (USD Million) By Type (2021-2032)
Figure 38. South America Dairy Revenue (USD Million) By Application (2021-2032)
Figure 39. South America Dairy Revenue (USD Million) By Product (2021-2032)
Figure 40. Middle East and Africa Dairy Revenue (USD Million) By Type (2021-2032)
Figure 41. Middle East and Africa Dairy Revenue (USD Million) By Application (2021-2032)
Figure 42. Middle East and Africa Dairy Revenue (USD Million) By Product (2021-2032)
By Type
Butter
-Cultured Butter
-Uncultured Butter
Cheese
-Natural Cheese
-Processed Cheese
Cream
-Double Cream
-Single Cream
-Whipping Cream
-Others
Dairy Desserts
-Cheesecakes
-Frozen Desserts
-Ice Cream
-Mousses
-Others
Milk
-Condensed milk
-Flavored Milk
-Fresh Milk
-Powdered Milk
-UHT Milk
-Sour Milk Drinks
Yogurt
-Flavored Yogurt
-Unflavored Yogurt
By Distribution Channel
Off-Trade
-Convenience Stores
-Online Retail
-Specialist Retailers
-Supermarkets/Hypermarkets
-Others
On-Trade
Countries Analyzed
North America (US, Canada, Mexico)
Europe (Germany, UK, France, Spain, Italy, Russia, Rest of Europe)
Asia Pacific (China, India, Japan, South Korea, Australia, South East Asia, Rest of Asia)
South America (Brazil, Argentina, Rest of South America)
Middle East and Africa (Saudi Arabia, UAE, Rest of Middle East, South Africa, Egypt, Rest of Africa)
