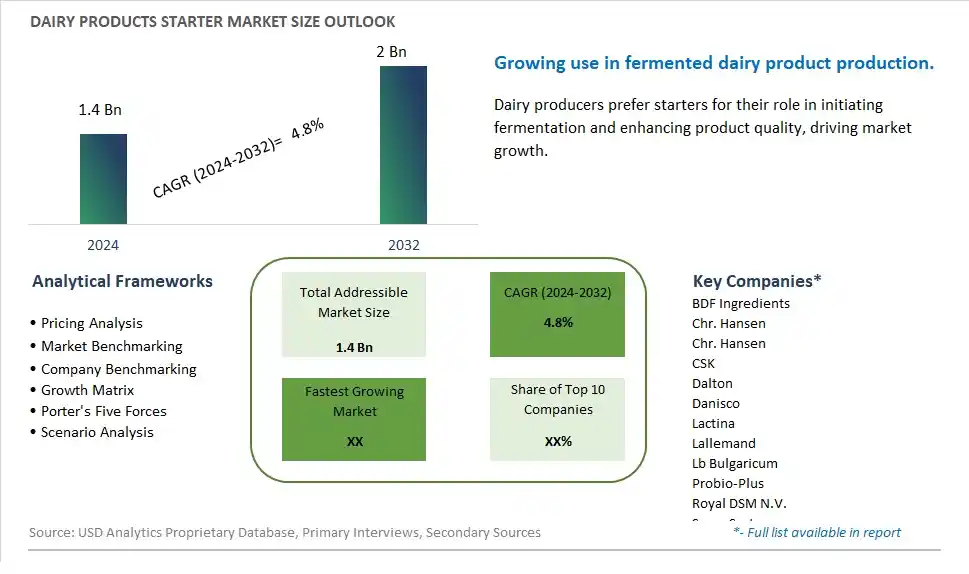
Global Dairy Products Starter Market Size is valued at $1.4 Billion in 2024 and is forecast to register a growth rate (CAGR) of 4.8% to reach $2 Billion by 2032.
The global Dairy Products Starter Market Comprehensive Study analyzes and forecasts the market size across 6 regions and 24 countries for diverse segments -By Type (Mesophilic, Thermophilic, Probiotics), By Application (Yoghurt, Cheese, Cream, Buttermilk, Others)
An Introduction to Dairy Products Starter Market
In 2024, the Dairy Products Starter market is witnessing significant growth, driven by the increasing demand for high-quality starter cultures in the dairy industry. Dairy starters, consisting of specific strains of bacteria, are essential for the fermentation process in products like yogurt, cheese, and kefir. The market is supported by the growing trend towards artisanal and premium dairy products. Advances in microbiology and fermentation technologies are enhancing the efficacy, safety, and application versatility of dairy starters. The market is also benefiting from the trend towards clean-label and natural ingredients, appealing to dairy producers and consumers seeking high-quality and authentic fermented dairy products.
Dairy Products Starter Competitive Landscape
The market report analyses the leading companies in the industry including BDF Ingredients, Chr. Hansen, Chr. Hansen, CSK, Dalton, Danisco, Lactina, Lallemand, Lb Bulgaricum, Probio-Plus, Royal DSM N.V., Sacco System, and Others.
Dairy Products Starter Market Dynamics
Dairy Products Starter Market Trend: Rise in Demand for Plant-Based and Alternative Starters
A prominent trend in the dairy products starter market is the increasing demand for plant-based and alternative starters. With more consumers adopting vegan, lactose-intolerant, and plant-based diets, there is a growing interest in starters made from non-dairy sources such as plant enzymes, probiotics, and cultures. This trend is driven by health-conscious choices, dietary preferences, and the desire for cleaner label products without compromising on the quality and functionality of starters used in dairy product fermentation and production.
Dairy Products Starter Market Driver: Health and Allergen Concerns
A key driver influencing the dairy products starter market is the rise in health concerns and allergen considerations among consumers. Factors such as lactose intolerance, dairy allergies, and the desire for healthier food options are driving the demand for alternative starters that do not contain dairy ingredients. This driver is pushing manufacturers to innovate and develop dairy-free starter products that provide the desired fermentation processes and characteristics in dairy products while meeting the needs of consumers with specific dietary requirements and allergen sensitivities.
Dairy Products Starter Market Opportunity: Expansion into Specialty and Functional Starters
An exciting opportunity in the dairy products starter market lies in the expansion into specialty and functional starter products. As the demand for alternative starters grows, there is an opportunity to introduce specialty starter variants tailored to specific dairy products such as cheese, yogurt, fermented beverages, and cultured creams. Additionally, there is potential to develop functional starter products enriched with probiotics, prebiotics, vitamins, and minerals to enhance the nutritional profile and health benefits of dairy products. This expansion into specialty and functional starters allows companies to differentiate their offerings, cater to diverse consumer preferences, and tap into emerging trends in the dairy and food industry.
Dairy Products Starter Market Share Analysis: Thermophilic segment generated the highest revenue share in the industry
The Thermophilic segment is the largest in the Dairy Products Starter Market by type. Thermophilic starters are widely used in the dairy industry due to their ability to thrive at higher temperatures, which is essential for the production of various dairy products, especially cheeses like mozzarella, Swiss, and Parmesan. These starters are crucial in the fermentation process, helping to develop the texture, flavor, and overall quality of the final product. The dominance of thermophilic starters is driven by the high demand for cheese and other dairy products that require high-temperature fermentation. Additionally, thermophilic cultures are known for their robustness and efficiency in producing consistent and high-quality results, making them a preferred choice among dairy manufacturers. The extensive use of thermophilic starters in the large-scale production of popular cheeses ensures their leading position in the dairy products starter market.
Dairy Products Starter Market Share Analysis: Yogurt is the fastest growing segment over the forecast period to 2032
The Yogurt segment is expected to be the fastest-growing in the Dairy Products Starter Market by 2032. This growth is primarily fueled by the increasing consumer demand for healthy and probiotic-rich foods. Yogurt is recognized for its health benefits, including improved digestion, enhanced immune function, and provision of essential nutrients like calcium and protein. The rising awareness of these benefits, coupled with the trend towards health and wellness, has significantly boosted the consumption of yogurt globally. Furthermore, the innovation in yogurt products, such as the introduction of Greek yogurt, flavored yogurt, and plant-based yogurt alternatives, has expanded the market and attracted a wider consumer base. The convenience of yogurt as a ready-to-eat snack or meal addition also contributes to its growing popularity. As consumers continue to prioritize their health and seek functional foods, the demand for high-quality yogurt starters is expected to rise, driving substantial growth in this segment.
Dairy Products Starter Market Segmentation
By Type
Mesophilic
Thermophilic
Probiotics
By Application
Yoghurt
Cheese
Cream
Buttermilk
Others
Countries Analyzed
North America (US, Canada, Mexico)
Europe (Germany, UK, France, Spain, Italy, Russia, Rest of Europe)
Asia Pacific (China, India, Japan, South Korea, Australia, South East Asia, Rest of Asia)
South America (Brazil, Argentina, Rest of South America)
Middle East and Africa (Saudi Arabia, UAE, Rest of Middle East, South Africa, Egypt, Rest of Africa)
Dairy Products Starter Companies Profiled in the Study
BDF Ingredients
Chr. Hansen
Chr. Hansen
CSK
Dalton
Danisco
Lactina
Lallemand
Lb Bulgaricum
Probio-Plus
Royal DSM N.V.
Sacco System
*- List Not Exhaustive
Chapter 1. TABLE OF CONTENTS
Chapter 2. Introduction to Dairy Products Starter Market
2.1. Market Overview
2.2. Key Statistics and Report Highlights
2.3. Scope of the Comprehensive Study
2.3.1. Market Definition
2.3.2 Countries and Regions Covered
2.3.3 Research Objective
2.3.4 Units, Currency, and Conversions
2.3.5 Industry Value Chain
2.4. Key Market Segments
2.5. Key Companies
2.6. Study Period
Chapter 3. Strategic Analysis Review
3.1. Dairy Products Starter Pricing Analysis and Forecast
3.2. Porter’s Five Forces
3.3. Market Ecosystem
3.4. SWOT Analysis
3.5. Regulatory Scenario
3.3. Effects of Inflation, Russia-Ukraine War, moderating economic growth, and other macroeconomic factors
Chapter 4. Competitive Landscape
4.1. Market Share Analysis
4.1.1. Global Dairy Products Starter Market Share by Company, 2023
4.1.2. Product Offerings of Leading Dairy Products Starter Companies
4.2. Market Entropy
4.2.1. New Product Launches in the Industry
4.2.2. Mergers, Acquisitions, Joint ventures, and Partnerships
4.3. Key Strategies and Best Practices
Chapter 5. Global Market Projections: Best, Reference, and Low Case Scenarios
5.1. Growth Analysis- Case Scenario Definitions
5.2. Low Growth Case Scenario Forecasts
5.3. Reference Growth Case Scenario Forecasts
5.4. High Growth Case Scenario Forecasts
Chapter 6. Market Dynamics
6.1. Dairy Products Starter Market Drivers
6.2. Dairy Products Starter Market Challenges
6.6. Dairy Products Starter Market Opportunities
6.4. Dairy Products Starter Market Trends
Chapter 7. Global Dairy Products Starter Market Outlook Trends
7.1. Global Dairy Products Starter Revenue (USD Million) and CAGR (%) by Type (2021-2032)
7.2. Global Dairy Products Starter Revenue (USD Million) and CAGR (%) by Application (2021-2032)
7.3. Global Dairy Products Starter Revenue (USD Million) and CAGR (%) by Product (2021-2032)
By Type
Mesophilic
Thermophilic
Probiotics
By Application
Yoghurt
Cheese
Cream
Buttermilk
Others
Chapter 8. Global Dairy Products Starter Regional Analysis and Outlook
8.1. Global Dairy Products Starter Revenue (USD Million) By Regions (2021- 2032)
8.2. North America Dairy Products Starter Revenue (USD Million) by Country (2021-2032)
8.2.1. United States Dairy Products Starter Regional Analysis and Outlook
8.2.2. Canada Dairy Products Starter Regional Analysis and Outlook
8.2.3. Mexico Dairy Products Starter Regional Analysis and Outlook
8.3. Europe Dairy Products Starter Revenue (USD Million), by Country (2021-2032)
8.3.1. Germany Dairy Products Starter Regional Analysis and Outlook
8.3.2. France Dairy Products Starter Regional Analysis and Outlook
8.3.3. United Kingdom Dairy Products Starter Regional Analysis and Outlook
8.3.4. Spain Dairy Products Starter Regional Analysis and Outlook
8.3.5. Italy Dairy Products Starter Regional Analysis and Outlook
8.3.6. Russia Dairy Products Starter Regional Analysis and Outlook
8.3.7. Rest of Europe Dairy Products Starter Regional Analysis and Outlook
8.4. Asia Pacific Dairy Products Starter Revenue (USD Million) by Country (2021-2032)
8.4.1. China Dairy Products Starter Regional Analysis and Outlook
8.4.2. Japan Dairy Products Starter Regional Analysis and Outlook
8.4.3. India Dairy Products Starter Regional Analysis and Outlook
8.4.4. South Korea Dairy Products Starter Regional Analysis and Outlook
8.4.5. Australia Dairy Products Starter Regional Analysis and Outlook
8.4.6. South East Asia Dairy Products Starter Regional Analysis and Outlook
8.4.7. Rest of Asia Pacific Dairy Products Starter Regional Analysis and Outlook
8.5. South America Dairy Products Starter Revenue (USD Million), by Country (2021-2032)
8.5.1. Brazil Dairy Products Starter Regional Analysis and Outlook
8.5.2. Argentina Dairy Products Starter Regional Analysis and Outlook
8.5.3. Rest of South America Dairy Products Starter Regional Analysis and Outlook
8.6. Middle East and Africa Dairy Products Starter Revenue (USD Million) by Country (2021-2032)
8.6.1. Middle East Dairy Products Starter Regional Analysis and Outlook
8.6.2. Africa Dairy Products Starter Regional Analysis and Outlook
Chapter 9. North America Dairy Products Starter Analysis and Outlook
9.1. North America Dairy Products Starter Revenue (USD Million) by Segments (2021-2032)
9.1.1. North America Dairy Products Starter Revenue (USD Million) by Type (2021-2032)
9.1.2. North America Dairy Products Starter Revenue (USD Million) by Application (2021-2032)
9.1.3. North America Dairy Products Starter Revenue (USD Million) by Product (2021-2032)
By Type
Mesophilic
Thermophilic
Probiotics
By Application
Yoghurt
Cheese
Cream
Buttermilk
Others
Chapter 10. Europe Dairy Products Starter Analysis and Outlook
10.1. Europe Dairy Products Starter Revenue (USD Million), by Segments (USD Million) (2021-2032)
10.1.1. Europe Dairy Products Starter Revenue (USD Million) by Type (2021-2032)
10.1.2. Europe Dairy Products Starter Revenue (USD Million) by Application (2021-2032)
10.1.3. Europe Dairy Products Starter Revenue (USD Million) by Product (2021-2032)
By Type
Mesophilic
Thermophilic
Probiotics
By Application
Yoghurt
Cheese
Cream
Buttermilk
Others
Chapter 11. Asia Pacific Dairy Products Starter Analysis and Outlook
11.1. Asia Pacific Dairy Products Starter Revenue (USD Million), and Revenue (USD Million) by Segments (2021-2032)
11.1.1. Asia Pacific Dairy Products Starter Revenue (USD Million) by Type (2021-2032)
11.1.2. Asia Pacific Dairy Products Starter Revenue (USD Million) by Application (2021-2032)
11.1.3. Asia Pacific Dairy Products Starter Revenue (USD Million) by Product (2021-2032)
By Type
Mesophilic
Thermophilic
Probiotics
By Application
Yoghurt
Cheese
Cream
Buttermilk
Others
Chapter 12. South America Dairy Products Starter Analysis and Outlook
12.1. South America Dairy Products Starter Revenue (USD Million), by Segments (2021-2032)
12.1.1. South America Dairy Products Starter Revenue (USD Million) by Type (2021-2032)
12.1.2. South America Dairy Products Starter Revenue (USD Million) by Application (2021-2032)
12.1.3. South America Dairy Products Starter Revenue (USD Million) by Product (2021-2032)
By Type
Mesophilic
Thermophilic
Probiotics
By Application
Yoghurt
Cheese
Cream
Buttermilk
Others
Chapter 13. Middle East and Africa Dairy Products Starter Analysis and Outlook
13.1. Middle East and Africa Dairy Products Starter Revenue (USD Million), by Segments (2021-2032)
13.1.1. Middle East and Africa Dairy Products Starter Revenue (USD Million) by Type (2021-2032)
13.1.2. Middle East and Africa Dairy Products Starter Revenue (USD Million) by Application (2021-2032)
13.1.3. Middle East and Africa Dairy Products Starter Revenue (USD Million) by Product (2021-2032)
By Type
Mesophilic
Thermophilic
Probiotics
By Application
Yoghurt
Cheese
Cream
Buttermilk
Others
Chapter 14. Dairy Products Starter Company Profiles
14.1 Business Overview
14.2 Product Profiles
14.3 SWOT Profiles
14.5 Recent Developments
14.6 Financial Profile
List of Companies
BDF Ingredients
Chr. Hansen
Chr. Hansen
CSK
Dalton
Danisco
Lactina
Lallemand
Lb Bulgaricum
Probio-Plus
Royal DSM N.V.
Sacco System
15. Methodology and Data Sources
15.1 Customization Offerings
15.2 Subscription Services
15.3 Related Reports
15.4 Publisher Expertise
LIST OF TABLES
Table 1 Market Segmentation Analysis
Table 2 Global Dairy Products Starter Market Share of Leading Companies, 2023
Table 3 Product Offerings of Leading Companies
Table 4 Low Growth Scenario Forecasts
Table 5 Reference Case Growth Scenario
Table 6 High Growth Case Scenario
Table 7 Global Dairy Products Starter Revenue (USD Million) And CAGR (%) By Type (2021-2032)
Table 8 Global Dairy Products Starter Revenue (USD Million) And CAGR (%) By Application (2021-2032)
Table 9 Global Dairy Products Starter Revenue (USD Million) And CAGR (%) By Product (2021-2032)
Table 10 Global Dairy Products Starter Market Revenue (USD Million) By Regions (2021-2032)
Table 11 Global Dairy Products Starter Market Share (%) By Regions (2021-2032)
Table 12 North America Dairy Products Starter Revenue (USD Million) By Country (2021-2032)
Table 13 Europe Dairy Products Starter Revenue (USD Million) By Country (2021-2032)
Table 14 Asia Pacific Dairy Products Starter Revenue (USD Million) By Country (2021-2032)
Table 15 South America Dairy Products Starter Revenue (USD Million) By Country (2021-2032)
Table 16 Middle East and Africa Dairy Products Starter Revenue (USD Million) By Region (2021-2032)
Table 17 North America Dairy Products Starter Revenue (USD Million) By Type (2021-2032)
Table 18 North America Dairy Products Starter Revenue (USD Million) By Application (2021-2032)
Table 19 North America Dairy Products Starter Revenue (USD Million) By Product (2021-2032)
Table 20 Europe Dairy Products Starter Revenue (USD Million) By Type (2021-2032)
Table 21 Europe Dairy Products Starter Revenue (USD Million) By Application (2021-2032)
Table 22 Europe Dairy Products Starter Revenue (USD Million) By Product (2021-2032)
Table 23 Asia Pacific Dairy Products Starter Revenue (USD Million) By Type (2021-2032)
Table 24 Asia Pacific Dairy Products Starter Revenue (USD Million) By Application (2021-2032)
Table 25 Asia Pacific Dairy Products Starter Revenue (USD Million) By Product (2021-2032)
Table 26 South America Dairy Products Starter Revenue (USD Million) By Type (2021-2032)
Table 27 South America Dairy Products Starter Revenue (USD Million) By Application (2021-2032)
Table 28 South America Dairy Products Starter Revenue (USD Million) By Product (2021-2032)
Table 29 Middle East and Africa Dairy Products Starter Revenue (USD Million) By Type (2021-2032)
Table 30 Middle East and Africa Dairy Products Starter Revenue (USD Million) By Application (2021-2032)
Table 31 Middle East and Africa Dairy Products Starter Revenue (USD Million) By Product (2021-2032)
LIST OF FIGURES
Figure 1. Market Scope
Figure 2. Pricing Forecasts Per Unit, 2023- 2032
Figure 3. Porter’s Five Forces
Figure 4. Global Dairy Products Starter Market Revenue (USD Million) By Regions (2021-2032)
Figure 5. Global Dairy Products Starter Market Share (%) By Regions (2023)
Figure 6. North America Dairy Products Starter Revenue (USD Million) By Country (2021-2032)
Figure 7. United States Dairy Products Starter Revenue (USD Million) By Country (2021-2032)
Figure 8. Canada Dairy Products Starter Revenue (USD Million) By Country (2021-2032)
Figure 9. Mexico Dairy Products Starter Revenue (USD Million) By Country (2021-2032)
Figure 10. Europe Dairy Products Starter Revenue (USD Million) By Country (2021-2032)
Figure 11. Germany Dairy Products Starter Revenue (USD Million) By Country (2021-2032)
Figure 12. France Dairy Products Starter Revenue (USD Million) By Country (2021-2032)
Figure 13. United Kingdom Dairy Products Starter Revenue (USD Million) By Country (2021-2032)
Figure 14. Spain Dairy Products Starter Revenue (USD Million) By Country (2021-2032)
Figure 15. Italy Dairy Products Starter Revenue (USD Million) By Country (2021-2032)
Figure 16. Russia Dairy Products Starter Revenue (USD Million) By Country (2021-2032)
Figure 17. Rest of Europe Dairy Products Starter Revenue (USD Million) By Country (2021-2032)
Figure 11. Asia Pacific Dairy Products Starter Revenue (USD Million) By Country (2021-2032)
Figure 12. China Dairy Products Starter Revenue (USD Million) By Country (2021-2032)
Figure 13. Japan Dairy Products Starter Revenue (USD Million) By Country (2021-2032)
Figure 14. India Dairy Products Starter Revenue (USD Million) By Country (2021-2032)
Figure 15. South Korea Dairy Products Starter Revenue (USD Million) By Country (2021-2032)
Figure 16. Australia Dairy Products Starter Revenue (USD Million) By Country (2021-2032)
Figure 17. South East Asia Dairy Products Starter Revenue (USD Million) By Country (2021-2032)
Figure 18. South America Dairy Products Starter Revenue (USD Million) By Country (2021-2032)
Figure 19. Brazil Dairy Products Starter Revenue (USD Million) By Country (2021-2032)
Figure 20. Argentina Dairy Products Starter Revenue (USD Million) By Country (2021-2032)
Figure 21. Rest of Asia Pacific Dairy Products Starter Revenue (USD Million) By Country (2021-2032)
Figure 22. Middle East and Africa Dairy Products Starter Revenue (USD Million) By Region (2021-2032)
Figure 23. Saudi Arabia Dairy Products Starter Revenue (USD Million) By Region (2021-2032)
Figure 24. The UAE Dairy Products Starter Revenue (USD Million) By Region (2021-2032)
Figure 25. Rest of Middle East Dairy Products Starter Revenue (USD Million) By Region (2021-2032)
Figure 26. South Africa Dairy Products Starter Revenue (USD Million) By Region (2021-2032)
Figure 27. Africa Dairy Products Starter Revenue (USD Million) By Region (2021-2032)
Figure 28. North America Dairy Products Starter Revenue (USD Million) By Type (2021-2032)
Figure 29. North America Dairy Products Starter Revenue (USD Million) By Application (2021-2032)
Figure 30. North America Dairy Products Starter Revenue (USD Million) By Product (2021-2032)
Figure 31. Europe Dairy Products Starter Revenue (USD Million) By Type (2021-2032)
Figure 32. Europe Dairy Products Starter Revenue (USD Million) By Application (2021-2032)
Figure 33. Europe Dairy Products Starter Revenue (USD Million) By Product (2021-2032)
Figure 34. Asia Pacific Dairy Products Starter Revenue (USD Million) By Type (2021-2032)
Figure 35. Asia Pacific Dairy Products Starter Revenue (USD Million) By Application (2021-2032)
Figure 36. Asia Pacific Dairy Products Starter Revenue (USD Million) By Product (2021-2032)
Figure 37. South America Dairy Products Starter Revenue (USD Million) By Type (2021-2032)
Figure 38. South America Dairy Products Starter Revenue (USD Million) By Application (2021-2032)
Figure 39. South America Dairy Products Starter Revenue (USD Million) By Product (2021-2032)
Figure 40. Middle East and Africa Dairy Products Starter Revenue (USD Million) By Type (2021-2032)
Figure 41. Middle East and Africa Dairy Products Starter Revenue (USD Million) By Application (2021-2032)
Figure 42. Middle East and Africa Dairy Products Starter Revenue (USD Million) By Product (2021-2032)
By Type
Mesophilic
Thermophilic
Probiotics
By Application
Yoghurt
Cheese
Cream
Buttermilk
Others
Countries Analyzed
North America (US, Canada, Mexico)
Europe (Germany, UK, France, Spain, Italy, Russia, Rest of Europe)
Asia Pacific (China, India, Japan, South Korea, Australia, South East Asia, Rest of Asia)
South America (Brazil, Argentina, Rest of South America)
Middle East and Africa (Saudi Arabia, UAE, Rest of Middle East, South Africa, Egypt, Rest of Africa)
