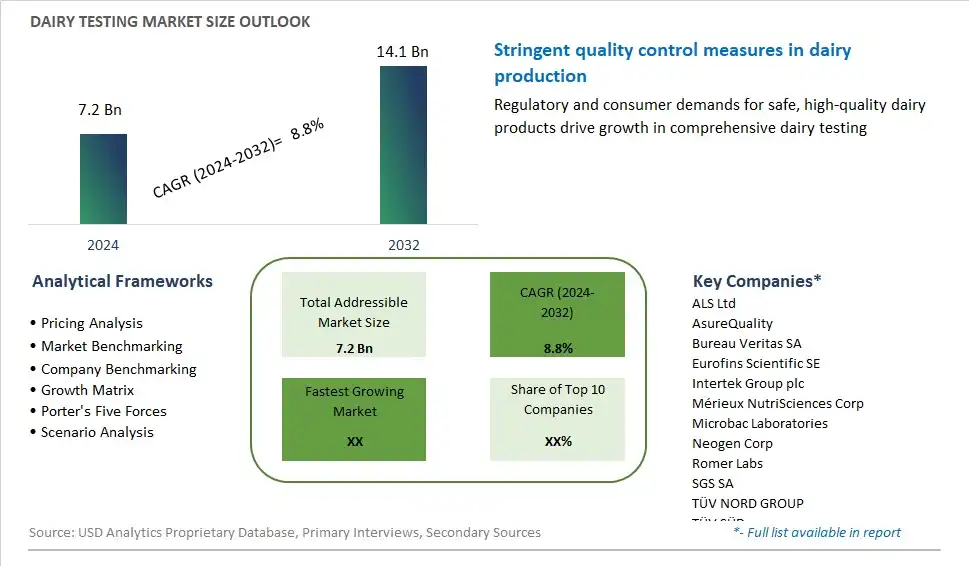
Global Dairy Testing Market Size is valued at $7.2 Billion in 2024 and is forecast to register a growth rate (CAGR) of 8.8% to reach $14.1 Billion by 2032.
The global Dairy Testing Market Comprehensive Study analyzes and forecasts the market size across 6 regions and 24 countries for diverse segments -By Type (Safety Testing, Quality Testing), By Technology (Traditional Technology, Rapid Technology), By Product (Milk & Milk Powder, Cheese, Butter & Spreads, Infant Food, ICE Cream & Desserts, Yogurt, Others)
An Introduction to Dairy Testing Market
Dairy testing encompasses a comprehensive range of analytical methods and techniques used to assess the quality, safety, and authenticity of dairy products throughout the production, processing, and distribution chain in 2024. From raw milk testing for microbial contamination and adulteration to finished product analysis for composition, shelf life, and sensory attributes, dairy testing plays a crucial role in ensuring compliance with regulatory standards, meeting consumer expectations, and safeguarding public health. With advancements in laboratory equipment, automation, and data analytics, dairy testing laboratories are equipped to perform a wide variety of tests quickly, accurately, and cost-effectively, enabling dairy manufacturers to monitor and manage product quality and safety with confidence. Whether conducting routine quality control checks, troubleshooting production issues, or investigating food safety incidents, dairy testing laboratories provide valuable insights and expertise to support informed decision-making and continuous improvement in the dairy industry. As globalization, supply chain complexity, and consumer scrutiny increase, the demand for dairy testing services and technologies is expected to grow, driven by the need for robust quality assurance and risk management practices that ensure the integrity and reputation of dairy brands.
Dairy Testing Competitive Landscape
The market report analyses the leading companies in the industry including ALS Ltd, AsureQuality, Bureau Veritas SA, Eurofins Scientific SE, Intertek Group plc, Mérieux NutriSciences Corp, Microbac Laboratories, Neogen Corp, Romer Labs, SGS SA, TÜV NORD GROUP, TÜV SÜD, and Others.
Dairy Testing Market Dynamics
Dairy Testing Market Trend: Stringent Food Safety Regulations and Quality Assurance
One prominent trend in the dairy testing market is the increasing focus on stringent food safety regulations and quality assurance measures. As consumers become more conscious about the safety and quality of dairy products, regulatory bodies around the world are implementing stricter standards and guidelines to ensure the integrity of the dairy supply chain. This trend is driven by concerns about foodborne illnesses, adulteration, contamination, and fraudulent practices within the dairy industry. As a result, dairy producers and manufacturers are investing in comprehensive testing protocols and advanced analytical technologies to detect and mitigate potential hazards, such as pathogens, antibiotics, pesticides, allergens, and mycotoxins, throughout the production process. Additionally, there's a growing emphasis on traceability and transparency in the dairy supply chain, with increased demand for testing solutions that provide accurate and reliable data on product origin, composition, and safety. This trend presents opportunities for testing laboratories, equipment suppliers, and service providers to offer innovative solutions that help dairy stakeholders comply with regulatory requirements, maintain product quality, and safeguard public health.
Market Driver: Consumer Demand for Transparency and Authenticity
A key driver propelling the growth of the dairy testing market is consumer demand for transparency and authenticity in dairy products. With rising consumer awareness about food safety, nutrition, and sustainability, there's a growing demand for dairy products that are free from contaminants, additives, and fraudulent practices. This driver is fueled by factors such as health concerns, food allergies, ethical considerations, and the desire for authentic, natural, and minimally processed foods. Consumers are increasingly scrutinizing product labels, seeking information on sourcing, production methods, and quality assurance practices. As a result, dairy manufacturers are under pressure to ensure the integrity and authenticity of their products through rigorous testing and certification programs. Testing for parameters such as organic certification, GMO-free status, hormone residues, and geographical indications is becoming increasingly important to meet consumer expectations and differentiate products in the market. By addressing consumer demands for transparency and authenticity through comprehensive testing programs, dairy companies can build trust, enhance brand reputation, and gain a competitive edge in the marketplace.
Market Opportunity: Adoption of Rapid and Portable Testing Technologies
An opportunity within the dairy testing market lies in the adoption of rapid and portable testing technologies to enhance efficiency, agility, and accessibility in dairy testing operations. Traditional laboratory-based testing methods often involve lengthy turnaround times, complex procedures, and expensive equipment, which can pose challenges for dairy producers seeking real-time data and on-site testing capabilities. Rapid testing technologies, such as immunoassays, biosensors, PCR-based assays, and spectroscopy techniques, offer the potential for faster, cost-effective, and user-friendly alternatives to traditional methods. These technologies enable dairy stakeholders to perform rapid on-site testing for a wide range of parameters, including pathogens, allergens, adulterants, and quality indicators, without the need for specialized laboratory facilities or trained personnel. By embracing rapid testing solutions, dairy producers can streamline their testing processes, minimize product recall risks, optimize supply chain management, and ensure compliance with regulatory requirements. Additionally, there's potential to expand the use of portable testing devices in emerging markets, remote areas, and small-scale dairy operations, where access to traditional laboratory infrastructure may be limited. By leveraging the opportunities presented by rapid and portable testing technologies, dairy stakeholders can enhance operational efficiency, product safety, and consumer trust in the dairy industry.
Dairy Testing Market Share Analysis: Safety Testing held the dominant market share in 2024
In the Dairy Testing Market segmented by type, the safety testing segment is the largest, driven by several pivotal factors. Safety testing encompasses a comprehensive range of analyses aimed at ensuring the absence of harmful contaminants and pathogens in dairy products, thereby safeguarding consumer health and well-being. Within safety testing, sub-categories such as pathogen detection, adulterant screening, pesticide residue analysis, GMO detection, mycotoxin testing, and other contaminant assessments address specific concerns related to food safety and regulatory compliance. With stringent food safety regulations in place globally, dairy producers and manufacturers prioritize safety testing to mitigate risks associated with microbial contamination, chemical residues, and other hazards. Further, incidents of foodborne illnesses and product recalls underscore the critical importance of safety testing in maintaining consumer confidence and market credibility. Additionally, advancements in testing methodologies, including molecular techniques and rapid detection technologies, enhance the efficiency and accuracy of safety testing procedures. As a result, the safety testing segment stands as the largest in the Dairy Testing Market, poised for sustained growth as regulatory requirements tighten and consumer demand for safe and high-quality dairy products continues to escalate.
Dairy Testing Market Share Analysis: Milk & Milk Powder held the dominant market share in 2024
In the Dairy Testing Market segmented by product, the milk & milk powder segment is the largest, driven by several pivotal factors. Milk and milk powder serve as foundational ingredients in a wide array of dairy products, including cheese, butter, spreads, infant food, ice cream, desserts, and yogurt. Consequently, ensuring the safety, quality, and authenticity of milk and milk powder is paramount to the integrity of downstream dairy products. Dairy testing for milk and milk powder involves a comprehensive range of analyses, including safety testing for pathogens, adulterants, pesticides, and contaminants, as well as quality testing for compositional parameters such as fat content, protein content, and microbial counts. Further, milk and milk powder are widely consumed by consumers of all ages and are essential components of various food formulations, making them subject to stringent regulatory standards and consumer scrutiny. Additionally, with the increasing globalization of dairy supply chains and the rise in international trade of dairy products, the demand for robust testing solutions for milk and milk powder has intensified. As a result, the milk & milk powder segment stands as the largest in the Dairy Testing Market, poised for sustained growth as the need for reliable testing methodologies to ensure the safety and quality of dairy products remains paramount across the dairy industry.
Dairy Testing Market Segmentation
By Type
Safety Testing
-Pathogens
-Adulterants
-Pesticides
-GMOS
-Mycotoxins
-Others
Quality Testing
By Technology
Traditional Technology
-Agar Culturing
Rapid Technology
-Convenience-Based
-Polymerase Chain Reaction (PCR)
-Immunoassay
-Chromatography & Spectrometry
By Product
Milk & Milk Powder
Cheese
Butter & Spreads
Infant Food
ICE Cream & Desserts
Yogurt
Others
Countries Analyzed
North America (US, Canada, Mexico)
Europe (Germany, UK, France, Spain, Italy, Russia, Rest of Europe)
Asia Pacific (China, India, Japan, South Korea, Australia, South East Asia, Rest of Asia)
South America (Brazil, Argentina, Rest of South America)
Middle East and Africa (Saudi Arabia, UAE, Rest of Middle East, South Africa, Egypt, Rest of Africa)
Dairy Testing Companies Profiled in the Study
ALS Ltd
AsureQuality
Bureau Veritas SA
Eurofins Scientific SE
Intertek Group plc
Mérieux NutriSciences Corp
Microbac Laboratories
Neogen Corp
Romer Labs
SGS SA
TÜV NORD GROUP
TÜV SÜD
*- List Not Exhaustive
Chapter 1. TABLE OF CONTENTS
Chapter 2. Introduction to Dairy Testing Market
2.1. Market Overview
2.2. Key Statistics and Report Highlights
2.3. Scope of the Comprehensive Study
2.3.1. Market Definition
2.3.2 Countries and Regions Covered
2.3.3 Research Objective
2.3.4 Units, Currency, and Conversions
2.3.5 Industry Value Chain
2.4. Key Market Segments
2.5. Key Companies
2.6. Study Period
Chapter 3. Strategic Analysis Review
3.1. Dairy Testing Pricing Analysis and Forecast
3.2. Porter’s Five Forces
3.3. Market Ecosystem
3.4. SWOT Analysis
3.5. Regulatory Scenario
3.3. Effects of Inflation, Russia-Ukraine War, moderating economic growth, and other macroeconomic factors
Chapter 4. Competitive Landscape
4.1. Market Share Analysis
4.1.1. Global Dairy Testing Market Share by Company, 2023
4.1.2. Product Offerings of Leading Dairy Testing Companies
4.2. Market Entropy
4.2.1. New Product Launches in the Industry
4.2.2. Mergers, Acquisitions, Joint ventures, and Partnerships
4.3. Key Strategies and Best Practices
Chapter 5. Global Market Projections: Best, Reference, and Low Case Scenarios
5.1. Growth Analysis- Case Scenario Definitions
5.2. Low Growth Case Scenario Forecasts
5.3. Reference Growth Case Scenario Forecasts
5.4. High Growth Case Scenario Forecasts
Chapter 6. Market Dynamics
6.1. Dairy Testing Market Drivers
6.2. Dairy Testing Market Challenges
6.6. Dairy Testing Market Opportunities
6.4. Dairy Testing Market Trends
Chapter 7. Global Dairy Testing Market Outlook Trends
7.1. Global Dairy Testing Revenue (USD Million) and CAGR (%) by Type (2021-2032)
7.2. Global Dairy Testing Revenue (USD Million) and CAGR (%) by Application (2021-2032)
7.3. Global Dairy Testing Revenue (USD Million) and CAGR (%) by Product (2021-2032)
By Type
Safety Testing
-Pathogens
-Adulterants
-Pesticides
-GMOS
-Mycotoxins
-Others
Quality Testing
By Technology
Traditional Technology
-Agar Culturing
Rapid Technology
-Convenience-Based
-Polymerase Chain Reaction (PCR)
-Immunoassay
-Chromatography & Spectrometry
By Product
Milk & Milk Powder
Cheese
Butter & Spreads
Infant Food
ICE Cream & Desserts
Yogurt
Others
Chapter 8. Global Dairy Testing Regional Analysis and Outlook
8.1. Global Dairy Testing Revenue (USD Million) By Regions (2021- 2032)
8.2. North America Dairy Testing Revenue (USD Million) by Country (2021-2032)
8.2.1. United States Dairy Testing Regional Analysis and Outlook
8.2.2. Canada Dairy Testing Regional Analysis and Outlook
8.2.3. Mexico Dairy Testing Regional Analysis and Outlook
8.3. Europe Dairy Testing Revenue (USD Million), by Country (2021-2032)
8.3.1. Germany Dairy Testing Regional Analysis and Outlook
8.3.2. France Dairy Testing Regional Analysis and Outlook
8.3.3. United Kingdom Dairy Testing Regional Analysis and Outlook
8.3.4. Spain Dairy Testing Regional Analysis and Outlook
8.3.5. Italy Dairy Testing Regional Analysis and Outlook
8.3.6. Russia Dairy Testing Regional Analysis and Outlook
8.3.7. Rest of Europe Dairy Testing Regional Analysis and Outlook
8.4. Asia Pacific Dairy Testing Revenue (USD Million) by Country (2021-2032)
8.4.1. China Dairy Testing Regional Analysis and Outlook
8.4.2. Japan Dairy Testing Regional Analysis and Outlook
8.4.3. India Dairy Testing Regional Analysis and Outlook
8.4.4. South Korea Dairy Testing Regional Analysis and Outlook
8.4.5. Australia Dairy Testing Regional Analysis and Outlook
8.4.6. South East Asia Dairy Testing Regional Analysis and Outlook
8.4.7. Rest of Asia Pacific Dairy Testing Regional Analysis and Outlook
8.5. South America Dairy Testing Revenue (USD Million), by Country (2021-2032)
8.5.1. Brazil Dairy Testing Regional Analysis and Outlook
8.5.2. Argentina Dairy Testing Regional Analysis and Outlook
8.5.3. Rest of South America Dairy Testing Regional Analysis and Outlook
8.6. Middle East and Africa Dairy Testing Revenue (USD Million) by Country (2021-2032)
8.6.1. Middle East Dairy Testing Regional Analysis and Outlook
8.6.2. Africa Dairy Testing Regional Analysis and Outlook
Chapter 9. North America Dairy Testing Analysis and Outlook
9.1. North America Dairy Testing Revenue (USD Million) by Segments (2021-2032)
9.1.1. North America Dairy Testing Revenue (USD Million) by Type (2021-2032)
9.1.2. North America Dairy Testing Revenue (USD Million) by Application (2021-2032)
9.1.3. North America Dairy Testing Revenue (USD Million) by Product (2021-2032)
By Type
Safety Testing
-Pathogens
-Adulterants
-Pesticides
-GMOS
-Mycotoxins
-Others
Quality Testing
By Technology
Traditional Technology
-Agar Culturing
Rapid Technology
-Convenience-Based
-Polymerase Chain Reaction (PCR)
-Immunoassay
-Chromatography & Spectrometry
By Product
Milk & Milk Powder
Cheese
Butter & Spreads
Infant Food
ICE Cream & Desserts
Yogurt
Others
Chapter 10. Europe Dairy Testing Analysis and Outlook
10.1. Europe Dairy Testing Revenue (USD Million), by Segments (USD Million) (2021-2032)
10.1.1. Europe Dairy Testing Revenue (USD Million) by Type (2021-2032)
10.1.2. Europe Dairy Testing Revenue (USD Million) by Application (2021-2032)
10.1.3. Europe Dairy Testing Revenue (USD Million) by Product (2021-2032)
By Type
Safety Testing
-Pathogens
-Adulterants
-Pesticides
-GMOS
-Mycotoxins
-Others
Quality Testing
By Technology
Traditional Technology
-Agar Culturing
Rapid Technology
-Convenience-Based
-Polymerase Chain Reaction (PCR)
-Immunoassay
-Chromatography & Spectrometry
By Product
Milk & Milk Powder
Cheese
Butter & Spreads
Infant Food
ICE Cream & Desserts
Yogurt
Others
Chapter 11. Asia Pacific Dairy Testing Analysis and Outlook
11.1. Asia Pacific Dairy Testing Revenue (USD Million), and Revenue (USD Million) by Segments (2021-2032)
11.1.1. Asia Pacific Dairy Testing Revenue (USD Million) by Type (2021-2032)
11.1.2. Asia Pacific Dairy Testing Revenue (USD Million) by Application (2021-2032)
11.1.3. Asia Pacific Dairy Testing Revenue (USD Million) by Product (2021-2032)
By Type
Safety Testing
-Pathogens
-Adulterants
-Pesticides
-GMOS
-Mycotoxins
-Others
Quality Testing
By Technology
Traditional Technology
-Agar Culturing
Rapid Technology
-Convenience-Based
-Polymerase Chain Reaction (PCR)
-Immunoassay
-Chromatography & Spectrometry
By Product
Milk & Milk Powder
Cheese
Butter & Spreads
Infant Food
ICE Cream & Desserts
Yogurt
Others
Chapter 12. South America Dairy Testing Analysis and Outlook
12.1. South America Dairy Testing Revenue (USD Million), by Segments (2021-2032)
12.1.1. South America Dairy Testing Revenue (USD Million) by Type (2021-2032)
12.1.2. South America Dairy Testing Revenue (USD Million) by Application (2021-2032)
12.1.3. South America Dairy Testing Revenue (USD Million) by Product (2021-2032)
By Type
Safety Testing
-Pathogens
-Adulterants
-Pesticides
-GMOS
-Mycotoxins
-Others
Quality Testing
By Technology
Traditional Technology
-Agar Culturing
Rapid Technology
-Convenience-Based
-Polymerase Chain Reaction (PCR)
-Immunoassay
-Chromatography & Spectrometry
By Product
Milk & Milk Powder
Cheese
Butter & Spreads
Infant Food
ICE Cream & Desserts
Yogurt
Others
Chapter 13. Middle East and Africa Dairy Testing Analysis and Outlook
13.1. Middle East and Africa Dairy Testing Revenue (USD Million), by Segments (2021-2032)
13.1.1. Middle East and Africa Dairy Testing Revenue (USD Million) by Type (2021-2032)
13.1.2. Middle East and Africa Dairy Testing Revenue (USD Million) by Application (2021-2032)
13.1.3. Middle East and Africa Dairy Testing Revenue (USD Million) by Product (2021-2032)
By Type
Safety Testing
-Pathogens
-Adulterants
-Pesticides
-GMOS
-Mycotoxins
-Others
Quality Testing
By Technology
Traditional Technology
-Agar Culturing
Rapid Technology
-Convenience-Based
-Polymerase Chain Reaction (PCR)
-Immunoassay
-Chromatography & Spectrometry
By Product
Milk & Milk Powder
Cheese
Butter & Spreads
Infant Food
ICE Cream & Desserts
Yogurt
Others
Chapter 14. Dairy Testing Company Profiles
14.1 Business Overview
14.2 Product Profiles
14.3 SWOT Profiles
14.5 Recent Developments
14.6 Financial Profile
List of Companies
ALS Ltd
AsureQuality
Bureau Veritas SA
Eurofins Scientific SE
Intertek Group plc
Mérieux NutriSciences Corp
Microbac Laboratories
Neogen Corp
Romer Labs
SGS SA
TÜV NORD GROUP
TÜV SÜD
15. Methodology and Data Sources
15.1 Customization Offerings
15.2 Subscription Services
15.3 Related Reports
15.4 Publisher Expertise
LIST OF TABLES
Table 1 Market Segmentation Analysis
Table 2 Global Dairy Testing Market Share of Leading Companies, 2023
Table 3 Product Offerings of Leading Companies
Table 4 Low Growth Scenario Forecasts
Table 5 Reference Case Growth Scenario
Table 6 High Growth Case Scenario
Table 7 Global Dairy Testing Revenue (USD Million) And CAGR (%) By Type (2021-2032)
Table 8 Global Dairy Testing Revenue (USD Million) And CAGR (%) By Application (2021-2032)
Table 9 Global Dairy Testing Revenue (USD Million) And CAGR (%) By Product (2021-2032)
Table 10 Global Dairy Testing Market Revenue (USD Million) By Regions (2021-2032)
Table 11 Global Dairy Testing Market Share (%) By Regions (2021-2032)
Table 12 North America Dairy Testing Revenue (USD Million) By Country (2021-2032)
Table 13 Europe Dairy Testing Revenue (USD Million) By Country (2021-2032)
Table 14 Asia Pacific Dairy Testing Revenue (USD Million) By Country (2021-2032)
Table 15 South America Dairy Testing Revenue (USD Million) By Country (2021-2032)
Table 16 Middle East and Africa Dairy Testing Revenue (USD Million) By Region (2021-2032)
Table 17 North America Dairy Testing Revenue (USD Million) By Type (2021-2032)
Table 18 North America Dairy Testing Revenue (USD Million) By Application (2021-2032)
Table 19 North America Dairy Testing Revenue (USD Million) By Product (2021-2032)
Table 20 Europe Dairy Testing Revenue (USD Million) By Type (2021-2032)
Table 21 Europe Dairy Testing Revenue (USD Million) By Application (2021-2032)
Table 22 Europe Dairy Testing Revenue (USD Million) By Product (2021-2032)
Table 23 Asia Pacific Dairy Testing Revenue (USD Million) By Type (2021-2032)
Table 24 Asia Pacific Dairy Testing Revenue (USD Million) By Application (2021-2032)
Table 25 Asia Pacific Dairy Testing Revenue (USD Million) By Product (2021-2032)
Table 26 South America Dairy Testing Revenue (USD Million) By Type (2021-2032)
Table 27 South America Dairy Testing Revenue (USD Million) By Application (2021-2032)
Table 28 South America Dairy Testing Revenue (USD Million) By Product (2021-2032)
Table 29 Middle East and Africa Dairy Testing Revenue (USD Million) By Type (2021-2032)
Table 30 Middle East and Africa Dairy Testing Revenue (USD Million) By Application (2021-2032)
Table 31 Middle East and Africa Dairy Testing Revenue (USD Million) By Product (2021-2032)
LIST OF FIGURES
Figure 1. Market Scope
Figure 2. Pricing Forecasts Per Unit, 2023- 2032
Figure 3. Porter’s Five Forces
Figure 4. Global Dairy Testing Market Revenue (USD Million) By Regions (2021-2032)
Figure 5. Global Dairy Testing Market Share (%) By Regions (2023)
Figure 6. North America Dairy Testing Revenue (USD Million) By Country (2021-2032)
Figure 7. United States Dairy Testing Revenue (USD Million) By Country (2021-2032)
Figure 8. Canada Dairy Testing Revenue (USD Million) By Country (2021-2032)
Figure 9. Mexico Dairy Testing Revenue (USD Million) By Country (2021-2032)
Figure 10. Europe Dairy Testing Revenue (USD Million) By Country (2021-2032)
Figure 11. Germany Dairy Testing Revenue (USD Million) By Country (2021-2032)
Figure 12. France Dairy Testing Revenue (USD Million) By Country (2021-2032)
Figure 13. United Kingdom Dairy Testing Revenue (USD Million) By Country (2021-2032)
Figure 14. Spain Dairy Testing Revenue (USD Million) By Country (2021-2032)
Figure 15. Italy Dairy Testing Revenue (USD Million) By Country (2021-2032)
Figure 16. Russia Dairy Testing Revenue (USD Million) By Country (2021-2032)
Figure 17. Rest of Europe Dairy Testing Revenue (USD Million) By Country (2021-2032)
Figure 11. Asia Pacific Dairy Testing Revenue (USD Million) By Country (2021-2032)
Figure 12. China Dairy Testing Revenue (USD Million) By Country (2021-2032)
Figure 13. Japan Dairy Testing Revenue (USD Million) By Country (2021-2032)
Figure 14. India Dairy Testing Revenue (USD Million) By Country (2021-2032)
Figure 15. South Korea Dairy Testing Revenue (USD Million) By Country (2021-2032)
Figure 16. Australia Dairy Testing Revenue (USD Million) By Country (2021-2032)
Figure 17. South East Asia Dairy Testing Revenue (USD Million) By Country (2021-2032)
Figure 18. South America Dairy Testing Revenue (USD Million) By Country (2021-2032)
Figure 19. Brazil Dairy Testing Revenue (USD Million) By Country (2021-2032)
Figure 20. Argentina Dairy Testing Revenue (USD Million) By Country (2021-2032)
Figure 21. Rest of Asia Pacific Dairy Testing Revenue (USD Million) By Country (2021-2032)
Figure 22. Middle East and Africa Dairy Testing Revenue (USD Million) By Region (2021-2032)
Figure 23. Saudi Arabia Dairy Testing Revenue (USD Million) By Region (2021-2032)
Figure 24. The UAE Dairy Testing Revenue (USD Million) By Region (2021-2032)
Figure 25. Rest of Middle East Dairy Testing Revenue (USD Million) By Region (2021-2032)
Figure 26. South Africa Dairy Testing Revenue (USD Million) By Region (2021-2032)
Figure 27. Africa Dairy Testing Revenue (USD Million) By Region (2021-2032)
Figure 28. North America Dairy Testing Revenue (USD Million) By Type (2021-2032)
Figure 29. North America Dairy Testing Revenue (USD Million) By Application (2021-2032)
Figure 30. North America Dairy Testing Revenue (USD Million) By Product (2021-2032)
Figure 31. Europe Dairy Testing Revenue (USD Million) By Type (2021-2032)
Figure 32. Europe Dairy Testing Revenue (USD Million) By Application (2021-2032)
Figure 33. Europe Dairy Testing Revenue (USD Million) By Product (2021-2032)
Figure 34. Asia Pacific Dairy Testing Revenue (USD Million) By Type (2021-2032)
Figure 35. Asia Pacific Dairy Testing Revenue (USD Million) By Application (2021-2032)
Figure 36. Asia Pacific Dairy Testing Revenue (USD Million) By Product (2021-2032)
Figure 37. South America Dairy Testing Revenue (USD Million) By Type (2021-2032)
Figure 38. South America Dairy Testing Revenue (USD Million) By Application (2021-2032)
Figure 39. South America Dairy Testing Revenue (USD Million) By Product (2021-2032)
Figure 40. Middle East and Africa Dairy Testing Revenue (USD Million) By Type (2021-2032)
Figure 41. Middle East and Africa Dairy Testing Revenue (USD Million) By Application (2021-2032)
Figure 42. Middle East and Africa Dairy Testing Revenue (USD Million) By Product (2021-2032)
By Type
Safety Testing
-Pathogens
-Adulterants
-Pesticides
-GMOS
-Mycotoxins
-Others
Quality Testing
By Technology
Traditional Technology
-Agar Culturing
Rapid Technology
-Convenience-Based
-Polymerase Chain Reaction (PCR)
-Immunoassay
-Chromatography & Spectrometry
By Product
Milk & Milk Powder
Cheese
Butter & Spreads
Infant Food
ICE Cream & Desserts
Yogurt
Others
Countries Analyzed
North America (US, Canada, Mexico)
Europe (Germany, UK, France, Spain, Italy, Russia, Rest of Europe)
Asia Pacific (China, India, Japan, South Korea, Australia, South East Asia, Rest of Asia)
South America (Brazil, Argentina, Rest of South America)
Middle East and Africa (Saudi Arabia, UAE, Rest of Middle East, South Africa, Egypt, Rest of Africa)
