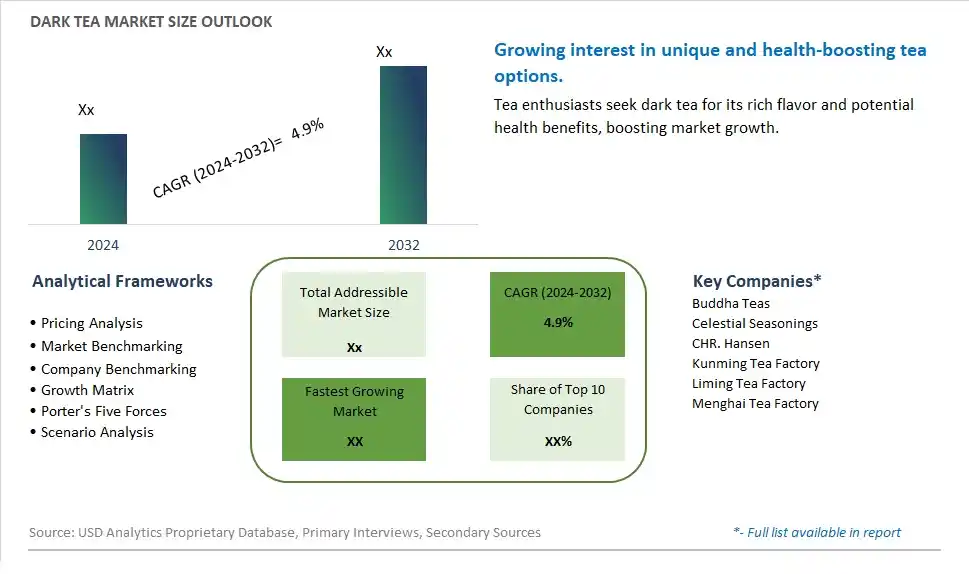
Global Dark Tea Market Size is valued at $XX Million in 2024 and is forecast to register a growth rate (CAGR) of 4.9% to reach $XX Million by 2032.
The global Dark Tea Market Comprehensive Study analyzes and forecasts the market size across 6 regions and 24 countries for diverse segments -By Type (Piled Teas, Toyama Kurocha, Others), By Application (Supermarkets/Hypermarkets, Convenience Stores, Online Retail, Others)
An Introduction to Dark Tea Market
The Dark Tea market in 2024 is expanding steadily, driven by the increasing demand for unique and health-promoting tea varieties. Dark tea, also known as fermented tea, includes types like Pu-erh and Liu'an, which are valued for their rich, complex flavors and potential health benefits, such as aiding digestion and reducing cholesterol. The market is supported by the growing trend towards specialty and functional beverages. Advances in tea cultivation, fermentation, and processing technologies are enhancing the quality, flavor, and health benefits of dark tea. The market is also benefiting from the trend towards clean-label and organic products, appealing to tea enthusiasts and health-conscious consumers seeking high-quality and beneficial tea options.
Dark Tea Competitive Landscape
The market report analyses the leading companies in the industry including Buddha Teas, Celestial Seasonings, CHR. Hansen, Kunming Tea Factory, Liming Tea Factory, Menghai Tea Factory, and Others.
Dark Tea Market Dynamics
Dark Tea Market Trend: Surge in Demand for Functional and Specialty Beverages
A prominent trend in the dark tea market is the surge in demand for functional and specialty beverages. As consumers prioritize health and wellness, there is an increasing interest in dark teas such as pu-erh, black tea, and aged teas that are renowned for their potential health benefits, including antioxidant properties, digestive support, and potential cardiovascular benefits. This trend is driven by a growing awareness of the health-promoting properties of dark teas and a desire for unique and flavorful beverage options.
Dark Tea Market Driver: Health Consciousness and Wellness Trends
A key driver influencing the dark tea market is the rise in health consciousness and wellness trends among consumers. Factors such as concerns about chronic diseases, immunity support, and the desire for natural remedies are driving the demand for dark teas known for their potential health-promoting properties. This driver is pushing manufacturers to emphasize the health benefits of dark teas, educate consumers about the unique characteristics of different tea varieties, and innovate with new tea blends and formulations to meet evolving consumer preferences.
Dark Tea Market Opportunity: Expansion into Premium and Artisanal Segments
An exciting opportunity in the dark tea market lies in the expansion into premium and artisanal segments. There is potential to introduce high-quality and artisan-crafted dark teas sourced from specific regions or estates, highlighting the unique terroir and flavor profiles of each tea variety. Additionally, there is an opportunity to develop premium tea blends that combine dark teas with complementary ingredients such as herbs, spices, fruits, and floral notes, creating sophisticated and aromatic tea experiences for discerning tea enthusiasts and connoisseurs. This expansion into premium and artisanal segments allows companies to differentiate their dark tea offerings, target niche markets, and capture value in the growing specialty tea sector.
Dark Tea Market Share Analysis: Piled Teas segment generated the highest revenue share in the industry
The Piled Teas segment is the largest in the Dark Tea Market by type. Piled teas, also known as heicha or fermented dark teas, have a rich history and are highly regarded for their unique fermentation process that imparts distinct flavors and potential health benefits. These teas undergo a piling process where the leaves are wetted, heaped, and allowed to ferment naturally, resulting in a rich, earthy flavor profile that sets them apart from other tea types. The popularity of piled teas is driven by their deep-rooted cultural significance in regions such as China and their growing recognition in global markets. The increasing consumer interest in traditional and artisanal tea varieties, coupled with the perceived health benefits of fermented teas, has further boosted the demand for piled teas, making them the largest segment in the dark tea market.
Dark Tea Market Share Analysis: Online Retail is the fastest growing segment over the forecast period to 2032
The Online Retail segment is expected to be the fastest-growing in the Dark Tea Market by 2032. This growth is primarily fueled by the expanding e-commerce sector and the convenience it offers to consumers. Online retail platforms provide a vast array of dark tea options from different brands and regions, making it easier for consumers to explore and purchase niche and specialty teas that may not be readily available in physical stores. The increasing internet penetration and the proliferation of smartphones have made online shopping more accessible to a broader audience. Additionally, the Past few yearshas accelerated the shift towards online shopping, as consumers seek contactless purchasing options. Online platforms also offer detailed product descriptions, customer reviews, and competitive pricing, enhancing the shopping experience and building consumer trust. As a result, the online retail segment is poised for significant growth, outpacing traditional retail channels in the dark tea market in the coming years.
Dark Tea Market Segmentation
By Type
Piled Teas
Toyama Kurocha
Others
By Application
Supermarkets/Hypermarkets
Convenience Stores
Online Retail
Others
Countries Analyzed
North America (US, Canada, Mexico)
Europe (Germany, UK, France, Spain, Italy, Russia, Rest of Europe)
Asia Pacific (China, India, Japan, South Korea, Australia, South East Asia, Rest of Asia)
South America (Brazil, Argentina, Rest of South America)
Middle East and Africa (Saudi Arabia, UAE, Rest of Middle East, South Africa, Egypt, Rest of Africa)
Dark Tea Companies Profiled in the Study
Buddha Teas
Celestial Seasonings
CHR. Hansen
Kunming Tea Factory
Liming Tea Factory
Menghai Tea Factory
*- List Not Exhaustive
Chapter 1. TABLE OF CONTENTS
Chapter 2. Introduction to Dark Tea Market
2.1. Market Overview
2.2. Key Statistics and Report Highlights
2.3. Scope of the Comprehensive Study
2.3.1. Market Definition
2.3.2 Countries and Regions Covered
2.3.3 Research Objective
2.3.4 Units, Currency, and Conversions
2.3.5 Industry Value Chain
2.4. Key Market Segments
2.5. Key Companies
2.6. Study Period
Chapter 3. Strategic Analysis Review
3.1. Dark Tea Pricing Analysis and Forecast
3.2. Porter’s Five Forces
3.3. Market Ecosystem
3.4. SWOT Analysis
3.5. Regulatory Scenario
3.3. Effects of Inflation, Russia-Ukraine War, moderating economic growth, and other macroeconomic factors
Chapter 4. Competitive Landscape
4.1. Market Share Analysis
4.1.1. Global Dark Tea Market Share by Company, 2023
4.1.2. Product Offerings of Leading Dark Tea Companies
4.2. Market Entropy
4.2.1. New Product Launches in the Industry
4.2.2. Mergers, Acquisitions, Joint ventures, and Partnerships
4.3. Key Strategies and Best Practices
Chapter 5. Global Market Projections: Best, Reference, and Low Case Scenarios
5.1. Growth Analysis- Case Scenario Definitions
5.2. Low Growth Case Scenario Forecasts
5.3. Reference Growth Case Scenario Forecasts
5.4. High Growth Case Scenario Forecasts
Chapter 6. Market Dynamics
6.1. Dark Tea Market Drivers
6.2. Dark Tea Market Challenges
6.6. Dark Tea Market Opportunities
6.4. Dark Tea Market Trends
Chapter 7. Global Dark Tea Market Outlook Trends
7.1. Global Dark Tea Revenue (USD Million) and CAGR (%) by Type (2021-2032)
7.2. Global Dark Tea Revenue (USD Million) and CAGR (%) by Application (2021-2032)
7.3. Global Dark Tea Revenue (USD Million) and CAGR (%) by Product (2021-2032)
By Type
Piled Teas
Toyama Kurocha
Others
By Application
Supermarkets/Hypermarkets
Convenience Stores
Online Retail
Others
Chapter 8. Global Dark Tea Regional Analysis and Outlook
8.1. Global Dark Tea Revenue (USD Million) By Regions (2021- 2032)
8.2. North America Dark Tea Revenue (USD Million) by Country (2021-2032)
8.2.1. United States Dark Tea Regional Analysis and Outlook
8.2.2. Canada Dark Tea Regional Analysis and Outlook
8.2.3. Mexico Dark Tea Regional Analysis and Outlook
8.3. Europe Dark Tea Revenue (USD Million), by Country (2021-2032)
8.3.1. Germany Dark Tea Regional Analysis and Outlook
8.3.2. France Dark Tea Regional Analysis and Outlook
8.3.3. United Kingdom Dark Tea Regional Analysis and Outlook
8.3.4. Spain Dark Tea Regional Analysis and Outlook
8.3.5. Italy Dark Tea Regional Analysis and Outlook
8.3.6. Russia Dark Tea Regional Analysis and Outlook
8.3.7. Rest of Europe Dark Tea Regional Analysis and Outlook
8.4. Asia Pacific Dark Tea Revenue (USD Million) by Country (2021-2032)
8.4.1. China Dark Tea Regional Analysis and Outlook
8.4.2. Japan Dark Tea Regional Analysis and Outlook
8.4.3. India Dark Tea Regional Analysis and Outlook
8.4.4. South Korea Dark Tea Regional Analysis and Outlook
8.4.5. Australia Dark Tea Regional Analysis and Outlook
8.4.6. South East Asia Dark Tea Regional Analysis and Outlook
8.4.7. Rest of Asia Pacific Dark Tea Regional Analysis and Outlook
8.5. South America Dark Tea Revenue (USD Million), by Country (2021-2032)
8.5.1. Brazil Dark Tea Regional Analysis and Outlook
8.5.2. Argentina Dark Tea Regional Analysis and Outlook
8.5.3. Rest of South America Dark Tea Regional Analysis and Outlook
8.6. Middle East and Africa Dark Tea Revenue (USD Million) by Country (2021-2032)
8.6.1. Middle East Dark Tea Regional Analysis and Outlook
8.6.2. Africa Dark Tea Regional Analysis and Outlook
Chapter 9. North America Dark Tea Analysis and Outlook
9.1. North America Dark Tea Revenue (USD Million) by Segments (2021-2032)
9.1.1. North America Dark Tea Revenue (USD Million) by Type (2021-2032)
9.1.2. North America Dark Tea Revenue (USD Million) by Application (2021-2032)
9.1.3. North America Dark Tea Revenue (USD Million) by Product (2021-2032)
By Type
Piled Teas
Toyama Kurocha
Others
By Application
Supermarkets/Hypermarkets
Convenience Stores
Online Retail
Others
Chapter 10. Europe Dark Tea Analysis and Outlook
10.1. Europe Dark Tea Revenue (USD Million), by Segments (USD Million) (2021-2032)
10.1.1. Europe Dark Tea Revenue (USD Million) by Type (2021-2032)
10.1.2. Europe Dark Tea Revenue (USD Million) by Application (2021-2032)
10.1.3. Europe Dark Tea Revenue (USD Million) by Product (2021-2032)
By Type
Piled Teas
Toyama Kurocha
Others
By Application
Supermarkets/Hypermarkets
Convenience Stores
Online Retail
Others
Chapter 11. Asia Pacific Dark Tea Analysis and Outlook
11.1. Asia Pacific Dark Tea Revenue (USD Million), and Revenue (USD Million) by Segments (2021-2032)
11.1.1. Asia Pacific Dark Tea Revenue (USD Million) by Type (2021-2032)
11.1.2. Asia Pacific Dark Tea Revenue (USD Million) by Application (2021-2032)
11.1.3. Asia Pacific Dark Tea Revenue (USD Million) by Product (2021-2032)
By Type
Piled Teas
Toyama Kurocha
Others
By Application
Supermarkets/Hypermarkets
Convenience Stores
Online Retail
Others
Chapter 12. South America Dark Tea Analysis and Outlook
12.1. South America Dark Tea Revenue (USD Million), by Segments (2021-2032)
12.1.1. South America Dark Tea Revenue (USD Million) by Type (2021-2032)
12.1.2. South America Dark Tea Revenue (USD Million) by Application (2021-2032)
12.1.3. South America Dark Tea Revenue (USD Million) by Product (2021-2032)
By Type
Piled Teas
Toyama Kurocha
Others
By Application
Supermarkets/Hypermarkets
Convenience Stores
Online Retail
Others
Chapter 13. Middle East and Africa Dark Tea Analysis and Outlook
13.1. Middle East and Africa Dark Tea Revenue (USD Million), by Segments (2021-2032)
13.1.1. Middle East and Africa Dark Tea Revenue (USD Million) by Type (2021-2032)
13.1.2. Middle East and Africa Dark Tea Revenue (USD Million) by Application (2021-2032)
13.1.3. Middle East and Africa Dark Tea Revenue (USD Million) by Product (2021-2032)
By Type
Piled Teas
Toyama Kurocha
Others
By Application
Supermarkets/Hypermarkets
Convenience Stores
Online Retail
Others
Chapter 14. Dark Tea Company Profiles
14.1 Business Overview
14.2 Product Profiles
14.3 SWOT Profiles
14.5 Recent Developments
14.6 Financial Profile
List of Companies
Buddha Teas
Celestial Seasonings
CHR. Hansen
Kunming Tea Factory
Liming Tea Factory
Menghai Tea Factory
15. Methodology and Data Sources
15.1 Customization Offerings
15.2 Subscription Services
15.3 Related Reports
15.4 Publisher Expertise
LIST OF TABLES
Table 1 Market Segmentation Analysis
Table 2 Global Dark Tea Market Share of Leading Companies, 2023
Table 3 Product Offerings of Leading Companies
Table 4 Low Growth Scenario Forecasts
Table 5 Reference Case Growth Scenario
Table 6 High Growth Case Scenario
Table 7 Global Dark Tea Revenue (USD Million) And CAGR (%) By Type (2021-2032)
Table 8 Global Dark Tea Revenue (USD Million) And CAGR (%) By Application (2021-2032)
Table 9 Global Dark Tea Revenue (USD Million) And CAGR (%) By Product (2021-2032)
Table 10 Global Dark Tea Market Revenue (USD Million) By Regions (2021-2032)
Table 11 Global Dark Tea Market Share (%) By Regions (2021-2032)
Table 12 North America Dark Tea Revenue (USD Million) By Country (2021-2032)
Table 13 Europe Dark Tea Revenue (USD Million) By Country (2021-2032)
Table 14 Asia Pacific Dark Tea Revenue (USD Million) By Country (2021-2032)
Table 15 South America Dark Tea Revenue (USD Million) By Country (2021-2032)
Table 16 Middle East and Africa Dark Tea Revenue (USD Million) By Region (2021-2032)
Table 17 North America Dark Tea Revenue (USD Million) By Type (2021-2032)
Table 18 North America Dark Tea Revenue (USD Million) By Application (2021-2032)
Table 19 North America Dark Tea Revenue (USD Million) By Product (2021-2032)
Table 20 Europe Dark Tea Revenue (USD Million) By Type (2021-2032)
Table 21 Europe Dark Tea Revenue (USD Million) By Application (2021-2032)
Table 22 Europe Dark Tea Revenue (USD Million) By Product (2021-2032)
Table 23 Asia Pacific Dark Tea Revenue (USD Million) By Type (2021-2032)
Table 24 Asia Pacific Dark Tea Revenue (USD Million) By Application (2021-2032)
Table 25 Asia Pacific Dark Tea Revenue (USD Million) By Product (2021-2032)
Table 26 South America Dark Tea Revenue (USD Million) By Type (2021-2032)
Table 27 South America Dark Tea Revenue (USD Million) By Application (2021-2032)
Table 28 South America Dark Tea Revenue (USD Million) By Product (2021-2032)
Table 29 Middle East and Africa Dark Tea Revenue (USD Million) By Type (2021-2032)
Table 30 Middle East and Africa Dark Tea Revenue (USD Million) By Application (2021-2032)
Table 31 Middle East and Africa Dark Tea Revenue (USD Million) By Product (2021-2032)
LIST OF FIGURES
Figure 1. Market Scope
Figure 2. Pricing Forecasts Per Unit, 2023- 2032
Figure 3. Porter’s Five Forces
Figure 4. Global Dark Tea Market Revenue (USD Million) By Regions (2021-2032)
Figure 5. Global Dark Tea Market Share (%) By Regions (2023)
Figure 6. North America Dark Tea Revenue (USD Million) By Country (2021-2032)
Figure 7. United States Dark Tea Revenue (USD Million) By Country (2021-2032)
Figure 8. Canada Dark Tea Revenue (USD Million) By Country (2021-2032)
Figure 9. Mexico Dark Tea Revenue (USD Million) By Country (2021-2032)
Figure 10. Europe Dark Tea Revenue (USD Million) By Country (2021-2032)
Figure 11. Germany Dark Tea Revenue (USD Million) By Country (2021-2032)
Figure 12. France Dark Tea Revenue (USD Million) By Country (2021-2032)
Figure 13. United Kingdom Dark Tea Revenue (USD Million) By Country (2021-2032)
Figure 14. Spain Dark Tea Revenue (USD Million) By Country (2021-2032)
Figure 15. Italy Dark Tea Revenue (USD Million) By Country (2021-2032)
Figure 16. Russia Dark Tea Revenue (USD Million) By Country (2021-2032)
Figure 17. Rest of Europe Dark Tea Revenue (USD Million) By Country (2021-2032)
Figure 11. Asia Pacific Dark Tea Revenue (USD Million) By Country (2021-2032)
Figure 12. China Dark Tea Revenue (USD Million) By Country (2021-2032)
Figure 13. Japan Dark Tea Revenue (USD Million) By Country (2021-2032)
Figure 14. India Dark Tea Revenue (USD Million) By Country (2021-2032)
Figure 15. South Korea Dark Tea Revenue (USD Million) By Country (2021-2032)
Figure 16. Australia Dark Tea Revenue (USD Million) By Country (2021-2032)
Figure 17. South East Asia Dark Tea Revenue (USD Million) By Country (2021-2032)
Figure 18. South America Dark Tea Revenue (USD Million) By Country (2021-2032)
Figure 19. Brazil Dark Tea Revenue (USD Million) By Country (2021-2032)
Figure 20. Argentina Dark Tea Revenue (USD Million) By Country (2021-2032)
Figure 21. Rest of Asia Pacific Dark Tea Revenue (USD Million) By Country (2021-2032)
Figure 22. Middle East and Africa Dark Tea Revenue (USD Million) By Region (2021-2032)
Figure 23. Saudi Arabia Dark Tea Revenue (USD Million) By Region (2021-2032)
Figure 24. The UAE Dark Tea Revenue (USD Million) By Region (2021-2032)
Figure 25. Rest of Middle East Dark Tea Revenue (USD Million) By Region (2021-2032)
Figure 26. South Africa Dark Tea Revenue (USD Million) By Region (2021-2032)
Figure 27. Africa Dark Tea Revenue (USD Million) By Region (2021-2032)
Figure 28. North America Dark Tea Revenue (USD Million) By Type (2021-2032)
Figure 29. North America Dark Tea Revenue (USD Million) By Application (2021-2032)
Figure 30. North America Dark Tea Revenue (USD Million) By Product (2021-2032)
Figure 31. Europe Dark Tea Revenue (USD Million) By Type (2021-2032)
Figure 32. Europe Dark Tea Revenue (USD Million) By Application (2021-2032)
Figure 33. Europe Dark Tea Revenue (USD Million) By Product (2021-2032)
Figure 34. Asia Pacific Dark Tea Revenue (USD Million) By Type (2021-2032)
Figure 35. Asia Pacific Dark Tea Revenue (USD Million) By Application (2021-2032)
Figure 36. Asia Pacific Dark Tea Revenue (USD Million) By Product (2021-2032)
Figure 37. South America Dark Tea Revenue (USD Million) By Type (2021-2032)
Figure 38. South America Dark Tea Revenue (USD Million) By Application (2021-2032)
Figure 39. South America Dark Tea Revenue (USD Million) By Product (2021-2032)
Figure 40. Middle East and Africa Dark Tea Revenue (USD Million) By Type (2021-2032)
Figure 41. Middle East and Africa Dark Tea Revenue (USD Million) By Application (2021-2032)
Figure 42. Middle East and Africa Dark Tea Revenue (USD Million) By Product (2021-2032)
By Type
Piled Teas
Toyama Kurocha
Others
By Application
Supermarkets/Hypermarkets
Convenience Stores
Online Retail
Others
Countries Analyzed
North America (US, Canada, Mexico)
Europe (Germany, UK, France, Spain, Italy, Russia, Rest of Europe)
Asia Pacific (China, India, Japan, South Korea, Australia, South East Asia, Rest of Asia)
South America (Brazil, Argentina, Rest of South America)
Middle East and Africa (Saudi Arabia, UAE, Rest of Middle East, South Africa, Egypt, Rest of Africa)
