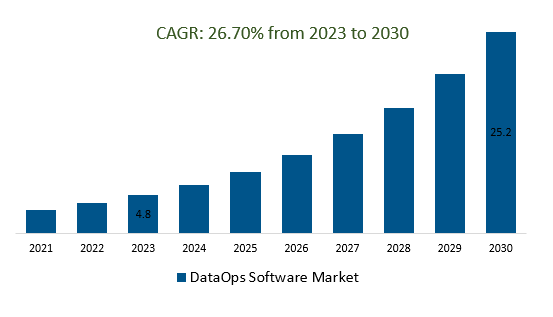
The global DataOps Software Market Size is estimated to be US$ 4.8 Billion in 2023 and is poised to register 26.7% growth over the forecast period from 2023 to 2030 to reach US $ 25.2 billion in 2030.
The market growth is driven by the increasing volume of data generated by businesses necessitates effective data management practices. DataOps software helps organizations streamline data integration, preparation, and analytics processes, thus enabling them to derive insights from big data. Leading companies focusing on Growing Data Complexity, Advanced Analytics and AI Integration, Hybrid and Multi-Cloud Environments, Data Security and Ethical Considerations, and others to boost market shares in the industry.
Market Overview
The DataOps software market is a swiftly evolving segment that aligns data management with DevOps principles, emphasizing agility, collaboration, and automation throughout the data lifecycle. It encompasses tools for data integration, transformation, quality assessment, and more, catering to cross-functional teams. This market offers benefits like faster insights, improved collaboration, and scalability, but requires a cultural shift, addresses integration complexity, and prioritizes data security. Its outlook suggests continued growth driven by data-driven decision-making and integration with emerging technologies like AI/ML and real-time analytics.
Market Dynamics
Market Trends- Companies are launching Automation and AI/ML Integration to attract a consumer base
Automation and AI/ML integration are pivotal trends in the DataOps software market, reshaping how organizations manage data operations. Automation streamlines manual tasks across the data lifecycle, enhancing efficiency and reducing errors. AI/ML integration empowers DataOps tools to predict issues, optimize workflows, and provide actionable insights, elevating data quality and decision-making.
Market Driver- Focus on Data Security demand for efficient DataOps Software Market
Data security is a paramount concern in the DataOps software market, driving innovation in safeguarding sensitive information throughout the data lifecycle. DataOps emphasizes secure data integration, transformation, and dissemination, reducing vulnerabilities and ensuring compliance with regulations. Robust encryption, access controls, and auditing mechanisms are integrated into DataOps pipelines to fortify data protection. As cyber threats evolve, the market responds by offering advanced security features that defend against breaches and unauthorized access. With the growing importance of data privacy and regulatory compliance, data security remains a central pillar of the DataOps ecosystem, fostering trust and resilience in data-driven operations.
Market Opportunity-Introduction of Agile and DevOps Practices
Agile and DevOps practices are foundational elements in the DataOps software market, fostering a collaborative and efficient approach to data management. DataOps leverages Agile methodologies to enable iterative and adaptive data processes, allowing teams to quickly respond to changing requirements and deliver incremental value. DevOps principles, such as automation and continuous integration/continuous deployment (CI/CD), are integrated into DataOps pipelines to ensure rapid and reliable data delivery. This convergence results in streamlined data workflows, improved communication between cross-functional teams, and reduced bottlenecks. By embracing Agile and DevOps practices, the DataOps software market empowers organizations to achieve faster, more accurate, and more responsive data operations, aligning data initiatives with broader business goals.
The global DataOps Software Market is analyzed across Cloud base, On-premise, and others. Of these, the Cloud base is poised to register the fastest growth. Cloud-based solutions are a pivotal trend in the DataOps software market, providing organizations with scalable, flexible, and accessible platforms for streamlined data operations. These solutions enable seamless collaboration, empower advanced analytics, and enhance security, while their pay-as-you-go model offers cost efficiency. Cloud-based DataOps solutions are anticipated to play a central role in meeting the evolving data management needs of businesses, optimizing agility and scalability.
Market Share Analysis- Large enterprises held a significant market share in 2023
The global DataOps Software Market is analyzed across a wide range of application including SME, Large enterprises, and Others. Of these, large enterprises held a significant market share in 2023. Large enterprises are driving the DataOps software market due to their need to efficiently manage complex data operations. DataOps helps them streamline integration, quality control, and analytics, leading to quicker insights, improved collaboration, and scalable operations. As data-driven decision-making gains prominence, the market focuses on offering comprehensive solutions that align with large enterprises' business strategies.
DataOps Software Market Segmentation
By Deployment Mode
By Application
By Region
- North America (United States, Canada, Mexico)
- Europe (Germany, France, United Kingdom, Spain, Italy, Others)
- Asia Pacific (China, India, Japan, South Korea, Australia, Others)
- Latin America (Brazil, Argentina, Others)
- Middle East and Africa (Saudi Arabia, UAE, Kuwait, Other Middle East, South Africa, Nigeria, Other Africa)
DataOps Software Market Companies
- IBM
- Hitachi
- Ryax Technologies
- Atlan
- HPE
- AWS
- Data Kitchen
- StreamSets
- Accelario
- Rivery
- Larsen & Toubro Infotech
* List not exhaustive
DataOps software Market Outlook 2023
1 Market Overview
1.1 Introduction to the DataOps software Market
1.2 Scope of the Study
1.3 Research Objective
1.3.1 Key Market Scope and Segments
1.3.2 Players Covered
1.3.3 Years Considered
2 Executive Summary
2.1 2023 DataOps software Industry- Market Statistics
3 Market Dynamics
3.1 Market Drivers
3.2 Market Challenges
3.3 Market Opportunities
3.4 Market Trends
4 Market Factor Analysis
4.1 Porter’s Five Forces
4.2 Market Entropy
4.2.1 Global DataOps software Market Companies with Area Served
4.2.2 Products Offerings Global DataOps software Market
5 COVID-19 Impact Analysis and Outlook Scenarios
5.1.1 Covid-19 Impact Analysis
5.1.2 Post-COVID-19 Scenario- Low Growth Case
5.1.3 Post-COVID-19 Scenario- Reference Growth Case
5.1.4 Post-COVID-19 Scenario- Low Growth Case
6 Global DataOps software Market Trends
6.1 Global DataOps software Revenue (USD Million) and CAGR (%) by Type (2018-2030)
6.2 Global DataOps software Revenue (USD Million) and CAGR (%) by Applications (2018-2030)
6.3 Global DataOps software Revenue (USD Million) and CAGR (%) by Regions (2018-2030)
7 Global DataOps software Market Revenue (USD Million) by Type, and Applications (2018-2022)
7.1 Global DataOps software Revenue (USD Million) by Type (2018-2022)
7.1.1 Global DataOps software Revenue (USD Million), Market Share (%) by Type (2018-2022)
7.2 Global DataOps software Revenue (USD Million) by Applications (2018-2022)
7.2.1 Global DataOps software Revenue (USD Million), Market Share (%) by Applications (2018-2022)
8 Global DataOps software Development Regional Status and Outlook
8.1 Global DataOps software Revenue (USD Million) By Regions (2018-2022)
8.2 North America DataOps software Revenue (USD Million) by Type, and Application (2018-2022)
8.2.1 North America DataOps software Revenue (USD Million) by Country (2018-2022)
8.2.2 North America DataOps software Revenue (USD Million) by Type (2018-2022)
8.2.3 North America DataOps software Revenue (USD Million) by Applications (2018-2022)
8.3 Europe DataOps software Revenue (USD Million), by Type, and Applications (USD Million) (2018-2022)
8.3.1 Europe DataOps software Revenue (USD Million), by Country (2018-2022)
8.3.2 Europe DataOps software Revenue (USD Million) by Type (2018-2022)
8.3.3 Europe DataOps software Revenue (USD Million) by Applications (2018-2022)
8.4 Asia Pacific DataOps software Revenue (USD Million), and Revenue (USD Million) by Type, and Applications (2018-2022)
8.4.1 Asia Pacific DataOps software Revenue (USD Million) by Country (2018-2022)
8.4.2 Asia Pacific DataOps software Revenue (USD Million) by Type (2018-2022)
8.4.3 Asia Pacific DataOps software Revenue (USD Million) by Applications (2018-2022)
8.5 South America DataOps software Revenue (USD Million), by Type, and Applications (2018-2022)
8.5.1 South America DataOps software Revenue (USD Million), by Country (2018-2022)
8.5.2 South America DataOps software Revenue (USD Million) by Type (2018-2022)
8.5.3 South America DataOps software Revenue (USD Million) by Applications (2018-2022)
8.6 Middle East and Africa DataOps software Revenue (USD Million), by Type, Technology, Application, Thickness (2018-2022)
8.6.1 Middle East and Africa DataOps software Revenue (USD Million) by Country (2018-2022)
8.6.2 Middle East and Africa DataOps software Revenue (USD Million) by Type (2018-2022)
8.6.3 Middle East and Africa DataOps software Revenue (USD Million) by Applications (2018-2022)
9 Company Profiles
10 Global DataOps software Market Revenue (USD Million), by Type, and Applications (2023-2030)
10.1 Global DataOps software Revenue (USD Million) and Market Share (%) by Type (2023-2030)
10.1.1 Global DataOps software Revenue (USD Million), and Market Share (%) by Type (2023-2030)
10.2 Global DataOps software Revenue (USD Million) and Market Share (%) by Applications (2023-2030)
10.2.1 Global DataOps software Revenue (USD Million), and Market Share (%) by Applications (2023-2030)
11 Global DataOps software Development Regional Status and Outlook Forecast
11.1 Global DataOps software Revenue (USD Million) By Regions (2023-2030)
11.2 North America DataOps software Revenue (USD Million) by Type, and Applications (2023-2030)
11.2.1 North America DataOps software Revenue (USD) Million by Country (2023-2030)
11.2.2 North America DataOps software Revenue (USD Million), by Type (2023-2030)
11.2.3 North America DataOps software Revenue (USD Million), Market Share (%) by Applications (2023-2030)
11.3 Europe DataOps software Revenue (USD Million), by Type, and Applications (2023-2030)
11.3.1 Europe DataOps software Revenue (USD Million), by Country (2023-2030)
11.3.2 Europe DataOps software Revenue (USD Million), by Type (2023-2030)
11.3.3 Europe DataOps software Revenue (USD Million), by Applications (2023-2030)
11.4 Asia Pacific DataOps software Revenue (USD Million) by Type, and Applications (2023-2030)
11.4.1 Asia Pacific DataOps software Revenue (USD Million), by Country (2023-2030)
11.4.2 Asia Pacific DataOps software Revenue (USD Million), by Type (2023-2030)
11.4.3 Asia Pacific DataOps software Revenue (USD Million), by Applications (2023-2030)
11.5 South America DataOps software Revenue (USD Million), by Type, and Applications (2023-2030)
11.5.1 South America DataOps software Revenue (USD Million), by Country (2023-2030)
11.5.2 South America DataOps software Revenue (USD Million), by Type (2023-2030)
11.5.3 South America DataOps software Revenue (USD Million), by Applications (2023-2030)
11.6 Middle East and Africa DataOps software Revenue (USD Million), by Type, and Applications (2023-2030)
11.6.1 Middle East and Africa DataOps software Revenue (USD Million), by Region (2023-2030)
11.6.2 Middle East and Africa DataOps software Revenue (USD Million), by Type (2023-2030)
11.6.3 Middle East and Africa DataOps software Revenue (USD Million), by Applications (2023-2030)
12 Methodology and Data Sources
12.1 Methodology/Research Approach
12.1.1 Research Programs/Design
12.1.2 Market Size Estimation
12.1.3 Market Breakdown and Data Triangulation
12.2 Data Sources
12.2.1 Secondary Sources
12.2.2 Primary Sources
12.3 Disclaimer
List of Tables
Table 1 Market Segmentation Analysis
Table 2 Global DataOps software Market Companies with Areas Served
Table 3 Products Offerings Global DataOps software Market
Table 4 Low Growth Scenario Forecasts
Table 5 Reference Case Growth Scenario
Table 6 High Growth Case Scenario
Table 7 Global DataOps software Revenue (USD Million) And CAGR (%) By Type (2018-2030)
Table 8 Global DataOps software Revenue (USD Million) And CAGR (%) By Applications (2018-2030)
Table 9 Global DataOps software Revenue (USD Million) And CAGR (%) By Regions (2018-2030)
Table 10 Global DataOps software Revenue (USD Million) By Type (2018-2022)
Table 11 Global DataOps software Revenue Market Share (%) By Type (2018-2022)
Table 12 Global DataOps software Revenue (USD Million) By Applications (2018-2022)
Table 13 Global DataOps software Revenue Market Share (%) By Applications (2018-2022)
Table 14 Global DataOps software Market Revenue (USD Million) By Regions (2018-2022)
Table 15 Global DataOps software Market Share (%) By Regions (2018-2022)
Table 16 North America DataOps software Revenue (USD Million) By Country (2018-2022)
Table 17 North America DataOps software Revenue (USD Million) By Type (2018-2022)
Table 18 North America DataOps software Revenue (USD Million) By Applications (2018-2022)
Table 19 Europe DataOps software Revenue (USD Million) By Country (2018-2022)
Table 20 Europe DataOps software Revenue (USD Million) By Type (2018-2022)
Table 21 Europe DataOps software Revenue (USD Million) By Applications (2018-2022)
Table 22 Asia Pacific DataOps software Revenue (USD Million) By Country (2018-2022)
Table 23 Asia Pacific DataOps software Revenue (USD Million) By Type (2018-2022)
Table 24 Asia Pacific DataOps software Revenue (USD Million) By Applications (2018-2022)
Table 25 South America DataOps software Revenue (USD Million) By Country (2018-2022)
Table 26 South America DataOps software Revenue (USD Million) By Type (2018-2022)
Table 27 South America DataOps software Revenue (USD Million) By Applications (2018-2022)
Table 28 Middle East and Africa DataOps software Revenue (USD Million) By Region (2018-2022)
Table 29 Middle East and Africa DataOps software Revenue (USD Million) By Type (2018-2022)
Table 30 Middle East and Africa DataOps software Revenue (USD Million) By Applications (2018-2022)
Table 31 Financial Analysis
Table 32 Global DataOps software Revenue (USD Million) By Type (2023-2030)
Table 33 Global DataOps software Revenue Market Share (%) By Type (2023-2030)
Table 34 Global DataOps software Revenue (USD Million) By Applications (2023-2030)
Table 35 Global DataOps software Revenue Market Share (%) By Applications (2023-2030)
Table 36 Global DataOps software Market Revenue (USD Million), And Revenue (USD Million) By Regions (2023-2030)
Table 37 North America DataOps software Revenue (USD)By Country (2023-2030)
Table 38 North America DataOps software Revenue (USD Million) By Type (2023-2030)
Table 39 North America DataOps software Revenue (USD Million) By Applications (2023-2030)
Table 40 Europe DataOps software Revenue (USD Million) By Country (2023-2030)
Table 41 Europe DataOps software Revenue (USD Million) By Type (2023-2030)
Table 42 Europe DataOps software Revenue (USD Million) By Applications (2023-2030)
Table 43 Asia Pacific DataOps software Revenue (USD Million) By Country (2023-2030)
Table 44 Asia Pacific DataOps software Revenue (USD Million) By Type (2023-2030)
Table 45 Asia Pacific DataOps software Revenue (USD Million) By Applications (2023-2030)
Table 46 South America DataOps software Revenue (USD Million) By Country (2023-2030)
Table 47 South America DataOps software Revenue (USD Million) By Type (2023-2030)
Table 48 South America DataOps software Revenue (USD Million) By Applications (2023-2030)
Table 49 Middle East and Africa DataOps software Revenue (USD Million) By Region (2023-2030)
Table 50 Middle East and Africa DataOps software Revenue (USD Million) By Region (2023-2030)
Table 51 Middle East and Africa DataOps software Revenue (USD Million) By Type (2023-2030)
Table 52 Middle East and Africa DataOps software Revenue (USD Million) By Applications (2023-2030)
Table 53 Research Programs/Design for This Report
Table 54 Key Data Information from Secondary Sources
Table 55 Key Data Information from Primary Sources
List of Figures
Figure 1 Market Scope
Figure 2 Porter’s Five Forces
Figure 3 Global DataOps software Revenue (USD Million) By Type (2018-2022)
Figure 4 Global DataOps software Revenue Market Share (%) By Type (2022)
Figure 5 Global DataOps software Revenue (USD Million) By Applications (2018-2022)
Figure 6 Global DataOps software Revenue Market Share (%) By Applications (2022)
Figure 7 Global DataOps software Market Revenue (USD Million) By Regions (2018-2022)
Figure 8 Global DataOps software Market Share (%) By Regions (2022)
Figure 9 North America DataOps software Revenue (USD Million) By Country (2018-2022)
Figure 10 North America DataOps software Revenue (USD Million) By Type (2018-2022)
Figure 11 North America DataOps software Revenue (USD Million) By Applications (2018-2022)
Figure 12 Europe DataOps software Revenue (USD Million) By Country (2018-2022)
Figure 13 Europe DataOps software Revenue (USD Million) By Type (2018-2022)
Figure 14 Europe DataOps software Revenue (USD Million) By Applications (2018-2022)
Figure 15 Asia Pacific DataOps software Revenue (USD Million) By Country (2018-2022)
Figure 16 Asia Pacific DataOps software Revenue (USD Million) By Type (2018-2022)
Figure 17 Asia Pacific DataOps software Revenue (USD Million) By Applications (2018-2022)
Figure 18 South America DataOps software Revenue (USD Million) By Country (2018-2022)
Figure 19 South America DataOps software Revenue (USD Million) By Type (2018-2022)
Figure 20 South America DataOps software Revenue (USD Million) By Applications (2018-2022)
Figure 21 Middle East and Africa DataOps software Revenue (USD Million) By Region (2018-2022)
Figure 22 Middle East and Africa DataOps software Revenue (USD Million) By Type (2018-2022)
Figure 23 Middle East and Africa DataOps software Revenue (USD Million) By Applications (2018-2022)
Figure 24 Global DataOps software Revenue (USD Million) By Type (2023-2030)
Figure 25 Global DataOps software Revenue Market Share (%) By Type (2030)
Figure 26 Global DataOps software Revenue (USD Million) By Applications (2023-2030)
Figure 27 Global DataOps software Revenue Market Share (%) By Applications (2030)
Figure 28 Global DataOps software Market Revenue (USD Million) By Regions (2023-2030)
Figure 29 North America DataOps software Revenue (USD Million) By Country (2023-2030)
Figure 30 North America DataOps software Revenue (USD Million) By Type (2023-2030)
Figure 31 North America DataOps software Revenue (USD Million) By Applications (2023-2030)
Figure 32 Europe DataOps software Revenue (USD Million) By Country (2023-2030)
Figure 33 Europe DataOps software Revenue (USD Million) By Type (2023-2030)
Figure 34 Europe DataOps software Revenue (USD Million) By Applications (2023-2030)
Figure 35 Asia Pacific DataOps software Revenue (USD Million) By Country (2023-2030)
Figure 36 Asia Pacific DataOps software Revenue (USD Million) By Type (2023-2030)
Figure 37 Asia Pacific DataOps software Revenue (USD Million) By Applications (2023-2030)
Figure 38 South America DataOps software Revenue (USD Million) By Country (2023-2030)
Figure 39 South America DataOps software Revenue (USD Million) By Type (2023-2030)
Figure 40 South America DataOps software Revenue (USD Million) By Applications (2023-2030)
Figure 41 Middle East and Africa DataOps software Revenue (USD Million) By Region (2023-2030)
Figure 42 Middle East and Africa DataOps software Revenue (USD Million) By Region (2023-2030)
Figure 43 Middle East and Africa DataOps software Revenue (USD Million) By Type (2023-2030)
Figure 44 Middle East and Africa DataOps software Revenue (USD Million) By Applications (2023-2030)
Figure 45 Bottom-Up and Top-Down Approaches For This Report
Figure 46 Data Triangulation
