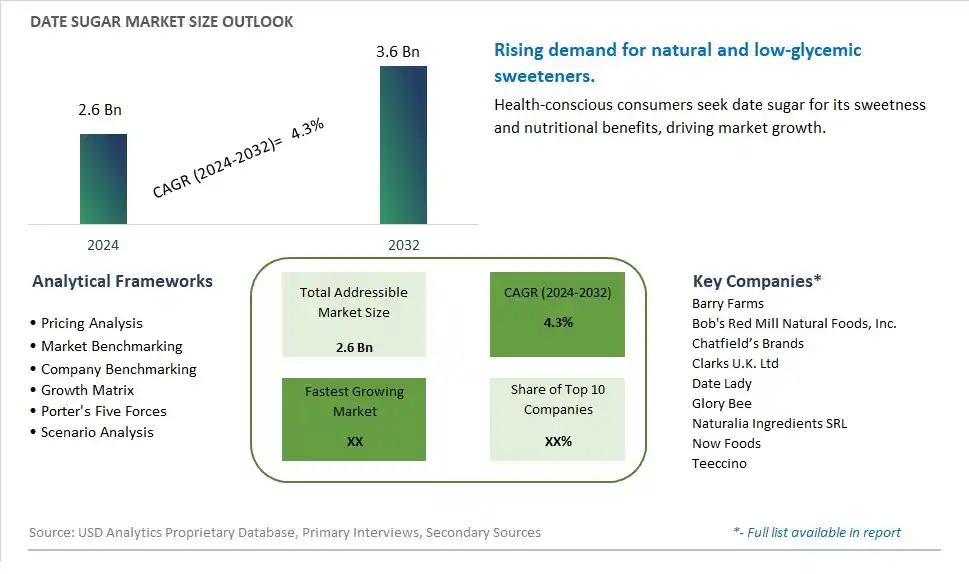
Global Date Sugar Market Size is valued at $2.6 Billion in 2024 and is forecast to register a growth rate (CAGR) of 4.3% to reach $3.6 Billion by 2032.
The global Date Sugar Market Comprehensive Study analyzes and forecasts the market size across 6 regions and 24 countries for diverse segments -By Form (Date Granules & Crystal, Powdered Date Sugar, Date Syrup/ Liquid), By End-User (Industrial Consumption, Food Production, Beverage, Retail), By Type (Organic, Conventional), By Sales Channel (Online, Offline)
An Introduction to Date Sugar Market
In 2024, the Date Sugar market is witnessing significant growth, driven by the increasing demand for natural and nutrient-rich sweeteners. Date sugar, made from finely ground dried dates, is valued for its rich caramel flavor and high content of vitamins, minerals, and antioxidants. The market is supported by the growing trend towards clean-label and low-glycemic sweeteners. Advances in date processing and drying technologies are enhancing the quality, flavor, and nutritional profile of date sugar. The market is also benefiting from the trend towards sustainable and minimally processed ingredients, appealing to health-conscious consumers seeking natural and wholesome sweetening alternatives.
Date Sugar Competitive Landscape
The market report analyses the leading companies in the industry including Barry Farms, Bob's Red Mill Natural Foods, Inc., Chatfield’s Brands, Clarks U.K. Ltd, Date Lady, Glory Bee, Naturalia Ingredients SRL, Now Foods, Teeccino, and Others.
Date Sugar Market Dynamics
Date Sugar Market Trend: Rising Demand for Natural Sweeteners
A prominent trend in the date sugar market is the rising demand for natural sweeteners. As consumers become more health-conscious and seek alternatives to refined sugars and artificial sweeteners, there is an increasing interest in date sugar as a natural and unprocessed sweetening option. This trend is driven by a growing awareness of the health benefits of date sugar, including its nutritional content, fiber content, and low glycemic index, making it an attractive choice for health-conscious individuals and those with dietary restrictions.
Date Sugar Market Driver: Health and Wellness Considerations
A key driver influencing the date sugar market is the emphasis on health and wellness considerations among consumers. Factors such as concerns about obesity, diabetes, and the desire for cleaner label products are driving the demand for date sugar as a healthier alternative to traditional sugars. This driver is pushing manufacturers to promote the nutritional benefits of date sugar, position it as a natural and wholesome sweetener, and develop innovative products that incorporate date sugar into various food and beverage applications.
Date Sugar Market Opportunity: Diversification into Functional Foods and Baking Products
An exciting opportunity in the date sugar market lies in diversification into functional foods and baking products. There is potential to introduce date sugar as an ingredient in functional foods such as energy bars, granola mixes, cereals, and snacks, capitalizing on its natural sweetness and nutritional profile. Additionally, there is an opportunity to develop baking products that utilize date sugar as a natural sweetener in baked goods such as cookies, cakes, muffins, and bread, appealing to health-conscious consumers looking for healthier options in their baked treats. This diversification into functional foods and baking products allows companies to expand their product offerings, target new market segments, and meet the growing demand for natural and healthier food alternatives.
Date Sugar Market Share Analysis: Powdered Date Sugar segment generated the highest revenue share in the industry
The Powdered Date Sugar segment is the largest in the Date Sugar Market by form. Powdered date sugar is favored for its fine texture, which makes it an ideal sweetener for baking, beverages, and a variety of food applications. Its ability to dissolve easily and blend seamlessly into recipes enhances its versatility and usability compared to granules or syrup forms. The increasing consumer demand for natural and unrefined sweeteners that retain the nutritional benefits of dates has significantly boosted the popularity of powdered date sugar. Additionally, the growing trend of health-conscious baking and the preference for low-glycemic index sweeteners have further cemented powdered date sugar's position as the largest segment in the market.
Date Sugar Market Share Analysis: Food Production is the fastest growing segment over the forecast period to 2032
The Food Production segment is expected to be the fastest-growing in the Date Sugar Market by 2032. This growth is driven by the rising demand for natural and healthier ingredients in the food industry. As consumers become more health-conscious and seek out natural alternatives to refined sugars, food manufacturers are increasingly incorporating date sugar into their products. Date sugar is being used in a wide range of food products, including bakery items, snacks, cereals, and dairy products, due to its nutritional benefits and natural sweetness. The trend towards clean label products, where fewer and more natural ingredients are preferred, is also contributing to the increased use of date sugar in food production. As a result, the food production segment is poised for significant growth, reflecting the broader industry shift towards healthier and more natural food ingredients.
Date Sugar Market Share Analysis: Conventional segment generated the highest revenue share in the industry
The Conventional segment is the largest in the Date Sugar Market by type. Conventional date sugar is widely available and generally more affordable compared to its organic counterpart. Its production process is well-established and scalable, making it accessible to a broad range of consumers and industries. The extensive use of conventional date sugar in both industrial and household settings contributes to its dominance in the market. Further, while organic products are gaining popularity, the majority of consumers and manufacturers still rely on conventional date sugar for its cost-effectiveness and widespread availability, ensuring its leading position in the market.
Date Sugar Market Share Analysis: Online is the fastest growing segment over the forecast period to 2032
The Online segment is expected to be the fastest-growing in the Date Sugar Market by 2032. This growth is driven by the increasing shift towards e-commerce and digital shopping platforms. Online sales channels offer consumers unparalleled convenience, a wider selection of products, and the ability to compare prices and read reviews before making a purchase. The rise of health and wellness e-commerce platforms that specialize in natural and organic products has also contributed to the growth of date sugar sales online. The Past few yearshas further accelerated this trend, as more consumers turn to online shopping for their grocery and specialty food needs. As digital connectivity continues to improve and consumers seek the convenience of home delivery, the online sales channel for date sugar is set to experience substantial growth, outpacing traditional retail channels.
Date Sugar Market Segmentation
By Form
Date Granules & Crystal
Powdered Date Sugar
Date Syrup/ Liquid
By End-User
Industrial Consumption
Food Production
Beverage
Retail
By Type
Organic
Conventional
By Sales Channel
Online
Offline
Countries Analyzed
North America (US, Canada, Mexico)
Europe (Germany, UK, France, Spain, Italy, Russia, Rest of Europe)
Asia Pacific (China, India, Japan, South Korea, Australia, South East Asia, Rest of Asia)
South America (Brazil, Argentina, Rest of South America)
Middle East and Africa (Saudi Arabia, UAE, Rest of Middle East, South Africa, Egypt, Rest of Africa)
Date Sugar Companies Profiled in the Study
Barry Farms
Bob's Red Mill Natural Foods, Inc.
Chatfield’s Brands
Clarks U.K. Ltd
Date Lady
Glory Bee
Naturalia Ingredients SRL
Now Foods
Teeccino
*- List Not Exhaustive
Chapter 1. TABLE OF CONTENTS
Chapter 2. Introduction to Date Sugar Market
2.1. Market Overview
2.2. Key Statistics and Report Highlights
2.3. Scope of the Comprehensive Study
2.3.1. Market Definition
2.3.2 Countries and Regions Covered
2.3.3 Research Objective
2.3.4 Units, Currency, and Conversions
2.3.5 Industry Value Chain
2.4. Key Market Segments
2.5. Key Companies
2.6. Study Period
Chapter 3. Strategic Analysis Review
3.1. Date Sugar Pricing Analysis and Forecast
3.2. Porter’s Five Forces
3.3. Market Ecosystem
3.4. SWOT Analysis
3.5. Regulatory Scenario
3.3. Effects of Inflation, Russia-Ukraine War, moderating economic growth, and other macroeconomic factors
Chapter 4. Competitive Landscape
4.1. Market Share Analysis
4.1.1. Global Date Sugar Market Share by Company, 2023
4.1.2. Product Offerings of Leading Date Sugar Companies
4.2. Market Entropy
4.2.1. New Product Launches in the Industry
4.2.2. Mergers, Acquisitions, Joint ventures, and Partnerships
4.3. Key Strategies and Best Practices
Chapter 5. Global Market Projections: Best, Reference, and Low Case Scenarios
5.1. Growth Analysis- Case Scenario Definitions
5.2. Low Growth Case Scenario Forecasts
5.3. Reference Growth Case Scenario Forecasts
5.4. High Growth Case Scenario Forecasts
Chapter 6. Market Dynamics
6.1. Date Sugar Market Drivers
6.2. Date Sugar Market Challenges
6.6. Date Sugar Market Opportunities
6.4. Date Sugar Market Trends
Chapter 7. Global Date Sugar Market Outlook Trends
7.1. Global Date Sugar Revenue (USD Million) and CAGR (%) by Type (2021-2032)
7.2. Global Date Sugar Revenue (USD Million) and CAGR (%) by Application (2021-2032)
7.3. Global Date Sugar Revenue (USD Million) and CAGR (%) by Product (2021-2032)
By Form
Date Granules & Crystal
Powdered Date Sugar
Date Syrup/ Liquid
By End-User
Industrial Consumption
Food Production
Beverage
Retail
By Type
Organic
Conventional
By Sales Channel
Online
Offline
Chapter 8. Global Date Sugar Regional Analysis and Outlook
8.1. Global Date Sugar Revenue (USD Million) By Regions (2021- 2032)
8.2. North America Date Sugar Revenue (USD Million) by Country (2021-2032)
8.2.1. United States Date Sugar Regional Analysis and Outlook
8.2.2. Canada Date Sugar Regional Analysis and Outlook
8.2.3. Mexico Date Sugar Regional Analysis and Outlook
8.3. Europe Date Sugar Revenue (USD Million), by Country (2021-2032)
8.3.1. Germany Date Sugar Regional Analysis and Outlook
8.3.2. France Date Sugar Regional Analysis and Outlook
8.3.3. United Kingdom Date Sugar Regional Analysis and Outlook
8.3.4. Spain Date Sugar Regional Analysis and Outlook
8.3.5. Italy Date Sugar Regional Analysis and Outlook
8.3.6. Russia Date Sugar Regional Analysis and Outlook
8.3.7. Rest of Europe Date Sugar Regional Analysis and Outlook
8.4. Asia Pacific Date Sugar Revenue (USD Million) by Country (2021-2032)
8.4.1. China Date Sugar Regional Analysis and Outlook
8.4.2. Japan Date Sugar Regional Analysis and Outlook
8.4.3. India Date Sugar Regional Analysis and Outlook
8.4.4. South Korea Date Sugar Regional Analysis and Outlook
8.4.5. Australia Date Sugar Regional Analysis and Outlook
8.4.6. South East Asia Date Sugar Regional Analysis and Outlook
8.4.7. Rest of Asia Pacific Date Sugar Regional Analysis and Outlook
8.5. South America Date Sugar Revenue (USD Million), by Country (2021-2032)
8.5.1. Brazil Date Sugar Regional Analysis and Outlook
8.5.2. Argentina Date Sugar Regional Analysis and Outlook
8.5.3. Rest of South America Date Sugar Regional Analysis and Outlook
8.6. Middle East and Africa Date Sugar Revenue (USD Million) by Country (2021-2032)
8.6.1. Middle East Date Sugar Regional Analysis and Outlook
8.6.2. Africa Date Sugar Regional Analysis and Outlook
Chapter 9. North America Date Sugar Analysis and Outlook
9.1. North America Date Sugar Revenue (USD Million) by Segments (2021-2032)
9.1.1. North America Date Sugar Revenue (USD Million) by Type (2021-2032)
9.1.2. North America Date Sugar Revenue (USD Million) by Application (2021-2032)
9.1.3. North America Date Sugar Revenue (USD Million) by Product (2021-2032)
By Form
Date Granules & Crystal
Powdered Date Sugar
Date Syrup/ Liquid
By End-User
Industrial Consumption
Food Production
Beverage
Retail
By Type
Organic
Conventional
By Sales Channel
Online
Offline
Chapter 10. Europe Date Sugar Analysis and Outlook
10.1. Europe Date Sugar Revenue (USD Million), by Segments (USD Million) (2021-2032)
10.1.1. Europe Date Sugar Revenue (USD Million) by Type (2021-2032)
10.1.2. Europe Date Sugar Revenue (USD Million) by Application (2021-2032)
10.1.3. Europe Date Sugar Revenue (USD Million) by Product (2021-2032)
By Form
Date Granules & Crystal
Powdered Date Sugar
Date Syrup/ Liquid
By End-User
Industrial Consumption
Food Production
Beverage
Retail
By Type
Organic
Conventional
By Sales Channel
Online
Offline
Chapter 11. Asia Pacific Date Sugar Analysis and Outlook
11.1. Asia Pacific Date Sugar Revenue (USD Million), and Revenue (USD Million) by Segments (2021-2032)
11.1.1. Asia Pacific Date Sugar Revenue (USD Million) by Type (2021-2032)
11.1.2. Asia Pacific Date Sugar Revenue (USD Million) by Application (2021-2032)
11.1.3. Asia Pacific Date Sugar Revenue (USD Million) by Product (2021-2032)
By Form
Date Granules & Crystal
Powdered Date Sugar
Date Syrup/ Liquid
By End-User
Industrial Consumption
Food Production
Beverage
Retail
By Type
Organic
Conventional
By Sales Channel
Online
Offline
Chapter 12. South America Date Sugar Analysis and Outlook
12.1. South America Date Sugar Revenue (USD Million), by Segments (2021-2032)
12.1.1. South America Date Sugar Revenue (USD Million) by Type (2021-2032)
12.1.2. South America Date Sugar Revenue (USD Million) by Application (2021-2032)
12.1.3. South America Date Sugar Revenue (USD Million) by Product (2021-2032)
By Form
Date Granules & Crystal
Powdered Date Sugar
Date Syrup/ Liquid
By End-User
Industrial Consumption
Food Production
Beverage
Retail
By Type
Organic
Conventional
By Sales Channel
Online
Offline
Chapter 13. Middle East and Africa Date Sugar Analysis and Outlook
13.1. Middle East and Africa Date Sugar Revenue (USD Million), by Segments (2021-2032)
13.1.1. Middle East and Africa Date Sugar Revenue (USD Million) by Type (2021-2032)
13.1.2. Middle East and Africa Date Sugar Revenue (USD Million) by Application (2021-2032)
13.1.3. Middle East and Africa Date Sugar Revenue (USD Million) by Product (2021-2032)
By Form
Date Granules & Crystal
Powdered Date Sugar
Date Syrup/ Liquid
By End-User
Industrial Consumption
Food Production
Beverage
Retail
By Type
Organic
Conventional
By Sales Channel
Online
Offline
Chapter 14. Date Sugar Company Profiles
14.1 Business Overview
14.2 Product Profiles
14.3 SWOT Profiles
14.5 Recent Developments
14.6 Financial Profile
List of Companies
Barry Farms
Bob's Red Mill Natural Foods, Inc.
Chatfield’s Brands
Clarks U.K. Ltd
Date Lady
Glory Bee
Naturalia Ingredients SRL
Now Foods
Teeccino
15. Methodology and Data Sources
15.1 Customization Offerings
15.2 Subscription Services
15.3 Related Reports
15.4 Publisher Expertise
LIST OF TABLES
Table 1 Market Segmentation Analysis
Table 2 Global Date Sugar Market Share of Leading Companies, 2023
Table 3 Product Offerings of Leading Companies
Table 4 Low Growth Scenario Forecasts
Table 5 Reference Case Growth Scenario
Table 6 High Growth Case Scenario
Table 7 Global Date Sugar Revenue (USD Million) And CAGR (%) By Type (2021-2032)
Table 8 Global Date Sugar Revenue (USD Million) And CAGR (%) By Application (2021-2032)
Table 9 Global Date Sugar Revenue (USD Million) And CAGR (%) By Product (2021-2032)
Table 10 Global Date Sugar Market Revenue (USD Million) By Regions (2021-2032)
Table 11 Global Date Sugar Market Share (%) By Regions (2021-2032)
Table 12 North America Date Sugar Revenue (USD Million) By Country (2021-2032)
Table 13 Europe Date Sugar Revenue (USD Million) By Country (2021-2032)
Table 14 Asia Pacific Date Sugar Revenue (USD Million) By Country (2021-2032)
Table 15 South America Date Sugar Revenue (USD Million) By Country (2021-2032)
Table 16 Middle East and Africa Date Sugar Revenue (USD Million) By Region (2021-2032)
Table 17 North America Date Sugar Revenue (USD Million) By Type (2021-2032)
Table 18 North America Date Sugar Revenue (USD Million) By Application (2021-2032)
Table 19 North America Date Sugar Revenue (USD Million) By Product (2021-2032)
Table 20 Europe Date Sugar Revenue (USD Million) By Type (2021-2032)
Table 21 Europe Date Sugar Revenue (USD Million) By Application (2021-2032)
Table 22 Europe Date Sugar Revenue (USD Million) By Product (2021-2032)
Table 23 Asia Pacific Date Sugar Revenue (USD Million) By Type (2021-2032)
Table 24 Asia Pacific Date Sugar Revenue (USD Million) By Application (2021-2032)
Table 25 Asia Pacific Date Sugar Revenue (USD Million) By Product (2021-2032)
Table 26 South America Date Sugar Revenue (USD Million) By Type (2021-2032)
Table 27 South America Date Sugar Revenue (USD Million) By Application (2021-2032)
Table 28 South America Date Sugar Revenue (USD Million) By Product (2021-2032)
Table 29 Middle East and Africa Date Sugar Revenue (USD Million) By Type (2021-2032)
Table 30 Middle East and Africa Date Sugar Revenue (USD Million) By Application (2021-2032)
Table 31 Middle East and Africa Date Sugar Revenue (USD Million) By Product (2021-2032)
LIST OF FIGURES
Figure 1. Market Scope
Figure 2. Pricing Forecasts Per Unit, 2023- 2032
Figure 3. Porter’s Five Forces
Figure 4. Global Date Sugar Market Revenue (USD Million) By Regions (2021-2032)
Figure 5. Global Date Sugar Market Share (%) By Regions (2023)
Figure 6. North America Date Sugar Revenue (USD Million) By Country (2021-2032)
Figure 7. United States Date Sugar Revenue (USD Million) By Country (2021-2032)
Figure 8. Canada Date Sugar Revenue (USD Million) By Country (2021-2032)
Figure 9. Mexico Date Sugar Revenue (USD Million) By Country (2021-2032)
Figure 10. Europe Date Sugar Revenue (USD Million) By Country (2021-2032)
Figure 11. Germany Date Sugar Revenue (USD Million) By Country (2021-2032)
Figure 12. France Date Sugar Revenue (USD Million) By Country (2021-2032)
Figure 13. United Kingdom Date Sugar Revenue (USD Million) By Country (2021-2032)
Figure 14. Spain Date Sugar Revenue (USD Million) By Country (2021-2032)
Figure 15. Italy Date Sugar Revenue (USD Million) By Country (2021-2032)
Figure 16. Russia Date Sugar Revenue (USD Million) By Country (2021-2032)
Figure 17. Rest of Europe Date Sugar Revenue (USD Million) By Country (2021-2032)
Figure 11. Asia Pacific Date Sugar Revenue (USD Million) By Country (2021-2032)
Figure 12. China Date Sugar Revenue (USD Million) By Country (2021-2032)
Figure 13. Japan Date Sugar Revenue (USD Million) By Country (2021-2032)
Figure 14. India Date Sugar Revenue (USD Million) By Country (2021-2032)
Figure 15. South Korea Date Sugar Revenue (USD Million) By Country (2021-2032)
Figure 16. Australia Date Sugar Revenue (USD Million) By Country (2021-2032)
Figure 17. South East Asia Date Sugar Revenue (USD Million) By Country (2021-2032)
Figure 18. South America Date Sugar Revenue (USD Million) By Country (2021-2032)
Figure 19. Brazil Date Sugar Revenue (USD Million) By Country (2021-2032)
Figure 20. Argentina Date Sugar Revenue (USD Million) By Country (2021-2032)
Figure 21. Rest of Asia Pacific Date Sugar Revenue (USD Million) By Country (2021-2032)
Figure 22. Middle East and Africa Date Sugar Revenue (USD Million) By Region (2021-2032)
Figure 23. Saudi Arabia Date Sugar Revenue (USD Million) By Region (2021-2032)
Figure 24. The UAE Date Sugar Revenue (USD Million) By Region (2021-2032)
Figure 25. Rest of Middle East Date Sugar Revenue (USD Million) By Region (2021-2032)
Figure 26. South Africa Date Sugar Revenue (USD Million) By Region (2021-2032)
Figure 27. Africa Date Sugar Revenue (USD Million) By Region (2021-2032)
Figure 28. North America Date Sugar Revenue (USD Million) By Type (2021-2032)
Figure 29. North America Date Sugar Revenue (USD Million) By Application (2021-2032)
Figure 30. North America Date Sugar Revenue (USD Million) By Product (2021-2032)
Figure 31. Europe Date Sugar Revenue (USD Million) By Type (2021-2032)
Figure 32. Europe Date Sugar Revenue (USD Million) By Application (2021-2032)
Figure 33. Europe Date Sugar Revenue (USD Million) By Product (2021-2032)
Figure 34. Asia Pacific Date Sugar Revenue (USD Million) By Type (2021-2032)
Figure 35. Asia Pacific Date Sugar Revenue (USD Million) By Application (2021-2032)
Figure 36. Asia Pacific Date Sugar Revenue (USD Million) By Product (2021-2032)
Figure 37. South America Date Sugar Revenue (USD Million) By Type (2021-2032)
Figure 38. South America Date Sugar Revenue (USD Million) By Application (2021-2032)
Figure 39. South America Date Sugar Revenue (USD Million) By Product (2021-2032)
Figure 40. Middle East and Africa Date Sugar Revenue (USD Million) By Type (2021-2032)
Figure 41. Middle East and Africa Date Sugar Revenue (USD Million) By Application (2021-2032)
Figure 42. Middle East and Africa Date Sugar Revenue (USD Million) By Product (2021-2032)
By Form
Date Granules & Crystal
Powdered Date Sugar
Date Syrup/ Liquid
By End-User
Industrial Consumption
Food Production
Beverage
Retail
By Type
Organic
Conventional
By Sales Channel
Online
Offline
Countries Analyzed
North America (US, Canada, Mexico)
Europe (Germany, UK, France, Spain, Italy, Russia, Rest of Europe)
Asia Pacific (China, India, Japan, South Korea, Australia, South East Asia, Rest of Asia)
South America (Brazil, Argentina, Rest of South America)
Middle East and Africa (Saudi Arabia, UAE, Rest of Middle East, South Africa, Egypt, Rest of Africa)
