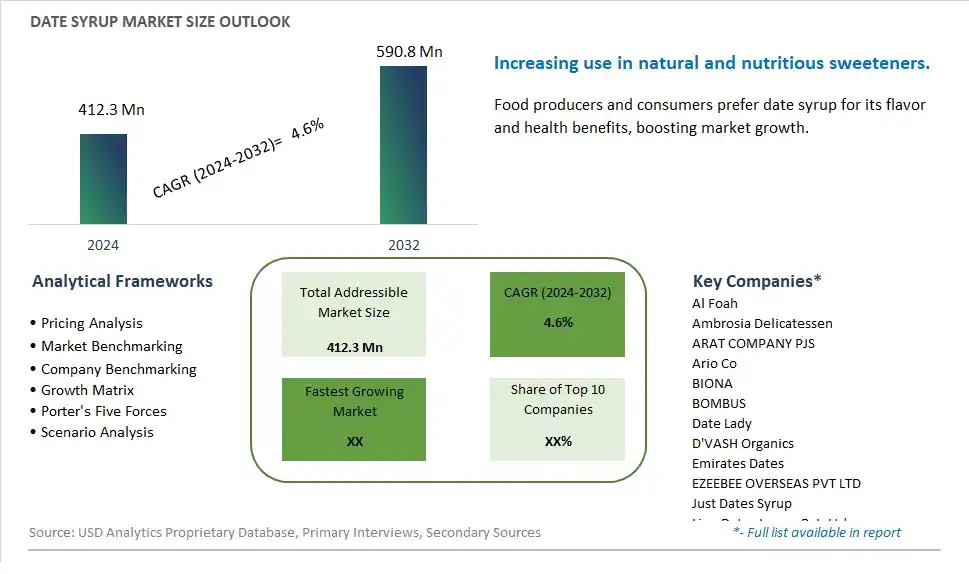
Global Date Syrup Market Size is valued at $412.3 Million in 2024 and is forecast to register a growth rate (CAGR) of 4.6% to reach $590.8 Million by 2032.
The global Date Syrup Market Comprehensive Study analyzes and forecasts the market size across 6 regions and 24 countries for diverse segments -By Type (Organic, Conventional), By End-User (Food & Beverage, -Bakery & Confectionery, -Dairy & Desserts, -Snacks & Cereals, -Beverages, -Others, Nutraceuticals, Cosmetics and Personal Care, Foodservice, Retail/ Household, Others), By Distribution Channel (Business to Business, Business to Consumers, -Hypermarkets/ Supermarkets, -Specialty Stores, -Convenience Stores, -Online Retail)
An Introduction to Date Syrup Market
The Date Syrup market in 2024 is expanding rapidly, driven by the increasing demand for natural and versatile liquid sweeteners. Date syrup, made from concentrated date juice, is valued for its rich flavor, natural sweetness, and nutritional benefits. The market is supported by the growing trend towards clean-label and functional sweeteners. Advances in date syrup production and preservation technologies are enhancing the quality, flavor, and shelf life of date syrup. The market is also benefiting from the trend towards sustainable and minimally processed products, appealing to health-conscious consumers seeking nutritious and natural sweeteners for culinary and beverage applications.
Date Syrup Competitive Landscape
The market report analyses the leading companies in the industry including Al Foah, Ambrosia Delicatessen, ARAT COMPANY PJS, Ario Co, BIONA, BOMBUS, Date Lady, D'VASH Organics, Emirates Dates, EZEEBEE OVERSEAS PVT LTD, Just Dates Syrup, Lion Dates Impex Pvt. Ltd, Malabar Food Products, Minoo Industrial Group, Parsunday Symbol Co., Rapunzel Naturkost, Ratinkhosh Co, Sun Seas Business Group, and Others.
Date Syrup Market Dynamics
Date Syrup Market Trend: Shift Towards Natural and Healthier Sweeteners
A prominent trend in the date syrup market is the shift towards natural and healthier sweeteners. With increasing consumer awareness about the negative health impacts of refined sugars and artificial sweeteners, there is a growing interest in date syrup as a natural and wholesome alternative. This trend is driven by a desire for cleaner label products, concerns about obesity and diabetes, and a preference for ingredients with nutritional benefits. As a result, date syrup is gaining popularity as a versatile sweetening option in various food and beverage applications.
Date Syrup Market Driver: Rising Health Consciousness and Dietary Preferences
A key driver influencing the date syrup market is the rising health consciousness and dietary preferences among consumers. Factors such as a desire for healthier food choices, concerns about sugar consumption, and the popularity of natural and clean label products are driving the demand for date syrup. This driver is pushing manufacturers to promote the nutritional benefits of date syrup, position it as a natural and nutrient-rich sweetener, and develop innovative products that incorporate date syrup into a wide range of culinary applications.
Date Syrup Market Opportunity: Expansion into Alternative Sweetening Solutions
An exciting opportunity in the date syrup market lies in expansion into alternative sweetening solutions. There is potential to introduce date syrup as an ingredient in a variety of food and beverage products, including sauces, dressings, marinades, desserts, baked goods, and beverages. Additionally, there is an opportunity to develop customized blends and formulations that combine date syrup with other natural sweeteners or functional ingredients to create unique flavor profiles and enhance nutritional value. This expansion into alternative sweetening solutions allows companies to tap into new market segments, cater to diverse consumer preferences, and capitalize on the growing demand for natural and healthier sweeteners in the food industry.
Date Syrup Market Share Analysis: Conventional segment generated the highest revenue share in the industry
The Conventional segment is the largest in the Date Syrup Market by type. Conventional date syrup is widely preferred due to its affordability and extensive availability. The production process for conventional date syrup is well-established and scalable, making it accessible to a broad range of consumers and industries. Its versatile application in various food and beverage products, coupled with its rich nutritional profile and natural sweetness, has cemented its position as the dominant segment. Despite the growing interest in organic products, conventional date syrup remains the primary choice for many manufacturers and consumers due to its cost-effectiveness and ease of access.
Date Syrup Market Share Analysis: Food & Beverage is the fastest growing segment over the forecast period to 2032
The Food & Beverage segment is expected to be the fastest-growing in the Date Syrup Market by 2032. This growth is primarily driven by the increasing consumer demand for natural sweeteners and the shift towards healthier eating habits. Date syrup is gaining popularity as an alternative to refined sugars and artificial sweeteners due to its rich nutrient content and lower glycemic index. Within the food and beverage sector, date syrup is being increasingly used in various sub-segments such as bakery and confectionery, dairy and desserts, snacks and cereals, and beverages. Its application enhances the flavor and nutritional value of these products, making them more appealing to health-conscious consumers. Additionally, the rise of clean label and natural ingredient trends further supports the adoption of date syrup in the food and beverage industry, driving significant growth in this segment.
Date Syrup Market Share Analysis: Business to Business (B2B) segment generated the highest revenue share in the industry
The Business to Business (B2B) segment is the largest in the Date Syrup Market by distribution channel. This segment encompasses sales to food manufacturers, processors, and other industrial users who incorporate date syrup into their products. The B2B channel's dominance is due to the high volume of date syrup required by these businesses to meet production needs. Bulk purchasing and long-term supply agreements with date syrup producers ensure a steady supply for continuous production, making the B2B segment a crucial part of the market. Additionally, the growing use of date syrup in various food applications such as bakery, confectionery, dairy products, and beverages further drives the demand in this segment. The efficiency and scale of B2B transactions support the segment's leading position in the market.
Date Syrup Market Share Analysis: Retail/Household is the fastest growing segment over the forecast period to 2032
The Retail/Household segment is anticipated to be the fastest-growing in the Date Syrup Market by 2032. This growth is driven by increasing consumer awareness and demand for natural sweeteners for home cooking and baking. The convenience of purchasing date syrup for everyday use, combined with its health benefits, is attracting a growing number of households. Retailers are expanding their product lines to include a variety of date syrup brands and packaging sizes, catering to different consumer needs and preferences. The rise of online retail platforms also makes it easier for consumers to access date syrup, further fueling the segment's growth. As more people seek healthier alternatives to sugar and artificial sweeteners, the retail/household segment is expected to see substantial expansion.
Date Syrup Market Segmentation
By Type
Organic
Conventional
By End-User
Food & Beverage
-Bakery & Confectionery
-Dairy & Desserts
-Snacks & Cereals
-Beverages
-Others
Nutraceuticals
Cosmetics and Personal Care
Foodservice
Retail/ Household
Others
By Distribution Channel
Business to Business
Business to Consumers
-Hypermarkets/ Supermarkets
-Specialty Stores
-Convenience Stores
-Online Retail
Countries Analyzed
North America (US, Canada, Mexico)
Europe (Germany, UK, France, Spain, Italy, Russia, Rest of Europe)
Asia Pacific (China, India, Japan, South Korea, Australia, South East Asia, Rest of Asia)
South America (Brazil, Argentina, Rest of South America)
Middle East and Africa (Saudi Arabia, UAE, Rest of Middle East, South Africa, Egypt, Rest of Africa)
Date Syrup Companies Profiled in the Study
Al Foah
Ambrosia Delicatessen
ARAT COMPANY PJS
Ario Co
BIONA
BOMBUS
Date Lady
D'VASH Organics
Emirates Dates
EZEEBEE OVERSEAS PVT LTD
Just Dates Syrup
Lion Dates Impex Pvt. Ltd
Malabar Food Products
Minoo Industrial Group
Parsunday Symbol Co.
Rapunzel Naturkost
Ratinkhosh Co
Sun Seas Business Group
*- List Not Exhaustive
Chapter 1. TABLE OF CONTENTS
Chapter 2. Introduction to Date Syrup Market
2.1. Market Overview
2.2. Key Statistics and Report Highlights
2.3. Scope of the Comprehensive Study
2.3.1. Market Definition
2.3.2 Countries and Regions Covered
2.3.3 Research Objective
2.3.4 Units, Currency, and Conversions
2.3.5 Industry Value Chain
2.4. Key Market Segments
2.5. Key Companies
2.6. Study Period
Chapter 3. Strategic Analysis Review
3.1. Date Syrup Pricing Analysis and Forecast
3.2. Porter’s Five Forces
3.3. Market Ecosystem
3.4. SWOT Analysis
3.5. Regulatory Scenario
3.3. Effects of Inflation, Russia-Ukraine War, moderating economic growth, and other macroeconomic factors
Chapter 4. Competitive Landscape
4.1. Market Share Analysis
4.1.1. Global Date Syrup Market Share by Company, 2023
4.1.2. Product Offerings of Leading Date Syrup Companies
4.2. Market Entropy
4.2.1. New Product Launches in the Industry
4.2.2. Mergers, Acquisitions, Joint ventures, and Partnerships
4.3. Key Strategies and Best Practices
Chapter 5. Global Market Projections: Best, Reference, and Low Case Scenarios
5.1. Growth Analysis- Case Scenario Definitions
5.2. Low Growth Case Scenario Forecasts
5.3. Reference Growth Case Scenario Forecasts
5.4. High Growth Case Scenario Forecasts
Chapter 6. Market Dynamics
6.1. Date Syrup Market Drivers
6.2. Date Syrup Market Challenges
6.6. Date Syrup Market Opportunities
6.4. Date Syrup Market Trends
Chapter 7. Global Date Syrup Market Outlook Trends
7.1. Global Date Syrup Revenue (USD Million) and CAGR (%) by Type (2021-2032)
7.2. Global Date Syrup Revenue (USD Million) and CAGR (%) by Application (2021-2032)
7.3. Global Date Syrup Revenue (USD Million) and CAGR (%) by Product (2021-2032)
By Type
Organic
Conventional
By End-User
Food & Beverage
-Bakery & Confectionery
-Dairy & Desserts
-Snacks & Cereals
-Beverages
-Others
Nutraceuticals
Cosmetics and Personal Care
Foodservice
Retail/ Household
Others
By Distribution Channel
Business to Business
Business to Consumers
-Hypermarkets/ Supermarkets
-Specialty Stores
-Convenience Stores
-Online Retail
Chapter 8. Global Date Syrup Regional Analysis and Outlook
8.1. Global Date Syrup Revenue (USD Million) By Regions (2021- 2032)
8.2. North America Date Syrup Revenue (USD Million) by Country (2021-2032)
8.2.1. United States Date Syrup Regional Analysis and Outlook
8.2.2. Canada Date Syrup Regional Analysis and Outlook
8.2.3. Mexico Date Syrup Regional Analysis and Outlook
8.3. Europe Date Syrup Revenue (USD Million), by Country (2021-2032)
8.3.1. Germany Date Syrup Regional Analysis and Outlook
8.3.2. France Date Syrup Regional Analysis and Outlook
8.3.3. United Kingdom Date Syrup Regional Analysis and Outlook
8.3.4. Spain Date Syrup Regional Analysis and Outlook
8.3.5. Italy Date Syrup Regional Analysis and Outlook
8.3.6. Russia Date Syrup Regional Analysis and Outlook
8.3.7. Rest of Europe Date Syrup Regional Analysis and Outlook
8.4. Asia Pacific Date Syrup Revenue (USD Million) by Country (2021-2032)
8.4.1. China Date Syrup Regional Analysis and Outlook
8.4.2. Japan Date Syrup Regional Analysis and Outlook
8.4.3. India Date Syrup Regional Analysis and Outlook
8.4.4. South Korea Date Syrup Regional Analysis and Outlook
8.4.5. Australia Date Syrup Regional Analysis and Outlook
8.4.6. South East Asia Date Syrup Regional Analysis and Outlook
8.4.7. Rest of Asia Pacific Date Syrup Regional Analysis and Outlook
8.5. South America Date Syrup Revenue (USD Million), by Country (2021-2032)
8.5.1. Brazil Date Syrup Regional Analysis and Outlook
8.5.2. Argentina Date Syrup Regional Analysis and Outlook
8.5.3. Rest of South America Date Syrup Regional Analysis and Outlook
8.6. Middle East and Africa Date Syrup Revenue (USD Million) by Country (2021-2032)
8.6.1. Middle East Date Syrup Regional Analysis and Outlook
8.6.2. Africa Date Syrup Regional Analysis and Outlook
Chapter 9. North America Date Syrup Analysis and Outlook
9.1. North America Date Syrup Revenue (USD Million) by Segments (2021-2032)
9.1.1. North America Date Syrup Revenue (USD Million) by Type (2021-2032)
9.1.2. North America Date Syrup Revenue (USD Million) by Application (2021-2032)
9.1.3. North America Date Syrup Revenue (USD Million) by Product (2021-2032)
By Type
Organic
Conventional
By End-User
Food & Beverage
-Bakery & Confectionery
-Dairy & Desserts
-Snacks & Cereals
-Beverages
-Others
Nutraceuticals
Cosmetics and Personal Care
Foodservice
Retail/ Household
Others
By Distribution Channel
Business to Business
Business to Consumers
-Hypermarkets/ Supermarkets
-Specialty Stores
-Convenience Stores
-Online Retail
Chapter 10. Europe Date Syrup Analysis and Outlook
10.1. Europe Date Syrup Revenue (USD Million), by Segments (USD Million) (2021-2032)
10.1.1. Europe Date Syrup Revenue (USD Million) by Type (2021-2032)
10.1.2. Europe Date Syrup Revenue (USD Million) by Application (2021-2032)
10.1.3. Europe Date Syrup Revenue (USD Million) by Product (2021-2032)
By Type
Organic
Conventional
By End-User
Food & Beverage
-Bakery & Confectionery
-Dairy & Desserts
-Snacks & Cereals
-Beverages
-Others
Nutraceuticals
Cosmetics and Personal Care
Foodservice
Retail/ Household
Others
By Distribution Channel
Business to Business
Business to Consumers
-Hypermarkets/ Supermarkets
-Specialty Stores
-Convenience Stores
-Online Retail
Chapter 11. Asia Pacific Date Syrup Analysis and Outlook
11.1. Asia Pacific Date Syrup Revenue (USD Million), and Revenue (USD Million) by Segments (2021-2032)
11.1.1. Asia Pacific Date Syrup Revenue (USD Million) by Type (2021-2032)
11.1.2. Asia Pacific Date Syrup Revenue (USD Million) by Application (2021-2032)
11.1.3. Asia Pacific Date Syrup Revenue (USD Million) by Product (2021-2032)
By Type
Organic
Conventional
By End-User
Food & Beverage
-Bakery & Confectionery
-Dairy & Desserts
-Snacks & Cereals
-Beverages
-Others
Nutraceuticals
Cosmetics and Personal Care
Foodservice
Retail/ Household
Others
By Distribution Channel
Business to Business
Business to Consumers
-Hypermarkets/ Supermarkets
-Specialty Stores
-Convenience Stores
-Online Retail
Chapter 12. South America Date Syrup Analysis and Outlook
12.1. South America Date Syrup Revenue (USD Million), by Segments (2021-2032)
12.1.1. South America Date Syrup Revenue (USD Million) by Type (2021-2032)
12.1.2. South America Date Syrup Revenue (USD Million) by Application (2021-2032)
12.1.3. South America Date Syrup Revenue (USD Million) by Product (2021-2032)
By Type
Organic
Conventional
By End-User
Food & Beverage
-Bakery & Confectionery
-Dairy & Desserts
-Snacks & Cereals
-Beverages
-Others
Nutraceuticals
Cosmetics and Personal Care
Foodservice
Retail/ Household
Others
By Distribution Channel
Business to Business
Business to Consumers
-Hypermarkets/ Supermarkets
-Specialty Stores
-Convenience Stores
-Online Retail
Chapter 13. Middle East and Africa Date Syrup Analysis and Outlook
13.1. Middle East and Africa Date Syrup Revenue (USD Million), by Segments (2021-2032)
13.1.1. Middle East and Africa Date Syrup Revenue (USD Million) by Type (2021-2032)
13.1.2. Middle East and Africa Date Syrup Revenue (USD Million) by Application (2021-2032)
13.1.3. Middle East and Africa Date Syrup Revenue (USD Million) by Product (2021-2032)
By Type
Organic
Conventional
By End-User
Food & Beverage
-Bakery & Confectionery
-Dairy & Desserts
-Snacks & Cereals
-Beverages
-Others
Nutraceuticals
Cosmetics and Personal Care
Foodservice
Retail/ Household
Others
By Distribution Channel
Business to Business
Business to Consumers
-Hypermarkets/ Supermarkets
-Specialty Stores
-Convenience Stores
-Online Retail
Chapter 14. Date Syrup Company Profiles
14.1 Business Overview
14.2 Product Profiles
14.3 SWOT Profiles
14.5 Recent Developments
14.6 Financial Profile
List of Companies
Al Foah
Ambrosia Delicatessen
ARAT COMPANY PJS
Ario Co
BIONA
BOMBUS
Date Lady
D'VASH Organics
Emirates Dates
EZEEBEE OVERSEAS PVT LTD
Just Dates Syrup
Lion Dates Impex Pvt. Ltd
Malabar Food Products
Minoo Industrial Group
Parsunday Symbol Co.
Rapunzel Naturkost
Ratinkhosh Co
Sun Seas Business Group
15. Methodology and Data Sources
15.1 Customization Offerings
15.2 Subscription Services
15.3 Related Reports
15.4 Publisher Expertise
LIST OF TABLES
Table 1 Market Segmentation Analysis
Table 2 Global Date Syrup Market Share of Leading Companies, 2023
Table 3 Product Offerings of Leading Companies
Table 4 Low Growth Scenario Forecasts
Table 5 Reference Case Growth Scenario
Table 6 High Growth Case Scenario
Table 7 Global Date Syrup Revenue (USD Million) And CAGR (%) By Type (2021-2032)
Table 8 Global Date Syrup Revenue (USD Million) And CAGR (%) By Application (2021-2032)
Table 9 Global Date Syrup Revenue (USD Million) And CAGR (%) By Product (2021-2032)
Table 10 Global Date Syrup Market Revenue (USD Million) By Regions (2021-2032)
Table 11 Global Date Syrup Market Share (%) By Regions (2021-2032)
Table 12 North America Date Syrup Revenue (USD Million) By Country (2021-2032)
Table 13 Europe Date Syrup Revenue (USD Million) By Country (2021-2032)
Table 14 Asia Pacific Date Syrup Revenue (USD Million) By Country (2021-2032)
Table 15 South America Date Syrup Revenue (USD Million) By Country (2021-2032)
Table 16 Middle East and Africa Date Syrup Revenue (USD Million) By Region (2021-2032)
Table 17 North America Date Syrup Revenue (USD Million) By Type (2021-2032)
Table 18 North America Date Syrup Revenue (USD Million) By Application (2021-2032)
Table 19 North America Date Syrup Revenue (USD Million) By Product (2021-2032)
Table 20 Europe Date Syrup Revenue (USD Million) By Type (2021-2032)
Table 21 Europe Date Syrup Revenue (USD Million) By Application (2021-2032)
Table 22 Europe Date Syrup Revenue (USD Million) By Product (2021-2032)
Table 23 Asia Pacific Date Syrup Revenue (USD Million) By Type (2021-2032)
Table 24 Asia Pacific Date Syrup Revenue (USD Million) By Application (2021-2032)
Table 25 Asia Pacific Date Syrup Revenue (USD Million) By Product (2021-2032)
Table 26 South America Date Syrup Revenue (USD Million) By Type (2021-2032)
Table 27 South America Date Syrup Revenue (USD Million) By Application (2021-2032)
Table 28 South America Date Syrup Revenue (USD Million) By Product (2021-2032)
Table 29 Middle East and Africa Date Syrup Revenue (USD Million) By Type (2021-2032)
Table 30 Middle East and Africa Date Syrup Revenue (USD Million) By Application (2021-2032)
Table 31 Middle East and Africa Date Syrup Revenue (USD Million) By Product (2021-2032)
LIST OF FIGURES
Figure 1. Market Scope
Figure 2. Pricing Forecasts Per Unit, 2023- 2032
Figure 3. Porter’s Five Forces
Figure 4. Global Date Syrup Market Revenue (USD Million) By Regions (2021-2032)
Figure 5. Global Date Syrup Market Share (%) By Regions (2023)
Figure 6. North America Date Syrup Revenue (USD Million) By Country (2021-2032)
Figure 7. United States Date Syrup Revenue (USD Million) By Country (2021-2032)
Figure 8. Canada Date Syrup Revenue (USD Million) By Country (2021-2032)
Figure 9. Mexico Date Syrup Revenue (USD Million) By Country (2021-2032)
Figure 10. Europe Date Syrup Revenue (USD Million) By Country (2021-2032)
Figure 11. Germany Date Syrup Revenue (USD Million) By Country (2021-2032)
Figure 12. France Date Syrup Revenue (USD Million) By Country (2021-2032)
Figure 13. United Kingdom Date Syrup Revenue (USD Million) By Country (2021-2032)
Figure 14. Spain Date Syrup Revenue (USD Million) By Country (2021-2032)
Figure 15. Italy Date Syrup Revenue (USD Million) By Country (2021-2032)
Figure 16. Russia Date Syrup Revenue (USD Million) By Country (2021-2032)
Figure 17. Rest of Europe Date Syrup Revenue (USD Million) By Country (2021-2032)
Figure 11. Asia Pacific Date Syrup Revenue (USD Million) By Country (2021-2032)
Figure 12. China Date Syrup Revenue (USD Million) By Country (2021-2032)
Figure 13. Japan Date Syrup Revenue (USD Million) By Country (2021-2032)
Figure 14. India Date Syrup Revenue (USD Million) By Country (2021-2032)
Figure 15. South Korea Date Syrup Revenue (USD Million) By Country (2021-2032)
Figure 16. Australia Date Syrup Revenue (USD Million) By Country (2021-2032)
Figure 17. South East Asia Date Syrup Revenue (USD Million) By Country (2021-2032)
Figure 18. South America Date Syrup Revenue (USD Million) By Country (2021-2032)
Figure 19. Brazil Date Syrup Revenue (USD Million) By Country (2021-2032)
Figure 20. Argentina Date Syrup Revenue (USD Million) By Country (2021-2032)
Figure 21. Rest of Asia Pacific Date Syrup Revenue (USD Million) By Country (2021-2032)
Figure 22. Middle East and Africa Date Syrup Revenue (USD Million) By Region (2021-2032)
Figure 23. Saudi Arabia Date Syrup Revenue (USD Million) By Region (2021-2032)
Figure 24. The UAE Date Syrup Revenue (USD Million) By Region (2021-2032)
Figure 25. Rest of Middle East Date Syrup Revenue (USD Million) By Region (2021-2032)
Figure 26. South Africa Date Syrup Revenue (USD Million) By Region (2021-2032)
Figure 27. Africa Date Syrup Revenue (USD Million) By Region (2021-2032)
Figure 28. North America Date Syrup Revenue (USD Million) By Type (2021-2032)
Figure 29. North America Date Syrup Revenue (USD Million) By Application (2021-2032)
Figure 30. North America Date Syrup Revenue (USD Million) By Product (2021-2032)
Figure 31. Europe Date Syrup Revenue (USD Million) By Type (2021-2032)
Figure 32. Europe Date Syrup Revenue (USD Million) By Application (2021-2032)
Figure 33. Europe Date Syrup Revenue (USD Million) By Product (2021-2032)
Figure 34. Asia Pacific Date Syrup Revenue (USD Million) By Type (2021-2032)
Figure 35. Asia Pacific Date Syrup Revenue (USD Million) By Application (2021-2032)
Figure 36. Asia Pacific Date Syrup Revenue (USD Million) By Product (2021-2032)
Figure 37. South America Date Syrup Revenue (USD Million) By Type (2021-2032)
Figure 38. South America Date Syrup Revenue (USD Million) By Application (2021-2032)
Figure 39. South America Date Syrup Revenue (USD Million) By Product (2021-2032)
Figure 40. Middle East and Africa Date Syrup Revenue (USD Million) By Type (2021-2032)
Figure 41. Middle East and Africa Date Syrup Revenue (USD Million) By Application (2021-2032)
Figure 42. Middle East and Africa Date Syrup Revenue (USD Million) By Product (2021-2032)
By Type
Organic
Conventional
By End-User
Food & Beverage
-Bakery & Confectionery
-Dairy & Desserts
-Snacks & Cereals
-Beverages
-Others
Nutraceuticals
Cosmetics and Personal Care
Foodservice
Retail/ Household
Others
By Distribution Channel
Business to Business
Business to Consumers
-Hypermarkets/ Supermarkets
-Specialty Stores
-Convenience Stores
-Online Retail
Countries Analyzed
North America (US, Canada, Mexico)
Europe (Germany, UK, France, Spain, Italy, Russia, Rest of Europe)
Asia Pacific (China, India, Japan, South Korea, Australia, South East Asia, Rest of Asia)
South America (Brazil, Argentina, Rest of South America)
Middle East and Africa (Saudi Arabia, UAE, Rest of Middle East, South Africa, Egypt, Rest of Africa)
