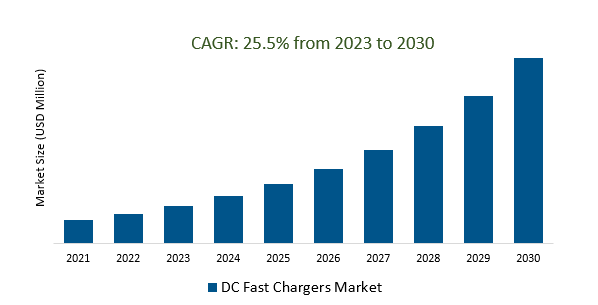
The DC Fast Chargers Market Size is estimated to register 25.5% growth over the forecast period from 2023 to 2030.
DC Fast Chargers Market Overview
The demand for electric cars is rising the need for efficient and high-powered charging solutions, propelling the demand for DC fast chargers. The supportive initiatives and investments from governments and regulatory bodies to bolster the EV charging infrastructure are driving the market. Countries Across the world are implementing policies, incentives, and subsidies to encourage the deployment of fast-charging networks, aiming to accelerate the transition towards clean and sustainable transportation. Additionally, efforts are ongoing to further reduce charging times, making them more comparable to refueling a conventional vehicle and addressing one of the primary concerns of electric vehicle (EV) drivers - charging time. Further, Companies are exploring options for utilizing solar or wind power to supply electricity to charging stations, reducing their environmental impact and promoting greener charging solutions.
DC Fast Chargers Market Dynamics
Market Trends- Renewable energy integration marks a strategic shift in the DC fast chargers’ market towards sustainability.
Companies within the DC fast chargers’ market is increasingly exploring the incorporation of renewable energy, such as solar or wind power, into charging stations.
Leveraging renewable energy sources, allowing charging station operators to potentially lower operational costs over time, especially in regions with favourable renewable energy incentives or reduced tariffs are propelling the market.
Companies investing in renewable energy solutions for charging infrastructure are gaining a competitive edge by offering eco-friendly and sustainable charging options, appealing to both environmentally conscious consumers and businesses.
Market Driver- The rapid adoption of electric vehicles drives the demand for DC fast chargers in the market.
The demand for electric vehicles escalating globally proportionally increases the necessity for efficient and high-powered charging infrastructure.
Additionally, these chargers are addressing EV drivers' range anxiety by significantly reducing charging times compared to standard chargers, thus facilitating longer journeys and enhancing the overall appeal and practicality of electric vehicles.
Further, the growing commitment of governments, industries, and consumers towards a greener transportation ecosystem are fueling the market demand for DC fast chargers.
Market Opportunity- Pursuit of Increased Charging Speeds advances efficiency in DC Fast Chargers Market
Continuous innovation in charging technology, improvements in power electronics, and advancements in battery management systems are contributing to the evolution of market.
Companies are aiming to differentiate themselves by offering faster charging solutions, seeking to gain market share and appeal to consumers looking for rapid and convenient charging options.
Further, quicker charging, addressing concerns regarding EV range and facilitating long-distance travel are increasing the demand.
Market Share Analysis- Combined Charging System (CCS) will register the fastest growth
The DC Fast Chargers Market is analyzed across CHAdeMO, Combined Charging System (CCS) and Tesla Supercharge. Combined Charging System (CCS) is poised to register the fastest growth. Designed as a unified charging standard, CCS integrates both AC and DC charging, accommodating various power levels to suit different EV models. This flexibility has positioned CCS as a preferred choice among manufacturers, charging network operators, and EV owners, contributing to its rapid adoption globally. The CCS standard encompasses multiple plug types, including the Type 1 (J1772) and Type 2 (Mennekes) connectors, alongside an additional two DC pins for high-powered DC charging. This integration of AC and DC capabilities allows CCS chargers to accommodate a broader array of EVs, making them adaptable and future-proof for upcoming electric vehicle models. Moreover, CCS is often seen as an evolving standard, continuously evolving to support higher charging capacities and enhanced functionalities.
Market Share Analysis- 101 to 200 KW held a significant market share in 2023
The DC Fast Chargers Market is analyzed across various Power outputs including SMEs, Large Enterprises, and others. Of these, 101 to 200 KW held a significant market share in 2023. Chargers falling within this power output range are recognized for their ability to deliver moderately fast charging rates, significantly reducing charging times compared to lower-powered chargers, while also providing a reasonable degree of compatibility with various EV models. These chargers, operating between 101 to 200 kW, cater to a wide spectrum of electric vehicles, supporting relatively faster charging capabilities without being excessively high-powered. This power output range aligns with the requirements of many mainstream electric vehicles, addressing the need for convenient and efficient charging solutions for everyday use and longer trips. Further, their moderate power output makes them suitable for installations in locations where a balance between speed and charging infrastructure cost-effectiveness is crucial.
DC Fast Chargers Market News
ARAI Unveils 100kW DC Fast Charger, Uplifting Electric Vehicle Charging Infrastructure.
Lincoln Electric Introduces Velion DC Fast Charger, Expanding Electric Vehicle Charging Solutions.
DC Fast Chargers Market Segmentation
By Type
- CHAdeMO
- Combined Charging System (CCS)
- Tesla Supercharger
By Application
- Commercial Use
- Home Use
- Office Use
By Power Output
- Less than 100 KW
- 101 to 200 KW
- Above 201 KW
By Region
- North America (United States, Canada, Mexico)
- Europe (Germany, France, United Kingdom, Spain, Italy, Others)
- Asia Pacific (China, India, Japan, South Korea, Australia, Others)
- Latin America (Brazil, Argentina, Others)
- Middle East and Africa (Saudi Arabia, UAE, Kuwait, Other Middle East, South Africa, Nigeria, Other Africa)
DC Fast Chargers Market Companies
- NEC Corporation (Japan)
- ABB (Switzerland)
- Tritium Pty Ltd (Australia)
- Circontrol (Spain)
- DBT (India)
- Signet EV (South Korea)
- Schneider Electric (France)
- Siemens AG (Germany)
- Efacec Electric Mobility (Portugal)
*List not exhaustive
DC Fast Chargers Market Outlook 2023
1 Market Overview
1.1 Introduction to the DC Fast Chargers Market
1.2 Scope of the Study
1.3 Research Objective
1.3.1 Key Market Scope and Segments
1.3.2 Players Covered
1.3.3 Years Considered
2 Executive Summary
2.1 2023 DC Fast Chargers Industry- Market Statistics
3 Market Dynamics
3.1 Market Drivers
3.2 Market Challenges
3.3 Market Opportunities
3.4 Market Trends
4 Market Factor Analysis
4.1 Porter’s Five Forces
4.2 Market Entropy
4.2.1 Global DC Fast Chargers Market Companies with Area Served
4.2.2 Products Offerings Global DC Fast Chargers Market
5 COVID-19 Impact Analysis and Outlook Scenarios
5.1.1 Covid-19 Impact Analysis
5.1.2 Post-COVID-19 Scenario- Low Growth Case
5.1.3 Post-COVID-19 Scenario- Reference Growth Case
5.1.4 Post-COVID-19 Scenario- Low Growth Case
6 Global DC Fast Chargers Market Trends
6.1 Global DC Fast Chargers Revenue (USD Million) and CAGR (%) by Type (2018-2030)
6.2 Global DC Fast Chargers Revenue (USD Million) and CAGR (%) by Applications (2018-2030)
6.3 Global DC Fast Chargers Revenue (USD Million) and CAGR (%) by Regions (2018-2030)
7 Global DC Fast Chargers Market Revenue (USD Million) by Type, and Applications (2018-2022)
7.1 Global DC Fast Chargers Revenue (USD Million) by Type (2018-2022)
7.1.1 Global DC Fast Chargers Revenue (USD Million), Market Share (%) by Type (2018-2022)
7.2 Global DC Fast Chargers Revenue (USD Million) by Applications (2018-2022)
7.2.1 Global DC Fast Chargers Revenue (USD Million), Market Share (%) by Applications (2018-2022)
8 Global DC Fast Chargers Development Regional Status and Outlook
8.1 Global DC Fast Chargers Revenue (USD Million) By Regions (2018-2022)
8.2 North America DC Fast Chargers Revenue (USD Million) by Type, and Application (2018-2022)
8.2.1 North America DC Fast Chargers Revenue (USD Million) by Country (2018-2022)
8.2.2 North America DC Fast Chargers Revenue (USD Million) by Type (2018-2022)
8.2.3 North America DC Fast Chargers Revenue (USD Million) by Applications (2018-2022)
8.3 Europe DC Fast Chargers Revenue (USD Million), by Type, and Applications (USD Million) (2018-2022)
8.3.1 Europe DC Fast Chargers Revenue (USD Million), by Country (2018-2022)
8.3.2 Europe DC Fast Chargers Revenue (USD Million) by Type (2018-2022)
8.3.3 Europe DC Fast Chargers Revenue (USD Million) by Applications (2018-2022)
8.4 Asia Pacific DC Fast Chargers Revenue (USD Million), and Revenue (USD Million) by Type, and Applications (2018-2022)
8.4.1 Asia Pacific DC Fast Chargers Revenue (USD Million) by Country (2018-2022)
8.4.2 Asia Pacific DC Fast Chargers Revenue (USD Million) by Type (2018-2022)
8.4.3 Asia Pacific DC Fast Chargers Revenue (USD Million) by Applications (2018-2022)
8.5 South America DC Fast Chargers Revenue (USD Million), by Type, and Applications (2018-2022)
8.5.1 South America DC Fast Chargers Revenue (USD Million), by Country (2018-2022)
8.5.2 South America DC Fast Chargers Revenue (USD Million) by Type (2018-2022)
8.5.3 South America DC Fast Chargers Revenue (USD Million) by Applications (2018-2022)
8.6 Middle East and Africa DC Fast Chargers Revenue (USD Million), by Type, Technology, Application, Thickness (2018-2022)
8.6.1 Middle East and Africa DC Fast Chargers Revenue (USD Million) by Country (2018-2022)
8.6.2 Middle East and Africa DC Fast Chargers Revenue (USD Million) by Type (2018-2022)
8.6.3 Middle East and Africa DC Fast Chargers Revenue (USD Million) by Applications (2018-2022)
9 Company Profiles
10 Global DC Fast Chargers Market Revenue (USD Million), by Type, and Applications (2023-2030)
10.1 Global DC Fast Chargers Revenue (USD Million) and Market Share (%) by Type (2023-2030)
10.1.1 Global DC Fast Chargers Revenue (USD Million), and Market Share (%) by Type (2023-2030)
10.2 Global DC Fast Chargers Revenue (USD Million) and Market Share (%) by Applications (2023-2030)
10.2.1 Global DC Fast Chargers Revenue (USD Million), and Market Share (%) by Applications (2023-2030)
11 Global DC Fast Chargers Development Regional Status and Outlook Forecast
11.1 Global DC Fast Chargers Revenue (USD Million) By Regions (2023-2030)
11.2 North America DC Fast Chargers Revenue (USD Million) by Type, and Applications (2023-2030)
11.2.1 North America DC Fast Chargers Revenue (USD) Million by Country (2023-2030)
11.2.2 North America DC Fast Chargers Revenue (USD Million), by Type (2023-2030)
11.2.3 North America DC Fast Chargers Revenue (USD Million), Market Share (%) by Applications (2023-2030)
11.3 Europe DC Fast Chargers Revenue (USD Million), by Type, and Applications (2023-2030)
11.3.1 Europe DC Fast Chargers Revenue (USD Million), by Country (2023-2030)
11.3.2 Europe DC Fast Chargers Revenue (USD Million), by Type (2023-2030)
11.3.3 Europe DC Fast Chargers Revenue (USD Million), by Applications (2023-2030)
11.4 Asia Pacific DC Fast Chargers Revenue (USD Million) by Type, and Applications (2023-2030)
11.4.1 Asia Pacific DC Fast Chargers Revenue (USD Million), by Country (2023-2030)
11.4.2 Asia Pacific DC Fast Chargers Revenue (USD Million), by Type (2023-2030)
11.4.3 Asia Pacific DC Fast Chargers Revenue (USD Million), by Applications (2023-2030)
11.5 South America DC Fast Chargers Revenue (USD Million), by Type, and Applications (2023-2030)
11.5.1 South America DC Fast Chargers Revenue (USD Million), by Country (2023-2030)
11.5.2 South America DC Fast Chargers Revenue (USD Million), by Type (2023-2030)
11.5.3 South America DC Fast Chargers Revenue (USD Million), by Applications (2023-2030)
11.6 Middle East and Africa DC Fast Chargers Revenue (USD Million), by Type, and Applications (2023-2030)
11.6.1 Middle East and Africa DC Fast Chargers Revenue (USD Million), by Region (2023-2030)
11.6.2 Middle East and Africa DC Fast Chargers Revenue (USD Million), by Type (2023-2030)
11.6.3 Middle East and Africa DC Fast Chargers Revenue (USD Million), by Applications (2023-2030)
12 Methodology and Data Sources
12.1 Methodology/Research Approach
12.1.1 Research Programs/Design
12.1.2 Market Size Estimation
12.1.3 Market Breakdown and Data Triangulation
12.2 Data Sources
12.2.1 Secondary Sources
12.2.2 Primary Sources
12.3 Disclaimer
List of Tables
Table 1 Market Segmentation Analysis
Table 2 Global DC Fast Chargers Market Companies with Areas Served
Table 3 Products Offerings Global DC Fast Chargers Market
Table 4 Low Growth Scenario Forecasts
Table 5 Reference Case Growth Scenario
Table 6 High Growth Case Scenario
Table 7 Global DC Fast Chargers Revenue (USD Million) And CAGR (%) By Type (2018-2030)
Table 8 Global DC Fast Chargers Revenue (USD Million) And CAGR (%) By Applications (2018-2030)
Table 9 Global DC Fast Chargers Revenue (USD Million) And CAGR (%) By Regions (2018-2030)
Table 10 Global DC Fast Chargers Revenue (USD Million) By Type (2018-2022)
Table 11 Global DC Fast Chargers Revenue Market Share (%) By Type (2018-2022)
Table 12 Global DC Fast Chargers Revenue (USD Million) By Applications (2018-2022)
Table 13 Global DC Fast Chargers Revenue Market Share (%) By Applications (2018-2022)
Table 14 Global DC Fast Chargers Market Revenue (USD Million) By Regions (2018-2022)
Table 15 Global DC Fast Chargers Market Share (%) By Regions (2018-2022)
Table 16 North America DC Fast Chargers Revenue (USD Million) By Country (2018-2022)
Table 17 North America DC Fast Chargers Revenue (USD Million) By Type (2018-2022)
Table 18 North America DC Fast Chargers Revenue (USD Million) By Applications (2018-2022)
Table 19 Europe DC Fast Chargers Revenue (USD Million) By Country (2018-2022)
Table 20 Europe DC Fast Chargers Revenue (USD Million) By Type (2018-2022)
Table 21 Europe DC Fast Chargers Revenue (USD Million) By Applications (2018-2022)
Table 22 Asia Pacific DC Fast Chargers Revenue (USD Million) By Country (2018-2022)
Table 23 Asia Pacific DC Fast Chargers Revenue (USD Million) By Type (2018-2022)
Table 24 Asia Pacific DC Fast Chargers Revenue (USD Million) By Applications (2018-2022)
Table 25 South America DC Fast Chargers Revenue (USD Million) By Country (2018-2022)
Table 26 South America DC Fast Chargers Revenue (USD Million) By Type (2018-2022)
Table 27 South America DC Fast Chargers Revenue (USD Million) By Applications (2018-2022)
Table 28 Middle East and Africa DC Fast Chargers Revenue (USD Million) By Region (2018-2022)
Table 29 Middle East and Africa DC Fast Chargers Revenue (USD Million) By Type (2018-2022)
Table 30 Middle East and Africa DC Fast Chargers Revenue (USD Million) By Applications (2018-2022)
Table 31 Financial Analysis
Table 32 Global DC Fast Chargers Revenue (USD Million) By Type (2023-2030)
Table 33 Global DC Fast Chargers Revenue Market Share (%) By Type (2023-2030)
Table 34 Global DC Fast Chargers Revenue (USD Million) By Applications (2023-2030)
Table 35 Global DC Fast Chargers Revenue Market Share (%) By Applications (2023-2030)
Table 36 Global DC Fast Chargers Market Revenue (USD Million), And Revenue (USD Million) By Regions (2023-2030)
Table 37 North America DC Fast Chargers Revenue (USD)By Country (2023-2030)
Table 38 North America DC Fast Chargers Revenue (USD Million) By Type (2023-2030)
Table 39 North America DC Fast Chargers Revenue (USD Million) By Applications (2023-2030)
Table 40 Europe DC Fast Chargers Revenue (USD Million) By Country (2023-2030)
Table 41 Europe DC Fast Chargers Revenue (USD Million) By Type (2023-2030)
Table 42 Europe DC Fast Chargers Revenue (USD Million) By Applications (2023-2030)
Table 43 Asia Pacific DC Fast Chargers Revenue (USD Million) By Country (2023-2030)
Table 44 Asia Pacific DC Fast Chargers Revenue (USD Million) By Type (2023-2030)
Table 45 Asia Pacific DC Fast Chargers Revenue (USD Million) By Applications (2023-2030)
Table 46 South America DC Fast Chargers Revenue (USD Million) By Country (2023-2030)
Table 47 South America DC Fast Chargers Revenue (USD Million) By Type (2023-2030)
Table 48 South America DC Fast Chargers Revenue (USD Million) By Applications (2023-2030)
Table 49 Middle East and Africa DC Fast Chargers Revenue (USD Million) By Region (2023-2030)
Table 50 Middle East and Africa DC Fast Chargers Revenue (USD Million) By Region (2023-2030)
Table 51 Middle East and Africa DC Fast Chargers Revenue (USD Million) By Type (2023-2030)
Table 52 Middle East and Africa DC Fast Chargers Revenue (USD Million) By Applications (2023-2030)
Table 53 Research Programs/Design for This Report
Table 54 Key Data Information from Secondary Sources
Table 55 Key Data Information from Primary Sources
List of Figures
Figure 1 Market Scope
Figure 2 Porter’s Five Forces
Figure 3 Global DC Fast Chargers Revenue (USD Million) By Type (2018-2022)
Figure 4 Global DC Fast Chargers Revenue Market Share (%) By Type (2022)
Figure 5 Global DC Fast Chargers Revenue (USD Million) By Applications (2018-2022)
Figure 6 Global DC Fast Chargers Revenue Market Share (%) By Applications (2022)
Figure 7 Global DC Fast Chargers Market Revenue (USD Million) By Regions (2018-2022)
Figure 8 Global DC Fast Chargers Market Share (%) By Regions (2022)
Figure 9 North America DC Fast Chargers Revenue (USD Million) By Country (2018-2022)
Figure 10 North America DC Fast Chargers Revenue (USD Million) By Type (2018-2022)
Figure 11 North America DC Fast Chargers Revenue (USD Million) By Applications (2018-2022)
Figure 12 Europe DC Fast Chargers Revenue (USD Million) By Country (2018-2022)
Figure 13 Europe DC Fast Chargers Revenue (USD Million) By Type (2018-2022)
Figure 14 Europe DC Fast Chargers Revenue (USD Million) By Applications (2018-2022)
Figure 15 Asia Pacific DC Fast Chargers Revenue (USD Million) By Country (2018-2022)
Figure 16 Asia Pacific DC Fast Chargers Revenue (USD Million) By Type (2018-2022)
Figure 17 Asia Pacific DC Fast Chargers Revenue (USD Million) By Applications (2018-2022)
Figure 18 South America DC Fast Chargers Revenue (USD Million) By Country (2018-2022)
Figure 19 South America DC Fast Chargers Revenue (USD Million) By Type (2018-2022)
Figure 20 South America DC Fast Chargers Revenue (USD Million) By Applications (2018-2022)
Figure 21 Middle East and Africa DC Fast Chargers Revenue (USD Million) By Region (2018-2022)
Figure 22 Middle East and Africa DC Fast Chargers Revenue (USD Million) By Type (2018-2022)
Figure 23 Middle East and Africa DC Fast Chargers Revenue (USD Million) By Applications (2018-2022)
Figure 24 Global DC Fast Chargers Revenue (USD Million) By Type (2023-2030)
Figure 25 Global DC Fast Chargers Revenue Market Share (%) By Type (2030)
Figure 26 Global DC Fast Chargers Revenue (USD Million) By Applications (2023-2030)
Figure 27 Global DC Fast Chargers Revenue Market Share (%) By Applications (2030)
Figure 28 Global DC Fast Chargers Market Revenue (USD Million) By Regions (2023-2030)
Figure 29 North America DC Fast Chargers Revenue (USD Million) By Country (2023-2030)
Figure 30 North America DC Fast Chargers Revenue (USD Million) By Type (2023-2030)
Figure 31 North America DC Fast Chargers Revenue (USD Million) By Applications (2023-2030)
Figure 32 Europe DC Fast Chargers Revenue (USD Million) By Country (2023-2030)
Figure 33 Europe DC Fast Chargers Revenue (USD Million) By Type (2023-2030)
Figure 34 Europe DC Fast Chargers Revenue (USD Million) By Applications (2023-2030)
Figure 35 Asia Pacific DC Fast Chargers Revenue (USD Million) By Country (2023-2030)
Figure 36 Asia Pacific DC Fast Chargers Revenue (USD Million) By Type (2023-2030)
Figure 37 Asia Pacific DC Fast Chargers Revenue (USD Million) By Applications (2023-2030)
Figure 38 South America DC Fast Chargers Revenue (USD Million) By Country (2023-2030)
Figure 39 South America DC Fast Chargers Revenue (USD Million) By Type (2023-2030)
Figure 40 South America DC Fast Chargers Revenue (USD Million) By Applications (2023-2030)
Figure 41 Middle East and Africa DC Fast Chargers Revenue (USD Million) By Region (2023-2030)
Figure 42 Middle East and Africa DC Fast Chargers Revenue (USD Million) By Region (2023-2030)
Figure 43 Middle East and Africa DC Fast Chargers Revenue (USD Million) By Type (2023-2030)
Figure 44 Middle East and Africa DC Fast Chargers Revenue (USD Million) By Applications (2023-2030)
Figure 45 Bottom-Up and Top-Down Approaches For This Report
Figure 46 Data Triangulation
