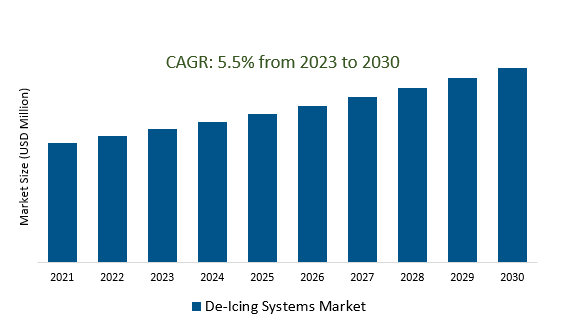
The Global De-Icing Systems Market Size is estimated to register 5.5% growth over the forecast period from 2023 to 2030.
The market growth is driven by an increasing rise of autonomous vehicles, including autonomous drones and self-driving cars, which have created a new demand for advanced de-icing systems. These vehicles require reliable and automated de-icing capabilities to ensure safe and efficient operation in various weather conditions. The integration of de-icing technologies into autonomous vehicle designs is a key driver for innovation in the market. Leading Companies focusing on the Integration of Artificial Intelligence (AI) and Machine Learning (ML), Development of Green doiing technologies, Enhanced Connectivity and Communication Systems, and others to boost market shares in the industry.
Market Overview
The De-Icing Systems Market comprises technologies addressing ice buildup on surfaces, such as aircraft and infrastructure, driven by safety regulations, climate conditions, and technological advancements. Aerospace de-icing involves heated surfaces or fluids in critical areas, while road and infrastructure de-icing commonly uses salt and chemicals. Challenges include environmental concerns and cost implications, prompting a shift towards eco-friendly solutions. Future trends include smart de-icing technologies, green alternatives, and advanced connectivity for real-time data exchange. It's a dynamic market evolving to meet safety standards, environmental expectations, and technological innovations.
Market Dynamics
Market Trends- The de-icing industry is undergoing a transformation driven by advancements in technology, leading to more efficient, environmentally friendly, and effective de-icing solutions.
The de-icing industry is undergoing a transformative shift, propelled by technological advancements. This evolution is leading to more efficient, environmentally friendly, and effective de-icing solutions. Innovations in materials, including advanced heating elements and eco-conscious de-icing agents, enhance precision and sustainability. Automation and smart technologies, such as sensors and artificial intelligence, enable real-time data utilization for proactive de-icing strategies. With climate change influencing weather patterns, there's a growing demand for adaptive and cutting-edge de-icing systems. This industry-wide transition reflects a commitment to safety, regulatory compliance, and environmental responsibility in aviation, transportation, and critical infrastructure sectors.
Market Driver- Increasingly stringent regulations and safety standards are propelling the growth of the de-icing systems market, as industries prioritize safety and environmental responsibility.
Stringent regulations and safety standards are driving notable growth in the de-icing systems market. With a heightened emphasis on safety and environmental responsibility, industries, particularly aviation and transportation, are increasingly investing in advanced de-icing technologies to ensure compliance and enhance safety measures. The market is witnessing a parallel commitment to environmental sustainability, leading to the development and adoption of de-icing solutions that minimize ecological impact. This dual focus on safety and environmental responsibility is reshaping the de-icing systems market, with innovation and compliance as key drivers of industry evolution.
Market Opportunity- The evolving climate demands innovative and adaptable de-icing solutions to address the challenges posed by extreme weather events and shifting weather patterns.
The changing climate necessitates innovative and adaptable de-icing solutions to meet the challenges of extreme weather events and shifting patterns. Industries, particularly aviation, and transportation, are actively seeking advanced technologies capable of responding effectively to evolving environmental conditions. This demand for adaptable solutions is steering research and development efforts within the de-icing systems market, highlighting a proactive approach to addressing climate-related challenges and ensuring the industry's resilience in the face of a dynamic climate landscape.
Market Share Analysis- De-Icing Trucks the De-Icing Systems Market will register the fastest growth
The Global De-Icing Systems Market is analyzed across De-Icing Trucks, Sweepers, and others. Product Development is poised to register the fastest growth. De-icing trucks are integral to the De-Icing Systems Market, serving as essential equipment for efficiently removing ice and snow from surfaces. These specialized vehicles, equipped with de-icing agents, play a crucial role in ensuring safe travel and operational continuity in regions prone to winter weather conditions. Advancements in technology, such as precise application systems, contribute to the overall effectiveness and functionality of the De-Icing Systems Market for trucks.
Market Share Analysis- Commercial held a significant market share in 2023
The Global De-Icing Systems Market is analyzed across various applications including Commercial, Military, and others. Of these, Commercial held a significant market share in 2023. The Commercial De-Icing Systems Market addresses the demand for efficient de-icing solutions in commercial sectors, encompassing aviation, transportation, and critical infrastructure. Focused on ensuring safety and operational continuity in regions prone to winter weather, the market provides technologies for aircraft, road, and infrastructure de-icing. Growth factors include compliance with safety regulations, technological advancements, and a rising preference for environmentally responsible de-icing solutions within commercial applications.
De-Icing Systems Market Segmentation
By Type
- De-Icing Trucks
- Sweepers
- Others
By Application
By Region
- North America (United States, Canada, Mexico)
- Europe (Germany, France, United Kingdom, Spain, Italy, Others)
- Asia Pacific (China, India, Japan, South Korea, Australia, Others)
- Latin America (Brazil, Argentina, Others)
- Middle East and Africa (Saudi Arabia, UAE, Kuwait, Other Middle East, South Africa, Nigeria, Other Africa)
De-Icing Systems Market Companies
- UTC Aerospace Systems
- JBT Corporation
- Kelly Aerospace
- B/E Aerospace Inc
- Clariant AG
- The Dow Chemical Company
- Cryotech.
- Global Ground Support LLC
- Weihai Guangtai Airport Equipment Co Ltd
- Contego
- Kilfrost Corporation
- BASF Corporation
- Vestergaard Company A/S
- Safeaero I Trelleborg AB
*List not exhaustive
De-Icing Systems Market Outlook 2023
1 Market Overview
1.1 Introduction to the De-Icing Systems Market
1.2 Scope of the Study
1.3 Research Objective
1.3.1 Key Market Scope and Segments
1.3.2 Players Covered
1.3.3 Years Considered
2 Executive Summary
2.1 2023 De-Icing Systems Industry- Market Statistics
3 Market Dynamics
3.1 Market Drivers
3.2 Market Challenges
3.3 Market Opportunities
3.4 Market Trends
4 Market Factor Analysis
4.1 Porter’s Five Forces
4.2 Market Entropy
4.2.1 Global De-Icing Systems Market Companies with Area Served
4.2.2 Products Offerings Global De-Icing Systems Market
5 COVID-19 Impact Analysis and Outlook Scenarios
5.1.1 Covid-19 Impact Analysis
5.1.2 post-COVID-19 Scenario- Low Growth Case
5.1.3 post-COVID-19 Scenario- Reference Growth Case
5.1.4 post-COVID-19 Scenario- Low Growth Case
6 Global De-Icing Systems Market Trends
6.1 Global De-Icing Systems Revenue (USD Million) and CAGR (%) by Type (2018-2030)
6.2 Global De-Icing Systems Revenue (USD Million) and CAGR (%) by Applications (2018-2030)
6.3 Global De-Icing Systems Revenue (USD Million) and CAGR (%) by regions (2018-2030)
7 Global De-Icing Systems Market Revenue (USD Million) by Type, and Applications (2018-2022)
7.1 Global De-Icing Systems Revenue (USD Million) by Type (2018-2022)
7.1.1 Global De-Icing Systems Revenue (USD Million), Market Share (%) by Type (2018-2022)
7.2 Global De-Icing Systems Revenue (USD Million) by Applications (2018-2022)
7.2.1 Global De-Icing Systems Revenue (USD Million), Market Share (%) by Applications (2018-2022)
8 Global De-Icing Systems Development Regional Status and Outlook
8.1 Global De-Icing Systems Revenue (USD Million) By Regions (2018-2022)
8.2 North America De-Icing Systems Revenue (USD Million) by Type, and Application (2018-2022)
8.2.1 North America De-Icing Systems Revenue (USD Million) by Country (2018-2022)
8.2.2 North America De-Icing Systems Revenue (USD Million) by Type (2018-2022)
8.2.3 North America De-Icing Systems Revenue (USD Million) by Applications (2018-2022)
8.3 Europe De-Icing Systems Revenue (USD Million), by Type, and Applications (USD Million) (2018-2022)
8.3.1 Europe De-Icing Systems Revenue (USD Million), by Country (2018-2022)
8.3.2 Europe De-Icing Systems Revenue (USD Million) by Type (2018-2022)
8.3.3 Europe De-Icing Systems Revenue (USD Million) by Applications (2018-2022)
8.4 Asia Pacific De-Icing Systems Revenue (USD Million), and Revenue (USD Million) by Type, and Applications (2018-2022)
8.4.1 Asia Pacific De-Icing Systems Revenue (USD Million) by Country (2018-2022)
8.4.2 Asia Pacific De-Icing Systems Revenue (USD Million) by Type (2018-2022)
8.4.3 Asia Pacific De-Icing Systems Revenue (USD Million) by Applications (2018-2022)
8.5 South America De-Icing Systems Revenue (USD Million), by Type, and Applications (2018-2022)
8.5.1 South America De-Icing Systems Revenue (USD Million), by Country (2018-2022)
8.5.2 South America De-Icing Systems Revenue (USD Million) by Type (2018-2022)
8.5.3 South America De-Icing Systems Revenue (USD Million) by Applications (2018-2022)
8.6 Middle East and Africa De-Icing Systems Revenue (USD Million), by Type, Technology, Application, Thickness (2018-2022)
8.6.1 Middle East and Africa De-Icing Systems Revenue (USD Million) by Country (2018-2022)
8.6.2 Middle East and Africa De-Icing Systems Revenue (USD Million) by Type (2018-2022)
8.6.3 Middle East and Africa De-Icing Systems Revenue (USD Million) by Applications (2018-2022)
9 Company Profiles
10 Global De-Icing Systems Market Revenue (USD Million), by Type, and Applications (2023-2030)
10.1 Global De-Icing Systems Revenue (USD Million) and Market Share (%) by Type (2023-2030)
10.1.1 Global De-Icing Systems Revenue (USD Million), and Market Share (%) by Type (2023-2030)
10.2 Global De-Icing Systems Revenue (USD Million) and Market Share (%) by Applications (2023-2030)
10.2.1 Global De-Icing Systems Revenue (USD Million), and Market Share (%) by Applications (2023-2030)
11 Global De-Icing Systems Development Regional Status and Outlook Forecast
11.1 Global De-Icing Systems Revenue (USD Million) By Regions (2023-2030)
11.2 North America De-Icing Systems Revenue (USD Million) by Type, and Applications (2023-2030)
11.2.1 North America De-Icing Systems Revenue (USD) Million by Country (2023-2030)
11.2.2 North America De-Icing Systems Revenue (USD Million), by Type (2023-2030)
11.2.3 North America De-Icing Systems Revenue (USD Million), Market Share (%) by Applications (2023-2030)
11.3 Europe De-Icing Systems Revenue (USD Million), by Type, and Applications (2023-2030)
11.3.1 Europe De-Icing Systems Revenue (USD Million), by Country (2023-2030)
11.3.2 Europe De-Icing Systems Revenue (USD Million), by Type (2023-2030)
11.3.3 Europe De-Icing Systems Revenue (USD Million), by Applications (2023-2030)
11.4 Asia Pacific De-Icing Systems Revenue (USD Million) by Type, and Applications (2023-2030)
11.4.1 Asia Pacific De-Icing Systems Revenue (USD Million), by Country (2023-2030)
11.4.2 Asia Pacific De-Icing Systems Revenue (USD Million), by Type (2023-2030)
11.4.3 Asia Pacific De-Icing Systems Revenue (USD Million), by Applications (2023-2030)
11.5 South America De-Icing Systems Revenue (USD Million), by Type, and Applications (2023-2030)
11.5.1 South America De-Icing Systems Revenue (USD Million), by Country (2023-2030)
11.5.2 South America De-Icing Systems Revenue (USD Million), by Type (2023-2030)
11.5.3 South America De-Icing Systems Revenue (USD Million), by Applications (2023-2030)
11.6 Middle East and Africa De-Icing Systems Revenue (USD Million), by Type, and Applications (2023-2030)
11.6.1 Middle East and Africa De-Icing Systems Revenue (USD Million), by region (2023-2030)
11.6.2 Middle East and Africa De-Icing Systems Revenue (USD Million), by Type (2023-2030)
11.6.3 Middle East and Africa De-Icing Systems Revenue (USD Million), by Applications (2023-2030)
12 Methodology and Data Sources
12.1 Methodology/Research Approach
12.1.1 Research Programs/Design
12.1.2 Market Size Estimation
12.1.3 Market Breakdown and Data Triangulation
12.2 Data Sources
12.2.1 Secondary Sources
12.2.2 Primary Sources
12.3 Disclaimer
List of Tables
Table 1 Market Segmentation Analysis
Table 2 Global De-Icing Systems Market Companies with Areas Served
Table 3 Products Offerings Global De-Icing Systems Market
Table 4 Low Growth Scenario Forecasts
Table 5 Reference Case Growth Scenario
Table 6 High Growth Case Scenario
Table 7 Global De-Icing Systems Revenue (USD Million) And CAGR (%) By Type (2018-2030)
Table 8 Global De-Icing Systems Revenue (USD Million) And CAGR (%) By Applications (2018-2030)
Table 9 Global De-Icing Systems Revenue (USD Million) And CAGR (%) By Regions (2018-2030)
Table 10 Global De-Icing Systems Revenue (USD Million) By Type (2018-2022)
Table 11 Global De-Icing Systems Revenue Market Share (%) By Type (2018-2022)
Table 12 Global De-Icing Systems Revenue (USD Million) By Applications (2018-2022)
Table 13 Global De-Icing Systems Revenue Market Share (%) By Applications (2018-2022)
Table 14 Global De-Icing Systems Market Revenue (USD Million) By Regions (2018-2022)
Table 15 Global De-Icing Systems Market Share (%) By Regions (2018-2022)
Table 16 North America De-Icing Systems Revenue (USD Million) By Country (2018-2022)
Table 17 North America De-Icing Systems Revenue (USD Million) By Type (2018-2022)
Table 18 North America De-Icing Systems Revenue (USD Million) By Applications (2018-2022)
Table 19 Europe De-Icing Systems Revenue (USD Million) By Country (2018-2022)
Table 20 Europe De-Icing Systems Revenue (USD Million) By Type (2018-2022)
Table 21 Europe De-Icing Systems Revenue (USD Million) By Applications (2018-2022)
Table 22 Asia Pacific De-Icing Systems Revenue (USD Million) By Country (2018-2022)
Table 23 Asia Pacific De-Icing Systems Revenue (USD Million) By Type (2018-2022)
Table 24 Asia Pacific De-Icing Systems Revenue (USD Million) By Applications (2018-2022)
Table 25 South America De-Icing Systems Revenue (USD Million) By Country (2018-2022)
Table 26 South America De-Icing Systems Revenue (USD Million) By Type (2018-2022)
Table 27 South America De-Icing Systems Revenue (USD Million) By Applications (2018-2022)
Table 28 Middle East and Africa De-Icing Systems Revenue (USD Million) By Region (2018-2022)
Table 29 Middle East and Africa De-Icing Systems Revenue (USD Million) By Type (2018-2022)
Table 30 Middle East and Africa De-Icing Systems Revenue (USD Million) By Applications (2018-2022)
Table 31 Financial Analysis
Table 32 Global De-Icing Systems Revenue (USD Million) By Type (2023-2030)
Table 33 Global De-Icing Systems Revenue Market Share (%) By Type (2023-2030)
Table 34 Global De-Icing Systems Revenue (USD Million) By Applications (2023-2030)
Table 35 Global De-Icing Systems Revenue Market Share (%) By Applications (2023-2030)
Table 36 Global De-Icing Systems Market Revenue (USD Million), And Revenue (USD Million) By Regions (2023-2030)
Table 37 North America De-Icing Systems Revenue (USD)By Country (2023-2030)
Table 38 North America De-Icing Systems Revenue (USD Million) By Type (2023-2030)
Table 39 North America De-Icing Systems Revenue (USD Million) By Applications (2023-2030)
Table 40 Europe De-Icing Systems Revenue (USD Million) By Country (2023-2030)
Table 41 Europe De-Icing Systems Revenue (USD Million) By Type (2023-2030)
Table 42 Europe De-Icing Systems Revenue (USD Million) By Applications (2023-2030)
Table 43 Asia Pacific De-Icing Systems Revenue (USD Million) By Country (2023-2030)
Table 44 Asia Pacific De-Icing Systems Revenue (USD Million) By Type (2023-2030)
Table 45 Asia Pacific De-Icing Systems Revenue (USD Million) By Applications (2023-2030)
Table 46 South America De-Icing Systems Revenue (USD Million) By Country (2023-2030)
Table 47 South America De-Icing Systems Revenue (USD Million) By Type (2023-2030)
Table 48 South America De-Icing Systems Revenue (USD Million) By Applications (2023-2030)
Table 49 Middle East and Africa De-Icing Systems Revenue (USD Million) By Region (2023-2030)
Table 50 Middle East and Africa De-Icing Systems Revenue (USD Million) By Region (2023-2030)
Table 51 Middle East and Africa De-Icing Systems Revenue (USD Million) By Type (2023-2030)
Table 52 Middle East and Africa De-Icing Systems Revenue (USD Million) By Applications (2023-2030)
Table 53 Research Programs/Design for This Report
Table 54 Key Data Information from Secondary Sources
Table 55 Key Data Information from Primary Sources
List of Figures
Figure 1 Market Scope
Figure 2 Porter’s Five Forces
Figure 3 Global De-Icing Systems Revenue (USD Million) By Type (2018-2022)
Figure 4 Global De-Icing Systems Revenue Market Share (%) By Type (2022)
Figure 5 Global De-Icing Systems Revenue (USD Million) By Applications (2018-2022)
Figure 6 Global De-Icing Systems Revenue Market Share (%) By Applications (2022)
Figure 7 Global De-Icing Systems Market Revenue (USD Million) By Regions (2018-2022)
Figure 8 Global De-Icing Systems Market Share (%) By Regions (2022)
Figure 9 North America De-Icing Systems Revenue (USD Million) By Country (2018-2022)
Figure 10 North America De-Icing Systems Revenue (USD Million) By Type (2018-2022)
Figure 11 North America De-Icing Systems Revenue (USD Million) By Applications (2018-2022)
Figure 12 Europe De-Icing Systems Revenue (USD Million) By Country (2018-2022)
Figure 13 Europe De-Icing Systems Revenue (USD Million) By Type (2018-2022)
Figure 14 Europe De-Icing Systems Revenue (USD Million) By Applications (2018-2022)
Figure 15 Asia Pacific De-Icing Systems Revenue (USD Million) By Country (2018-2022)
Figure 16 Asia Pacific De-Icing Systems Revenue (USD Million) By Type (2018-2022)
Figure 17 Asia Pacific De-Icing Systems Revenue (USD Million) By Applications (2018-2022)
Figure 18 South America De-Icing Systems Revenue (USD Million) By Country (2018-2022)
Figure 19 South America De-Icing Systems Revenue (USD Million) By Type (2018-2022)
Figure 20 South America De-Icing Systems Revenue (USD Million) By Applications (2018-2022)
Figure 21 Middle East and Africa De-Icing Systems Revenue (USD Million) By Region (2018-2022)
Figure 22 Middle East and Africa De-Icing Systems Revenue (USD Million) By Type (2018-2022)
Figure 23 Middle East and Africa De-Icing Systems Revenue (USD Million) By Applications (2018-2022)
Figure 24 Global De-Icing Systems Revenue (USD Million) By Type (2023-2030)
Figure 25 Global De-Icing Systems Revenue Market Share (%) By Type (2030)
Figure 26 Global De-Icing Systems Revenue (USD Million) By Applications (2023-2030)
Figure 27 Global De-Icing Systems Revenue Market Share (%) By Applications (2030)
Figure 28 Global De-Icing Systems Market Revenue (USD Million) By Regions (2023-2030)
Figure 29 North America De-Icing Systems Revenue (USD Million) By Country (2023-2030)
Figure 30 North America De-Icing Systems Revenue (USD Million) By Type (2023-2030)
Figure 31 North America De-Icing Systems Revenue (USD Million) By Applications (2023-2030)
Figure 32 Europe De-Icing Systems Revenue (USD Million) By Country (2023-2030)
Figure 33 Europe De-Icing Systems Revenue (USD Million) By Type (2023-2030)
Figure 34 Europe De-Icing Systems Revenue (USD Million) By Applications (2023-2030)
Figure 35 Asia Pacific De-Icing Systems Revenue (USD Million) By Country (2023-2030)
Figure 36 Asia Pacific De-Icing Systems Revenue (USD Million) By Type (2023-2030)
Figure 37 Asia Pacific De-Icing Systems Revenue (USD Million) By Applications (2023-2030)
Figure 38 South America De-Icing Systems Revenue (USD Million) By Country (2023-2030)
Figure 39 South America De-Icing Systems Revenue (USD Million) By Type (2023-2030)
Figure 40 South America De-Icing Systems Revenue (USD Million) By Applications (2023-2030)
Figure 41 Middle East and Africa De-Icing Systems Revenue (USD Million) By Region (2023-2030)
Figure 42 Middle East and Africa De-Icing Systems Revenue (USD Million) By Region (2023-2030)
Figure 43 Middle East and Africa De-Icing Systems Revenue (USD Million) By Type (2023-2030)
Figure 44 Middle East and Africa De-Icing Systems Revenue (USD Million) By Applications (2023-2030)
Figure 45 Bottom-Up and Top-Down Approaches for This Report
Figure 46 Data Triangulation
