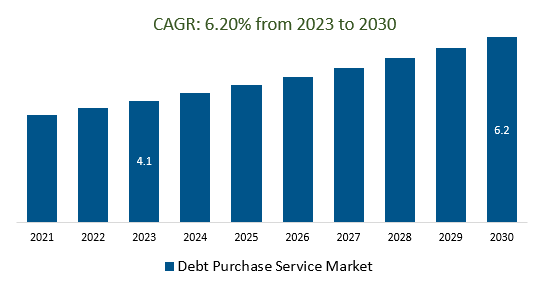
The global Debt Purchase Service Market Size is estimated to be US$ 4.1 Billion in 2023 and is poised to register 6.20% growth over the forecast period from 2023 to 2030
The market growth is driven by increasing demand for Digital Transformation service providers were increasingly adopting digital tools and platforms to streamline their operations, enhance customer experiences, and improve efficiency in debt purchasing processes data analytics and artificial intelligence were being utilized to analyze large volumes of debt data, assess borrower profiles, and predict repayment behaviors, leading to more informed debt purchasing decisions.
Leading companies are focusing on Regulatory Evolution, Global Market Growth, Technological Integration, Ethical Debt Purchasing, Innovative Funding Models, Macro-Economic Factors, and others to boost market shares in the industry.
Market Overview
The debt purchase service market is a growing industry that involves acquiring the right to collect a debt and increasing debts growing popularity of collection outsourcing, the increasing use of technology in the collection, and the growing demand for debt relief solutions. The Efficiency of technology streamlines processes, from due diligence to debt recovery, increasing operational efficiency and reducing costs for debt purchase service providers.
Market Dynamics
Market Trends: - Companies are launching Digital Transformation to attract a consumer base
Digital transformation has the collection analysis of vast amounts of data related to debt portfolios, debtor behavior, and market trends. Advanced analytics debt purchase service providers make more informed decisions, enhancing portfolio valuation and debtor targeting. Further data security and remote work capabilities are prioritized. Partnerships with tech firms expand data sources, facilitating global market transformation and aligning debt purchasing with digital advancements, benefiting providers, debtors, and regulatory adherence.
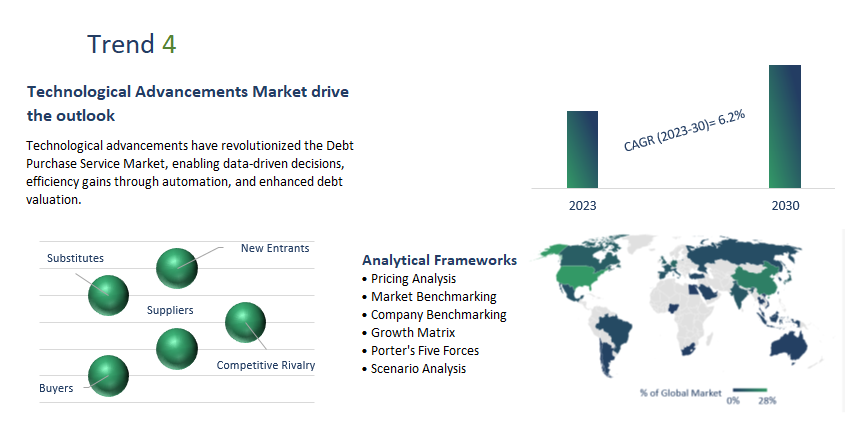
Market Drivers: Technological Advancements market drive the outlook
Technological advancements have revolutionized the Debt Purchase Service Market, enabling data-driven decisions, efficiency gains through automation, and enhanced debt valuation. Personalized debtor communication, and regulatory compliance check assessment are streamlined, fostering a customer-centric approach and minimizing legal risks. These advances also facilitate global market access, innovation, transparency, and remote work capabilities, reshaping industry practices and improving outcomes for debtors, creditors, and investors alike.
Market Opportunity: Introduction of Global Market Access
Global market access offers a broader range of debt portfolios with varying characteristics, allowing investors to choose assets that align with their appetite, return expectations, and investment strategies. The debt benefits from global market access as well. Debt purchase service providers with international reach more flexible repayment options and solutions tailored to different economic contexts.
Market Segmentation
Integration & Implementation
Integration and implementation in the Debt Purchase Service Market drive operational efficiency through technology adoption, streamlined processes, and data analytics. This enables data-driven decision-making for portfolio acquisitions and debtor engagement. Compliance checks ensure ethical practices and regulatory adherence, while a customer-centric approach enhances debtor satisfaction. Global market access is facilitated through cross-border transactions, and transparency is elevated with debtor access to information. Remote work capabilities ensure continuity and collaborations with tech providers enrich due diligence. Ultimately, integration transforms the market, optimizing operations, improving outcomes, and setting new standards.
Healthcare:
Healthcare in the Debt Purchase Service Market is unique challenges and opportunities. Healthcare debt portfolios, stemming from medical bills and expenses, require specialized approaches for debtor communication, considering the sensitivity of medical situations. The Healthcare sector's integration expands the market providing investment opportunities while emphasizing the importance of responsible debt purchasing, benefiting both debtors and investors.
Market Segmentation
By Type
- Online Service
- Offline Service
By Application
- Collection Agencies
- Finance Companies
- Retail Companies
- Law Firms & Government Departments
- Others
By Sales Channel
- Direct Channel
- Distribution Channel
By Region
- North America (United States, Canada, Mexico)
- Europe (Germany, France, United Kingdom, Spain, Italy, Others)
- Asia Pacific (China, India, Japan, South Korea, Australia, Others)
- Latin America (Brazil, Argentina, Others)
- Middle East and Africa (Saudi Arabia, UAE, Kuwait, Other Middle East, South Africa, Nigeria, Other Africa)
Key Players
Leading companies profiled in the study include-
- International Construction Co
- Experian Plc
- J.S.T. Corporation
- Comtronic Systems
- Pamar Systems
- Quantrax Corp
- Totality Software
- CollectMORE Pty Ltd
- CDS Software
- Comtech Systems
- CODIX
- Collect Tech
- Indigo Cloud
- Kuhlekt
- Case Master
- Encore Capital Group
- Click Notices
- PRA Group
- Intrum AB
- Cerved Group
- Arvato
- EOS Group
- Hoist Finance
- B2Holding
- Arrow Global
- Axactor SE
- Link Financial
- Hilton-Baird Collection Services
- KRUK Group
Debt Purchase Service Systems Market Outlook 2023
1 Market Overview
1.1 Introduction to Debt Purchase Service Systems Market
1.2 Scope of the Study
1.3 Research Objective
1.3.1 Key Market Scope and Segments
1.3.2 Players Covered
1.3.3 Years Considered
2 Executive Summary
2.1 2023 Debt Purchase Service Systems Industry- Market Statistics
3 Market Dynamics
3.1 Market Drivers
3.2 Market Challenges
3.3 Market Opportunities
3.4 Market Trends
4 Market Factor Analysis
4.1 Porter’s Five Forces
4.2 Market Entropy
4.2.1 Global Debt Purchase Service Systems Market Companies with Area Served
4.2.2 Products Offerings Global Debt Purchase Service Systems Market
5 COVID-19 Impact Analysis and Outlook Scenarios
5.1.1 Covid-19 Impact Analysis
5.1.2 Post-COVID-19 Scenario- Low Growth Case
5.1.3 Post-COVID-19 Scenario- Reference Growth Case
5.1.4 Post-COVID-19 Scenario- Low Growth Case
6 Global Debt Purchase Service Systems Market Trends
6.1 Global Debt Purchase Service Systems Revenue (USD Million) and CAGR (%) by Type (2018-2030)
6.2 Global Debt Purchase Service Systems Revenue (USD Million) and CAGR (%) by Applications (2018-2030)
6.3 Global Debt Purchase Service Systems Revenue (USD Million) and CAGR (%) by Regions (2018-2030)
7 Global Debt Purchase Service Systems Market Revenue (USD Million) by Type, and Applications (2018-2022)
7.1 Global Debt Purchase Service Systems Revenue (USD Million) by Type (2018-2022)
7.1.1 Global Debt Purchase Service Systems Revenue (USD Million), Market Share (%) by Type (2018-2022)
7.2 Global Debt Purchase Service Systems Revenue (USD Million) by Applications (2018-2022)
7.2.1 Global Debt Purchase Service Systems Revenue (USD Million), Market Share (%) by Applications (2018-2022)
8 Global Debt Purchase Service Systems Development Regional Status and Outlook
8.1 Global Debt Purchase Service Systems Revenue (USD Million) By Regions (2018-2022)
8.2 North America Debt Purchase Service Systems Revenue (USD Million) by Type, and Application (2018-2022)
8.2.1 North America Debt Purchase Service Systems Revenue (USD Million) by Country (2018-2022)
8.2.2 North America Debt Purchase Service Systems Revenue (USD Million) by Type (2018-2022)
8.2.3 North America Debt Purchase Service Systems Revenue (USD Million) by Applications (2018-2022)
8.3 Europe Debt Purchase Service Systems Revenue (USD Million), by Type, and Applications (USD Million) (2018-2022)
8.3.1 Europe Debt Purchase Service Systems Revenue (USD Million), by Country (2018-2022)
8.3.2 Europe Debt Purchase Service Systems Revenue (USD Million) by Type (2018-2022)
8.3.3 Europe Debt Purchase Service Systems Revenue (USD Million) by Applications (2018-2022)
8.4 Asia Pacific Debt Purchase Service Systems Revenue (USD Million), and Revenue (USD Million) by Type, and Applications (2018-2022)
8.4.1 Asia Pacific Debt Purchase Service Systems Revenue (USD Million) by Country (2018-2022)
8.4.2 Asia Pacific Debt Purchase Service Systems Revenue (USD Million) by Type (2018-2022)
8.4.3 Asia Pacific Debt Purchase Service Systems Revenue (USD Million) by Applications (2018-2022)
8.5 South America Debt Purchase Service Systems Revenue (USD Million), by Type, and Applications (2018-2022)
8.5.1 South America Debt Purchase Service Systems Revenue (USD Million), by Country (2018-2022)
8.5.2 South America Debt Purchase Service Systems Revenue (USD Million) by Type (2018-2022)
8.5.3 South America Debt Purchase Service Systems Revenue (USD Million) by Applications (2018-2022)
8.6 Middle East and Africa Debt Purchase Service Systems Revenue (USD Million), by Type, Technology, Application, Thickness (2018-2022)
8.6.1 Middle East and Africa Debt Purchase Service Systems Revenue (USD Million) by Country (2018-2022)
8.6.2 Middle East and Africa Debt Purchase Service Systems Revenue (USD Million) by Type (2018-2022)
8.6.3 Middle East and Africa Debt Purchase Service Systems Revenue (USD Million) by Applications (2018-2022)
9 Company Profiles
10 Global Debt Purchase Service Systems Market Revenue (USD Million), by Type, and Applications (2023-2030)
10.1 Global Debt Purchase Service Systems Revenue (USD Million) and Market Share (%) by Type (2023-2030)
10.1.1 Global Debt Purchase Service Systems Revenue (USD Million), and Market Share (%) by Type (2023-2030)
10.2 Global Debt Purchase Service Systems Revenue (USD Million) and Market Share (%) by Applications (2023-2030)
10.2.1 Global Debt Purchase Service Systems Revenue (USD Million), and Market Share (%) by Applications (2023-2030)
11 Global Debt Purchase Service Systems Development Regional Status and Outlook Forecast
11.1 Global Debt Purchase Service Systems Revenue (USD Million) By Regions (2023-2030)
11.2 North America Debt Purchase Service Systems Revenue (USD Million) by Type, and Applications (2023-2030)
11.2.1 North America Debt Purchase Service Systems Revenue (USD) Million by Country (2023-2030)
11.2.2 North America Debt Purchase Service Systems Revenue (USD Million), by Type (2023-2030)
11.2.3 North America Debt Purchase Service Systems Revenue (USD Million), Market Share (%) by Applications (2023-2030)
11.3 Europe Debt Purchase Service Systems Revenue (USD Million), by Type, and Applications (2023-2030)
11.3.1 Europe Debt Purchase Service Systems Revenue (USD Million), by Country (2023-2030)
11.3.2 Europe Debt Purchase Service Systems Revenue (USD Million), by Type (2023-2030)
11.3.3 Europe Debt Purchase Service Systems Revenue (USD Million), by Applications (2023-2030)
11.4 Asia Pacific Debt Purchase Service Systems Revenue (USD Million) by Type, and Applications (2023-2030)
11.4.1 Asia Pacific Debt Purchase Service Systems Revenue (USD Million), by Country (2023-2030)
11.4.2 Asia Pacific Debt Purchase Service Systems Revenue (USD Million), by Type (2023-2030)
11.4.3 Asia Pacific Debt Purchase Service Systems Revenue (USD Million), by Applications (2023-2030)
11.5 South America Debt Purchase Service Systems Revenue (USD Million), by Type, and Applications (2023-2030)
11.5.1 South America Debt Purchase Service Systems Revenue (USD Million), by Country (2023-2030)
11.5.2 South America Debt Purchase Service Systems Revenue (USD Million), by Type (2023-2030)
11.5.3 South America Debt Purchase Service Systems Revenue (USD Million), by Applications (2023-2030)
11.6 Middle East and Africa Debt Purchase Service Systems Revenue (USD Million), by Type, and Applications (2023-2030)
11.6.1 Middle East and Africa Debt Purchase Service Systems Revenue (USD Million), by Region (2023-2030)
11.6.2 Middle East and Africa Debt Purchase Service Systems Revenue (USD Million), by Type (2023-2030)
11.6.3 Middle East and Africa Debt Purchase Service Systems Revenue (USD Million), by Applications (2023-2030)
12 Methodology and Data Sources
12.1 Methodology/Research Approach
12.1.1 Research Programs/Design
12.1.2 Market Size Estimation
12.1.3 Market Breakdown and Data Triangulation
12.2 Data Sources
12.2.1 Secondary Sources
12.2.2 Primary Sources
12.3 Disclaimer
List Of Tables
Table 1 Market Segmentation Analysis
Table 2 Global Debt Purchase Service Systems Market Companies with Areas Served
Table 3 Products Offerings Global Debt Purchase Service Systems Market
Table 4 Low Growth Scenario Forecasts
Table 5 Reference Case Growth Scenario
Table 6 High Growth Case Scenario
Table 7 Global Debt Purchase Service Systems Revenue (USD Million) And CAGR (%) By Type (2018-2030)
Table 8 Global Debt Purchase Service Systems Revenue (USD Million) And CAGR (%) By Applications (2018-2030)
Table 9 Global Debt Purchase Service Systems Revenue (USD Million) And CAGR (%) By Regions (2018-2030)
Table 10 Global Debt Purchase Service Systems Revenue (USD Million) By Type (2018-2022)
Table 11 Global Debt Purchase Service Systems Revenue Market Share (%) By Type (2018-2022)
Table 12 Global Debt Purchase Service Systems Revenue (USD Million) By Applications (2018-2022)
Table 13 Global Debt Purchase Service Systems Revenue Market Share (%) By Applications (2018-2022)
Table 14 Global Debt Purchase Service Systems Market Revenue (USD Million) By Regions (2018-2022)
Table 15 Global Debt Purchase Service Systems Market Share (%) By Regions (2018-2022)
Table 16 North America Debt Purchase Service Systems Revenue (USD Million) By Country (2018-2022)
Table 17 North America Debt Purchase Service Systems Revenue (USD Million) By Type (2018-2022)
Table 18 North America Debt Purchase Service Systems Revenue (USD Million) By Applications (2018-2022)
Table 19 Europe Debt Purchase Service Systems Revenue (USD Million) By Country (2018-2022)
Table 20 Europe Debt Purchase Service Systems Revenue (USD Million) By Type (2018-2022)
Table 21 Europe Debt Purchase Service Systems Revenue (USD Million) By Applications (2018-2022)
Table 22 Asia Pacific Debt Purchase Service Systems Revenue (USD Million) By Country (2018-2022)
Table 23 Asia Pacific Debt Purchase Service Systems Revenue (USD Million) By Type (2018-2022)
Table 24 Asia Pacific Debt Purchase Service Systems Revenue (USD Million) By Applications (2018-2022)
Table 25 South America Debt Purchase Service Systems Revenue (USD Million) By Country (2018-2022)
Table 26 South America Debt Purchase Service Systems Revenue (USD Million) By Type (2018-2022)
Table 27 South America Debt Purchase Service Systems Revenue (USD Million) By Applications (2018-2022)
Table 28 Middle East and Africa Debt Purchase Service Systems Revenue (USD Million) By Region (2018-2022)
Table 29 Middle East and Africa Debt Purchase Service Systems Revenue (USD Million) By Type (2018-2022)
Table 30 Middle East and Africa Debt Purchase Service Systems Revenue (USD Million) By Applications (2018-2022)
Table 31 Financial Analysis
Table 32 Global Debt Purchase Service Systems Revenue (USD Million) By Type (2023-2030)
Table 33 Global Debt Purchase Service Systems Revenue Market Share (%) By Type (2023-2030)
Table 34 Global Debt Purchase Service Systems Revenue (USD Million) By Applications (2023-2030)
Table 35 Global Debt Purchase Service Systems Revenue Market Share (%) By Applications (2023-2030)
Table 36 Global Debt Purchase Service Systems Market Revenue (USD Million), And Revenue (USD Million) By Regions (2023-2030)
Table 37 North America Debt Purchase Service Systems Revenue (USD)By Country (2023-2030)
Table 38 North America Debt Purchase Service Systems Revenue (USD Million) By Type (2023-2030)
Table 39 North America Debt Purchase Service Systems Revenue (USD Million) By Applications (2023-2030)
Table 40 Europe Debt Purchase Service Systems Revenue (USD Million) By Country (2023-2030)
Table 41 Europe Debt Purchase Service Systems Revenue (USD Million) By Type (2023-2030)
Table 42 Europe Debt Purchase Service Systems Revenue (USD Million) By Applications (2023-2030)
Table 43 Asia Pacific Debt Purchase Service Systems Revenue (USD Million) By Country (2023-2030)
Table 44 Asia Pacific Debt Purchase Service Systems Revenue (USD Million) By Type (2023-2030)
Table 45 Asia Pacific Debt Purchase Service Systems Revenue (USD Million) By Applications (2023-2030)
Table 46 South America Debt Purchase Service Systems Revenue (USD Million) By Country (2023-2030)
Table 47 South America Debt Purchase Service Systems Revenue (USD Million) By Type (2023-2030)
Table 48 South America Debt Purchase Service Systems Revenue (USD Million) By Applications (2023-2030)
Table 49 Middle East and Africa Debt Purchase Service Systems Revenue (USD Million) By Region (2023-2030)
Table 50 Middle East and Africa Debt Purchase Service Systems Revenue (USD Million) By Region (2023-2030)
Table 51 Middle East and Africa Debt Purchase Service Systems Revenue (USD Million) By Type (2023-2030)
Table 52 Middle East and Africa Debt Purchase Service Systems Revenue (USD Million) By Applications (2023-2030)
Table 53 Research Programs/Design for This Report
Table 54 Key Data Information from Secondary Sources
Table 55 Key Data Information from Primary Sources
List Of Figures
Figure 1 Market Scope
Figure 2 Porter’s Five Forces
Figure 3 Global Debt Purchase Service Systems Revenue (USD Million) By Type (2018-2022)
Figure 4 Global Debt Purchase Service Systems Revenue Market Share (%) By Type (2022)
Figure 5 Global Debt Purchase Service Systems Revenue (USD Million) By Applications (2018-2022)
Figure 6 Global Debt Purchase Service Systems Revenue Market Share (%) By Applications (2022)
Figure 7 Global Debt Purchase Service Systems Market Revenue (USD Million) By Regions (2018-2022)
Figure 8 Global Debt Purchase Service Systems Market Share (%) By Regions (2022)
Figure 9 North America Debt Purchase Service Systems Revenue (USD Million) By Country (2018-2022)
Figure 10 North America Debt Purchase Service Systems Revenue (USD Million) By Type (2018-2022)
Figure 11 North America Debt Purchase Service Systems Revenue (USD Million) By Applications (2018-2022)
Figure 12 Europe Debt Purchase Service Systems Revenue (USD Million) By Country (2018-2022)
Figure 13 Europe Debt Purchase Service Systems Revenue (USD Million) By Type (2018-2022)
Figure 14 Europe Debt Purchase Service Systems Revenue (USD Million) By Applications (2018-2022)
Figure 15 Asia Pacific Debt Purchase Service Systems Revenue (USD Million) By Country (2018-2022)
Figure 16 Asia Pacific Debt Purchase Service Systems Revenue (USD Million) By Type (2018-2022)
Figure 17 Asia Pacific Debt Purchase Service Systems Revenue (USD Million) By Applications (2018-2022)
Figure 18 South America Debt Purchase Service Systems Revenue (USD Million) By Country (2018-2022)
Figure 19 South America Debt Purchase Service Systems Revenue (USD Million) By Type (2018-2022)
Figure 20 South America Debt Purchase Service Systems Revenue (USD Million) By Applications (2018-2022)
Figure 21 Middle East and Africa Debt Purchase Service Systems Revenue (USD Million) By Region (2018-2022)
Figure 22 Middle East and Africa Debt Purchase Service Systems Revenue (USD Million) By Type (2018-2022)
Figure 23 Middle East and Africa Debt Purchase Service Systems Revenue (USD Million) By Applications (2018-2022)
Figure 24 Global Debt Purchase Service Systems Revenue (USD Million) By Type (2023-2030)
Figure 25 Global Debt Purchase Service Systems Revenue Market Share (%) By Type (2030)
Figure 26 Global Debt Purchase Service Systems Revenue (USD Million) By Applications (2023-2030)
Figure 27 Global Debt Purchase Service Systems Revenue Market Share (%) By Applications (2030)
Figure 28 Global Debt Purchase Service Systems Market Revenue (USD Million) By Regions (2023-2030)
Figure 29 North America Debt Purchase Service Systems Revenue (USD Million) By Country (2023-2030)
Figure 30 North America Debt Purchase Service Systems Revenue (USD Million) By Type (2023-2030)
Figure 31 North America Debt Purchase Service Systems Revenue (USD Million) By Applications (2023-2030)
Figure 32 Europe Debt Purchase Service Systems Revenue (USD Million) By Country (2023-2030)
Figure 33 Europe Debt Purchase Service Systems Revenue (USD Million) By Type (2023-2030)
Figure 34 Europe Debt Purchase Service Systems Revenue (USD Million) By Applications (2023-2030)
Figure 35 Asia Pacific Debt Purchase Service Systems Revenue (USD Million) By Country (2023-2030)
Figure 36 Asia Pacific Debt Purchase Service Systems Revenue (USD Million) By Type (2023-2030)
Figure 37 Asia Pacific Debt Purchase Service Systems Revenue (USD Million) By Applications (2023-2030)
Figure 38 South America Debt Purchase Service Systems Revenue (USD Million) By Country (2023-2030)
Figure 39 South America Debt Purchase Service Systems Revenue (USD Million) By Type (2023-2030)
Figure 40 South America Debt Purchase Service Systems Revenue (USD Million) By Applications (2023-2030)
Figure 41 Middle East and Africa Debt Purchase Service Systems Revenue (USD Million) By Region (2023-2030)
Figure 42 Middle East and Africa Debt Purchase Service Systems Revenue (USD Million) By Region (2023-2030)
Figure 43 Middle East and Africa Debt Purchase Service Systems Revenue (USD Million) By Type (2023-2030)
Figure 44 Middle East and Africa Debt Purchase Service Systems Revenue (USD Million) By Applications (2023-2030)
Figure 45 Bottom-Up and Top-Down Approaches For This Report
Figure 46 Data Triangulation
