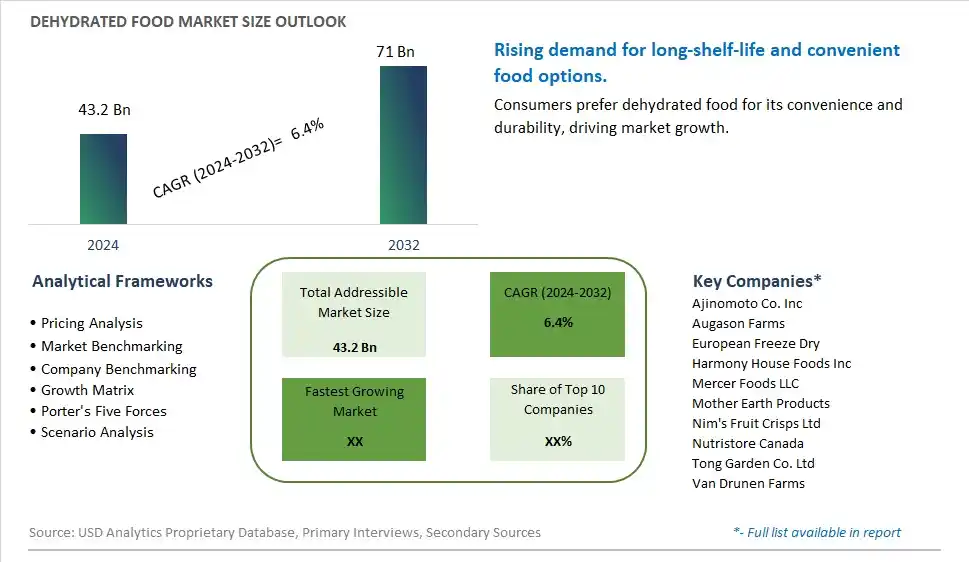
Global Dehydrated Food Market Size is valued at $43.2 Billion in 2024 and is forecast to register a growth rate (CAGR) of 6.4% to reach $71 Billion by 2032.
The global Dehydrated Food Market Comprehensive Study analyzes and forecasts the market size across 6 regions and 24 countries for diverse segments -By Type (Spray-dried, Freeze-dried, Vacuum-dried, Drum-dried, Others), By Product (Dried Processed Food, Dried Fruit & Vegetable, Dried Dairy, Dried Meat & Seafood, Others), By Distribution Channel (Hypermarket/Supermarket, Convenience Stores, Online Retailing, Others)
An Introduction to Dehydrated Food Market
In 2024, the dehydrated food market is thriving, fueled by the demand for long-lasting, nutrient-dense food options. Dehydrated foods, including fruits, vegetables, meats, and meals, offer extended shelf life and convenience without compromising on nutritional value. The market benefits from advancements in dehydration technologies that preserve flavor, texture, and nutrients. The trend towards clean label and natural ingredients is influencing product development. Increasing consumer interest in emergency preparedness, outdoor activities, and healthy snacking are further supporting market growth.
Dehydrated Food Competitive Landscape
The market report analyses the leading companies in the industry including Ajinomoto Co. Inc, Augason Farms, European Freeze Dry, Harmony House Foods Inc, Mercer Foods LLC, Mother Earth Products, Nim's Fruit Crisps Ltd, Nutristore Canada, Tong Garden Co. Ltd, Van Drunen Farms, and Others.
Dehydrated Food Market Dynamics
Dehydrated Food Market Trend: Growing Demand for Convenient and Long-Shelf-Life Foods
The most prominent trend in the Dehydrated Food Market is the growing demand for convenient and long-shelf-life foods. Dehydrated foods, known for their extended shelf life and ease of storage, are becoming popular among consumers seeking ready-to-eat and emergency food options. This trend is driven by busy lifestyles and the desire for minimal food waste.
Dehydrated Food Market Driver: Health Consciousness and Nutritional Preservation
A key driver in the Dehydrated Food Market is health consciousness and the preservation of nutritional value. As more individuals focus on consuming foods that retain their nutritional content, there is a rising demand for dehydrated foods that offer essential vitamins and minerals while being free from preservatives. This demand supports market growth as consumers seek healthy and convenient food options.
Dehydrated Food Market Opportunity: Innovation in Dehydrated Meal Kits and Snacks
One significant opportunity in the Dehydrated Food Market lies in innovation in dehydrated meal kits and snacks. Companies can develop new products that offer complete meal solutions or healthy snack options, catering to consumers looking for convenient and nutritious food choices. By offering diverse and innovative dehydrated products, manufacturers can attract a broader consumer base and drive market growth.
Dehydrated Food Market Share Analysis- Largest Segment by Type
The Freeze-dried segment of the Dehydrated Food Market is the largest. Freeze-drying, or lyophilization, is preferred for its ability to preserve the flavor, nutritional value, and texture of food products more effectively than other dehydration methods. This process involves removing moisture from food at low temperatures, thereby maintaining the integrity of delicate components such as vitamins and minerals. The growing demand for high-quality, long-shelf-life foods in sectors such as outdoor recreation, emergency preparedness, and gourmet cooking contributes to the dominance of freeze-dried products. Additionally, the increasing preference for premium and natural foods that retain their original properties drives the demand for freeze-dried options.
Dehydrated Food Market Share Analysis- Poised to Grow Fastest Over the Next Five Years by Product
The Dried Fruit & Vegetable segment in the Dehydrated Food Market is poised to grow the fastest over the next five years. This growth is fueled by the rising consumer preference for healthy snacks and convenience foods. Dried fruits and vegetables are valued for their extended shelf life, portability, and minimal processing, which helps retain their nutritional benefits. As consumers become more health-conscious and seek out snacks with natural ingredients, the demand for dried fruits and vegetables continues to increase. Furthermore, the use of dried fruits and vegetables in various culinary applications, such as in salads, soups, and baked goods, supports the segment's rapid growth.
Dehydrated Food Market Share Analysis- Largest Segment by Distribution Channel
The Hypermarket/Supermarket distribution channel is the largest in the Dehydrated Food Market. Hypermarkets and supermarkets serve as key retail environments for dehydrated foods due to their broad consumer reach and extensive product selection. These retail outlets offer a variety of dehydrated products, including fruits, vegetables, and meal components, catering to diverse consumer needs. The convenience of shopping in hypermarkets and supermarkets, combined with the ability to access a wide range of products in one location, drives the prominence of this distribution channel. Additionally, the large-scale nature of these stores allows them to stock and display a significant volume of dehydrated food products.
Dehydrated Food Market Segmentation
By Type
Spray-dried
Freeze-dried
Vacuum-dried
Drum-dried
Others
By Product
Dried Processed Food
Dried Fruit & Vegetable
Dried Dairy
Dried Meat & Seafood
Others
By Distribution Channel
Hypermarket/Supermarket
Convenience Stores
Online Retailing
Others
Countries Analyzed
North America (US, Canada, Mexico)
Europe (Germany, UK, France, Spain, Italy, Russia, Rest of Europe)
Asia Pacific (China, India, Japan, South Korea, Australia, South East Asia, Rest of Asia)
South America (Brazil, Argentina, Rest of South America)
Middle East and Africa (Saudi Arabia, UAE, Rest of Middle East, South Africa, Egypt, Rest of Africa)
Dehydrated Food Companies Profiled in the Study
Ajinomoto Co. Inc
Augason Farms
European Freeze Dry
Harmony House Foods Inc
Mercer Foods LLC
Mother Earth Products
Nim's Fruit Crisps Ltd
Nutristore Canada
Tong Garden Co. Ltd
Van Drunen Farms
*- List Not Exhaustive
Chapter 1. TABLE OF CONTENTS
Chapter 2. Introduction to Dehydrated Food Market
2.1. Market Overview
2.2. Key Statistics and Report Highlights
2.3. Scope of the Comprehensive Study
2.3.1. Market Definition
2.3.2 Countries and Regions Covered
2.3.3 Research Objective
2.3.4 Units, Currency, and Conversions
2.3.5 Industry Value Chain
2.4. Key Market Segments
2.5. Key Companies
2.6. Study Period
Chapter 3. Strategic Analysis Review
3.1. Dehydrated Food Pricing Analysis and Forecast
3.2. Porter’s Five Forces
3.3. Market Ecosystem
3.4. SWOT Analysis
3.5. Regulatory Scenario
3.3. Effects of Inflation, Russia-Ukraine War, moderating economic growth, and other macroeconomic factors
Chapter 4. Competitive Landscape
4.1. Market Share Analysis
4.1.1. Global Dehydrated Food Market Share by Company, 2023
4.1.2. Product Offerings of Leading Dehydrated Food Companies
4.2. Market Entropy
4.2.1. New Product Launches in the Industry
4.2.2. Mergers, Acquisitions, Joint ventures, and Partnerships
4.3. Key Strategies and Best Practices
Chapter 5. Global Market Projections: Best, Reference, and Low Case Scenarios
5.1. Growth Analysis- Case Scenario Definitions
5.2. Low Growth Case Scenario Forecasts
5.3. Reference Growth Case Scenario Forecasts
5.4. High Growth Case Scenario Forecasts
Chapter 6. Market Dynamics
6.1. Dehydrated Food Market Drivers
6.2. Dehydrated Food Market Challenges
6.6. Dehydrated Food Market Opportunities
6.4. Dehydrated Food Market Trends
Chapter 7. Global Dehydrated Food Market Outlook Trends
7.1. Global Dehydrated Food Revenue (USD Million) and CAGR (%) by Type (2021-2032)
7.2. Global Dehydrated Food Revenue (USD Million) and CAGR (%) by Application (2021-2032)
7.3. Global Dehydrated Food Revenue (USD Million) and CAGR (%) by Product (2021-2032)
By Type
Spray-dried
Freeze-dried
Vacuum-dried
Drum-dried
Others
By Product
Dried Processed Food
Dried Fruit & Vegetable
Dried Dairy
Dried Meat & Seafood
Others
By Distribution Channel
Hypermarket/Supermarket
Convenience Stores
Online Retailing
Others
Chapter 8. Global Dehydrated Food Regional Analysis and Outlook
8.1. Global Dehydrated Food Revenue (USD Million) By Regions (2021- 2032)
8.2. North America Dehydrated Food Revenue (USD Million) by Country (2021-2032)
8.2.1. United States Dehydrated Food Regional Analysis and Outlook
8.2.2. Canada Dehydrated Food Regional Analysis and Outlook
8.2.3. Mexico Dehydrated Food Regional Analysis and Outlook
8.3. Europe Dehydrated Food Revenue (USD Million), by Country (2021-2032)
8.3.1. Germany Dehydrated Food Regional Analysis and Outlook
8.3.2. France Dehydrated Food Regional Analysis and Outlook
8.3.3. United Kingdom Dehydrated Food Regional Analysis and Outlook
8.3.4. Spain Dehydrated Food Regional Analysis and Outlook
8.3.5. Italy Dehydrated Food Regional Analysis and Outlook
8.3.6. Russia Dehydrated Food Regional Analysis and Outlook
8.3.7. Rest of Europe Dehydrated Food Regional Analysis and Outlook
8.4. Asia Pacific Dehydrated Food Revenue (USD Million) by Country (2021-2032)
8.4.1. China Dehydrated Food Regional Analysis and Outlook
8.4.2. Japan Dehydrated Food Regional Analysis and Outlook
8.4.3. India Dehydrated Food Regional Analysis and Outlook
8.4.4. South Korea Dehydrated Food Regional Analysis and Outlook
8.4.5. Australia Dehydrated Food Regional Analysis and Outlook
8.4.6. South East Asia Dehydrated Food Regional Analysis and Outlook
8.4.7. Rest of Asia Pacific Dehydrated Food Regional Analysis and Outlook
8.5. South America Dehydrated Food Revenue (USD Million), by Country (2021-2032)
8.5.1. Brazil Dehydrated Food Regional Analysis and Outlook
8.5.2. Argentina Dehydrated Food Regional Analysis and Outlook
8.5.3. Rest of South America Dehydrated Food Regional Analysis and Outlook
8.6. Middle East and Africa Dehydrated Food Revenue (USD Million) by Country (2021-2032)
8.6.1. Middle East Dehydrated Food Regional Analysis and Outlook
8.6.2. Africa Dehydrated Food Regional Analysis and Outlook
Chapter 9. North America Dehydrated Food Analysis and Outlook
9.1. North America Dehydrated Food Revenue (USD Million) by Segments (2021-2032)
9.1.1. North America Dehydrated Food Revenue (USD Million) by Type (2021-2032)
9.1.2. North America Dehydrated Food Revenue (USD Million) by Application (2021-2032)
9.1.3. North America Dehydrated Food Revenue (USD Million) by Product (2021-2032)
By Type
Spray-dried
Freeze-dried
Vacuum-dried
Drum-dried
Others
By Product
Dried Processed Food
Dried Fruit & Vegetable
Dried Dairy
Dried Meat & Seafood
Others
By Distribution Channel
Hypermarket/Supermarket
Convenience Stores
Online Retailing
Others
Chapter 10. Europe Dehydrated Food Analysis and Outlook
10.1. Europe Dehydrated Food Revenue (USD Million), by Segments (USD Million) (2021-2032)
10.1.1. Europe Dehydrated Food Revenue (USD Million) by Type (2021-2032)
10.1.2. Europe Dehydrated Food Revenue (USD Million) by Application (2021-2032)
10.1.3. Europe Dehydrated Food Revenue (USD Million) by Product (2021-2032)
By Type
Spray-dried
Freeze-dried
Vacuum-dried
Drum-dried
Others
By Product
Dried Processed Food
Dried Fruit & Vegetable
Dried Dairy
Dried Meat & Seafood
Others
By Distribution Channel
Hypermarket/Supermarket
Convenience Stores
Online Retailing
Others
Chapter 11. Asia Pacific Dehydrated Food Analysis and Outlook
11.1. Asia Pacific Dehydrated Food Revenue (USD Million), and Revenue (USD Million) by Segments (2021-2032)
11.1.1. Asia Pacific Dehydrated Food Revenue (USD Million) by Type (2021-2032)
11.1.2. Asia Pacific Dehydrated Food Revenue (USD Million) by Application (2021-2032)
11.1.3. Asia Pacific Dehydrated Food Revenue (USD Million) by Product (2021-2032)
By Type
Spray-dried
Freeze-dried
Vacuum-dried
Drum-dried
Others
By Product
Dried Processed Food
Dried Fruit & Vegetable
Dried Dairy
Dried Meat & Seafood
Others
By Distribution Channel
Hypermarket/Supermarket
Convenience Stores
Online Retailing
Others
Chapter 12. South America Dehydrated Food Analysis and Outlook
12.1. South America Dehydrated Food Revenue (USD Million), by Segments (2021-2032)
12.1.1. South America Dehydrated Food Revenue (USD Million) by Type (2021-2032)
12.1.2. South America Dehydrated Food Revenue (USD Million) by Application (2021-2032)
12.1.3. South America Dehydrated Food Revenue (USD Million) by Product (2021-2032)
By Type
Spray-dried
Freeze-dried
Vacuum-dried
Drum-dried
Others
By Product
Dried Processed Food
Dried Fruit & Vegetable
Dried Dairy
Dried Meat & Seafood
Others
By Distribution Channel
Hypermarket/Supermarket
Convenience Stores
Online Retailing
Others
Chapter 13. Middle East and Africa Dehydrated Food Analysis and Outlook
13.1. Middle East and Africa Dehydrated Food Revenue (USD Million), by Segments (2021-2032)
13.1.1. Middle East and Africa Dehydrated Food Revenue (USD Million) by Type (2021-2032)
13.1.2. Middle East and Africa Dehydrated Food Revenue (USD Million) by Application (2021-2032)
13.1.3. Middle East and Africa Dehydrated Food Revenue (USD Million) by Product (2021-2032)
By Type
Spray-dried
Freeze-dried
Vacuum-dried
Drum-dried
Others
By Product
Dried Processed Food
Dried Fruit & Vegetable
Dried Dairy
Dried Meat & Seafood
Others
By Distribution Channel
Hypermarket/Supermarket
Convenience Stores
Online Retailing
Others
Chapter 14. Dehydrated Food Company Profiles
14.1 Business Overview
14.2 Product Profiles
14.3 SWOT Profiles
14.5 Recent Developments
14.6 Financial Profile
List of Companies
Ajinomoto Co. Inc
Augason Farms
European Freeze Dry
Harmony House Foods Inc
Mercer Foods LLC
Mother Earth Products
Nim's Fruit Crisps Ltd
Nutristore Canada
Tong Garden Co. Ltd
Van Drunen Farms
15. Methodology and Data Sources
15.1 Customization Offerings
15.2 Subscription Services
15.3 Related Reports
15.4 Publisher Expertise
LIST OF TABLES
Table 1 Market Segmentation Analysis
Table 2 Global Dehydrated Food Market Share of Leading Companies, 2023
Table 3 Product Offerings of Leading Companies
Table 4 Low Growth Scenario Forecasts
Table 5 Reference Case Growth Scenario
Table 6 High Growth Case Scenario
Table 7 Global Dehydrated Food Revenue (USD Million) And CAGR (%) By Type (2021-2032)
Table 8 Global Dehydrated Food Revenue (USD Million) And CAGR (%) By Application (2021-2032)
Table 9 Global Dehydrated Food Revenue (USD Million) And CAGR (%) By Product (2021-2032)
Table 10 Global Dehydrated Food Market Revenue (USD Million) By Regions (2021-2032)
Table 11 Global Dehydrated Food Market Share (%) By Regions (2021-2032)
Table 12 North America Dehydrated Food Revenue (USD Million) By Country (2021-2032)
Table 13 Europe Dehydrated Food Revenue (USD Million) By Country (2021-2032)
Table 14 Asia Pacific Dehydrated Food Revenue (USD Million) By Country (2021-2032)
Table 15 South America Dehydrated Food Revenue (USD Million) By Country (2021-2032)
Table 16 Middle East and Africa Dehydrated Food Revenue (USD Million) By Region (2021-2032)
Table 17 North America Dehydrated Food Revenue (USD Million) By Type (2021-2032)
Table 18 North America Dehydrated Food Revenue (USD Million) By Application (2021-2032)
Table 19 North America Dehydrated Food Revenue (USD Million) By Product (2021-2032)
Table 20 Europe Dehydrated Food Revenue (USD Million) By Type (2021-2032)
Table 21 Europe Dehydrated Food Revenue (USD Million) By Application (2021-2032)
Table 22 Europe Dehydrated Food Revenue (USD Million) By Product (2021-2032)
Table 23 Asia Pacific Dehydrated Food Revenue (USD Million) By Type (2021-2032)
Table 24 Asia Pacific Dehydrated Food Revenue (USD Million) By Application (2021-2032)
Table 25 Asia Pacific Dehydrated Food Revenue (USD Million) By Product (2021-2032)
Table 26 South America Dehydrated Food Revenue (USD Million) By Type (2021-2032)
Table 27 South America Dehydrated Food Revenue (USD Million) By Application (2021-2032)
Table 28 South America Dehydrated Food Revenue (USD Million) By Product (2021-2032)
Table 29 Middle East and Africa Dehydrated Food Revenue (USD Million) By Type (2021-2032)
Table 30 Middle East and Africa Dehydrated Food Revenue (USD Million) By Application (2021-2032)
Table 31 Middle East and Africa Dehydrated Food Revenue (USD Million) By Product (2021-2032)
LIST OF FIGURES
Figure 1. Market Scope
Figure 2. Pricing Forecasts Per Unit, 2023- 2032
Figure 3. Porter’s Five Forces
Figure 4. Global Dehydrated Food Market Revenue (USD Million) By Regions (2021-2032)
Figure 5. Global Dehydrated Food Market Share (%) By Regions (2023)
Figure 6. North America Dehydrated Food Revenue (USD Million) By Country (2021-2032)
Figure 7. United States Dehydrated Food Revenue (USD Million) By Country (2021-2032)
Figure 8. Canada Dehydrated Food Revenue (USD Million) By Country (2021-2032)
Figure 9. Mexico Dehydrated Food Revenue (USD Million) By Country (2021-2032)
Figure 10. Europe Dehydrated Food Revenue (USD Million) By Country (2021-2032)
Figure 11. Germany Dehydrated Food Revenue (USD Million) By Country (2021-2032)
Figure 12. France Dehydrated Food Revenue (USD Million) By Country (2021-2032)
Figure 13. United Kingdom Dehydrated Food Revenue (USD Million) By Country (2021-2032)
Figure 14. Spain Dehydrated Food Revenue (USD Million) By Country (2021-2032)
Figure 15. Italy Dehydrated Food Revenue (USD Million) By Country (2021-2032)
Figure 16. Russia Dehydrated Food Revenue (USD Million) By Country (2021-2032)
Figure 17. Rest of Europe Dehydrated Food Revenue (USD Million) By Country (2021-2032)
Figure 11. Asia Pacific Dehydrated Food Revenue (USD Million) By Country (2021-2032)
Figure 12. China Dehydrated Food Revenue (USD Million) By Country (2021-2032)
Figure 13. Japan Dehydrated Food Revenue (USD Million) By Country (2021-2032)
Figure 14. India Dehydrated Food Revenue (USD Million) By Country (2021-2032)
Figure 15. South Korea Dehydrated Food Revenue (USD Million) By Country (2021-2032)
Figure 16. Australia Dehydrated Food Revenue (USD Million) By Country (2021-2032)
Figure 17. South East Asia Dehydrated Food Revenue (USD Million) By Country (2021-2032)
Figure 18. South America Dehydrated Food Revenue (USD Million) By Country (2021-2032)
Figure 19. Brazil Dehydrated Food Revenue (USD Million) By Country (2021-2032)
Figure 20. Argentina Dehydrated Food Revenue (USD Million) By Country (2021-2032)
Figure 21. Rest of Asia Pacific Dehydrated Food Revenue (USD Million) By Country (2021-2032)
Figure 22. Middle East and Africa Dehydrated Food Revenue (USD Million) By Region (2021-2032)
Figure 23. Saudi Arabia Dehydrated Food Revenue (USD Million) By Region (2021-2032)
Figure 24. The UAE Dehydrated Food Revenue (USD Million) By Region (2021-2032)
Figure 25. Rest of Middle East Dehydrated Food Revenue (USD Million) By Region (2021-2032)
Figure 26. South Africa Dehydrated Food Revenue (USD Million) By Region (2021-2032)
Figure 27. Africa Dehydrated Food Revenue (USD Million) By Region (2021-2032)
Figure 28. North America Dehydrated Food Revenue (USD Million) By Type (2021-2032)
Figure 29. North America Dehydrated Food Revenue (USD Million) By Application (2021-2032)
Figure 30. North America Dehydrated Food Revenue (USD Million) By Product (2021-2032)
Figure 31. Europe Dehydrated Food Revenue (USD Million) By Type (2021-2032)
Figure 32. Europe Dehydrated Food Revenue (USD Million) By Application (2021-2032)
Figure 33. Europe Dehydrated Food Revenue (USD Million) By Product (2021-2032)
Figure 34. Asia Pacific Dehydrated Food Revenue (USD Million) By Type (2021-2032)
Figure 35. Asia Pacific Dehydrated Food Revenue (USD Million) By Application (2021-2032)
Figure 36. Asia Pacific Dehydrated Food Revenue (USD Million) By Product (2021-2032)
Figure 37. South America Dehydrated Food Revenue (USD Million) By Type (2021-2032)
Figure 38. South America Dehydrated Food Revenue (USD Million) By Application (2021-2032)
Figure 39. South America Dehydrated Food Revenue (USD Million) By Product (2021-2032)
Figure 40. Middle East and Africa Dehydrated Food Revenue (USD Million) By Type (2021-2032)
Figure 41. Middle East and Africa Dehydrated Food Revenue (USD Million) By Application (2021-2032)
Figure 42. Middle East and Africa Dehydrated Food Revenue (USD Million) By Product (2021-2032)
By Type
Spray-dried
Freeze-dried
Vacuum-dried
Drum-dried
Others
By Product
Dried Processed Food
Dried Fruit & Vegetable
Dried Dairy
Dried Meat & Seafood
Others
By Distribution Channel
Hypermarket/Supermarket
Convenience Stores
Online Retailing
Others
Countries Analyzed
North America (US, Canada, Mexico)
Europe (Germany, UK, France, Spain, Italy, Russia, Rest of Europe)
Asia Pacific (China, India, Japan, South Korea, Australia, South East Asia, Rest of Asia)
South America (Brazil, Argentina, Rest of South America)
Middle East and Africa (Saudi Arabia, UAE, Rest of Middle East, South Africa, Egypt, Rest of Africa)
