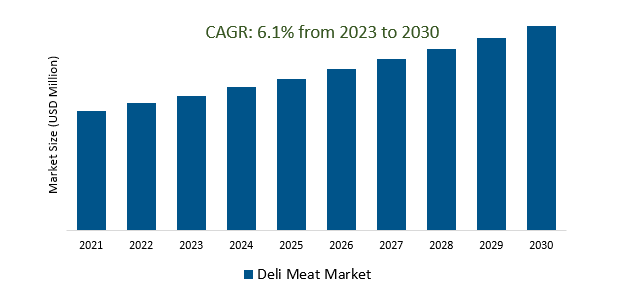
The Deli Meat Market Size is estimated to register 6.1% growth over the forecast period from 2023 to 2030.
Deli Meat Market Overview
Consumer preferences for convenient, ready-to-eat food options and the increasing demand for protein-rich diets are key factors driving the market. Deli meats offer convenience and versatility, serving as quick meal solutions for consumers with busy lifestyles. Health-conscious consumers seeking low-fat or healthier options are driving innovation in the Deli Meat market, leading to the development of leaner and healthier meat choices. Producers were exploring diverse flavour profiles and ethnic varieties to cater to consumers' evolving tastes. Single-serve packaging and pre-sliced deli meats facilitated on-the-go consumption, aligning with busy lifestyles and the demand for portable snack options are propelling the demand. Additionally, Brands are emphasizing transparent labeling, clean ingredients, and ethical sourcing aimed to build consumer trust and loyalty. Further, the growing prominence of e-commerce and online retail channels are facilitating the accessibility of deli meats to consumers.
Deli Meat Market Dynamics
Market Trends- The Deli Meat Market witnesses a surge in plant-based alternatives, reflecting a growing consumer demand for meat-free options.
Factors such as health consciousness, environmental concerns, and ethical considerations are the prime factors.
Manufacturers within the market are innovating and introducing a variety of plant-based deli meat alternatives made from ingredients like soy, pea protein, seitan, and mushrooms.
Products crafted to mimic the taste, texture, and appearance of traditional deli meats, offering consumers familiar options without animal-derived ingredients are fueling the market.
Market Driver- Health and wellness preferences drive consumer choices in the Deli Meat Market.
Reduced sodium content, lower fat levels, and fewer artificial additives aligning with health-conscious consumer habits are increasing the market.
Manufacturers are innovating to meet these preferences by developing deli meat products that cater to health and wellness concerns, emphasizing nutritional value and reduced processing.
Leaner meat options and products free from preservatives, responding to the growing interest in healthier eating habits are fueling the market demand.
Market Opportunity- Shift Towards Convenience and Snackable Offerings in the Deli Meat Market.
The rising demand for convenient, ready-to-eat options and easily accessible snacks acts as a significant driver influencing product innovation and market growth.
This inclination toward convenience are leading manufacturers to develop pre-sliced, portion-controlled, and easily portable deli meat products, aligning with the consumer demand for quick and hassle-free options.
Further, the surge in single-serve packaging and snack-sized portions addresses the need for individualized servings, catering to the growing preference for convenient, grab-and-go snacks are fostering the demand.
Market Share Analysis- Chicken will register the fastest growth
The Deli Meat Market is analyzed across Beef, Pork, Chicken, and Others. Chicken is poised to register the fastest growth. Recognized for its versatility and perceived health benefits, chicken has emerged as a favoured choice among consumers seeking lighter and leaner meat options. Its lower fat content and reputation as a healthier protein source compared to beef or pork have contributed to its popularity. Within the Deli Meat market, chicken finds extensive use in various products, including sliced deli meats for sandwiches, salads, wraps, and charcuterie boards. Additionally, flavoured or seasoned chicken deli meats cater to diverse taste preferences, appealing to consumers seeking different culinary experiences. The convenience factor also plays a role, with pre-sliced, ready-to-eat chicken deli meats catering to the on-the-go snacking and meal solution needs of consumers. This widespread use and consumer preference for chicken within the Deli Meat market indicate its enduring significance as a sought-after and versatile protein option.
Market Share Analysis- Uncured meat held a significant market share in 2023
The Deli Meat Market is analyzed across various product types including Cured meat and Uncured meat. Of these, Uncured meat held a significant market share in 2023. Uncured meats, unlike their cured counterparts, are processed without synthetic nitrates or nitrites, additives commonly used in the curing process. This distinction appeals to consumers seeking deli meat options perceived as more natural or minimally processed. The appeal of uncured meats lies in their positioning as a potentially healthier choice, attracting individuals cautious about additives and their potential health effects. These products often rely on natural alternatives like celery juice, which contains naturally occurring nitrates, to achieve a similar preservation effect without synthetic additives. Uncured deli meats cater to a niche market segment of health-focused consumers who prioritize transparency in food labeling and seek products perceived as cleaner or less processed. This segment's growth reflects changing consumer preferences toward more natural, additive-free options and signifies the market's responsiveness to evolving dietary trends
Deli Meat Market News
Prime Roots Launches Plant-Based Deli Meat in New York City.
Pescafresh Introduces Unique Chicken Deli Meats in RTE-RTC Range SaSH22.
Deli-Licious by Monde Nissin Introduces Plant-Based Sliced Deli Range in Coles Supermarkets Nationwide.
Deli Meat Market Segmentation
By source
By Product type
By Sales channel
- Hypermarkets/Supermarkets
- Specialty stores
- Convenience stores
- Online channels
- Others
By Region
- North America (United States, Canada, Mexico)
- Europe (Germany, France, United Kingdom, Spain, Italy, Others)
- Asia Pacific (China, India, Japan, South Korea, Australia, Others)
- Latin America (Brazil, Argentina, Others)
- Middle East and Africa (Saudi Arabia, UAE, Kuwait, Other Middle East, South Africa, Nigeria, Other Africa)
Deli Meat Market Companies
- Boars Head Brand
- BRF SA
- Cargill Inc
- Conagra Brands Inc
- CrisTim Group
- Dutch Valley Meats
- Evans Meats and Seafood Inc
- Hormel Foods Corp
- JBS SA
- Maple Leaf Foods Inc
- Nestle SA
- Pocino Foods Co
- Samworth Brothers Ltd
- Seaboard Corp
- Sierra Meat and Seafood
*List not exhaustive
Deli Meat Market Outlook 2023
1 Market Overview
1.1 Introduction to the Deli Meat Market
1.2 Scope of the Study
1.3 Research Objective
1.3.1 Key Market Scope and Segments
1.3.2 Players Covered
1.3.3 Years Considered
2 Executive Summary
2.1 2023 Deli Meat Industry- Market Statistics
3 Market Dynamics
3.1 Market Drivers
3.2 Market Challenges
3.3 Market Opportunities
3.4 Market Trends
4 Market Factor Analysis
4.1 Porter’s Five Forces
4.2 Market Entropy
4.2.1 Global Deli Meat Market Companies with Area Served
4.2.2 Products Offerings Global Deli Meat Market
5 COVID-19 Impact Analysis and Outlook Scenarios
5.1.1 Covid-19 Impact Analysis
5.1.2 post-COVID-19 Scenario- Low Growth Case
5.1.3 Post-COVID-19 Scenario- Reference Growth Case
5.1.4 Post-COVID-19 Scenario- Low Growth Case
6 Global Deli Meat Market Trends
6.1 Global Deli Meat Revenue (USD Million) and CAGR (%) by Type (2018-2030)
6.2 Global Deli Meat Revenue (USD Million) and CAGR (%) by Applications (2018-2030)
6.3 Global Deli Meat Revenue (USD Million) and CAGR (%) by Regions (2018-2030)
7 Global Deli Meat Market Revenue (USD Million) by Type, and Applications (2018-2022)
7.1 Global Deli Meat Revenue (USD Million) by Type (2018-2022)
7.1.1 Global Deli Meat Revenue (USD Million), Market Share (%) by Type (2018-2022)
7.2 Global Deli Meat Revenue (USD Million) by Applications (2018-2022)
7.2.1 Global Deli Meat Revenue (USD Million), Market Share (%) by Applications (2018-2022)
8 Global Deli Meat Development Regional Status and Outlook
8.1 Global Deli Meat Revenue (USD Million) By Regions (2018-2022)
8.2 North America Deli Meat Revenue (USD Million) by Type, and Application (2018-2022)
8.2.1 North America Deli Meat Revenue (USD Million) by Country (2018-2022)
8.2.2 North America Deli Meat Revenue (USD Million) by Type (2018-2022)
8.2.3 North America Deli Meat Revenue (USD Million) by Applications (2018-2022)
8.3 Europe Deli Meat Revenue (USD Million), by Type, and Applications (USD Million) (2018-2022)
8.3.1 Europe Deli Meat Revenue (USD Million), by Country (2018-2022)
8.3.2 Europe Deli Meat Revenue (USD Million) by Type (2018-2022)
8.3.3 Europe Deli Meat Revenue (USD Million) by Applications (2018-2022)
8.4 Asia Pacific Deli Meat Revenue (USD Million), and Revenue (USD Million) by Type, and Applications (2018-2022)
8.4.1 Asia Pacific Deli Meat Revenue (USD Million) by Country (2018-2022)
8.4.2 Asia Pacific Deli Meat Revenue (USD Million) by Type (2018-2022)
8.4.3 Asia Pacific Deli Meat Revenue (USD Million) by Applications (2018-2022)
8.5 South America Deli Meat Revenue (USD Million), by Type, and Applications (2018-2022)
8.5.1 South America Deli Meat Revenue (USD Million), by Country (2018-2022)
8.5.2 South America Deli Meat Revenue (USD Million) by Type (2018-2022)
8.5.3 South America Deli Meat Revenue (USD Million) by Applications (2018-2022)
8.6 Middle East and Africa Deli Meat Revenue (USD Million), by Type, Technology, Application, Thickness (2018-2022)
8.6.1 Middle East and Africa Deli Meat Revenue (USD Million) by Country (2018-2022)
8.6.2 Middle East and Africa Deli Meat Revenue (USD Million) by Type (2018-2022)
8.6.3 Middle East and Africa Deli Meat Revenue (USD Million) by Applications (2018-2022)
9 Company Profiles
10 Global Deli Meat Market Revenue (USD Million), by Type, and Applications (2023-2030)
10.1 Global Deli Meat Revenue (USD Million) and Market Share (%) by Type (2023-2030)
10.1.1 Global Deli Meat Revenue (USD Million), and Market Share (%) by Type (2023-2030)
10.2 Global Deli Meat Revenue (USD Million) and Market Share (%) by Applications (2023-2030)
10.2.1 Global Deli Meat Revenue (USD Million), and Market Share (%) by Applications (2023-2030)
11 Global Deli Meat Development Regional Status and Outlook Forecast
11.1 Global Deli Meat Revenue (USD Million) By Regions (2023-2030)
11.2 North America Deli Meat Revenue (USD Million) by Type, and Applications (2023-2030)
11.2.1 North America Deli Meat Revenue (USD) Million by Country (2023-2030)
11.2.2 North America Deli Meat Revenue (USD Million), by Type (2023-2030)
11.2.3 North America Deli Meat Revenue (USD Million), Market Share (%) by Applications (2023-2030)
11.3 Europe Deli Meat Revenue (USD Million), by Type, and Applications (2023-2030)
11.3.1 Europe Deli Meat Revenue (USD Million), by Country (2023-2030)
11.3.2 Europe Deli Meat Revenue (USD Million), by Type (2023-2030)
11.3.3 Europe Deli Meat Revenue (USD Million), by Applications (2023-2030)
11.4 Asia Pacific Deli Meat Revenue (USD Million) by Type, and Applications (2023-2030)
11.4.1 Asia Pacific Deli Meat Revenue (USD Million), by Country (2023-2030)
11.4.2 Asia Pacific Deli Meat Revenue (USD Million), by Type (2023-2030)
11.4.3 Asia Pacific Deli Meat Revenue (USD Million), by Applications (2023-2030)
11.5 South America Deli Meat Revenue (USD Million), by Type, and Applications (2023-2030)
11.5.1 South America Deli Meat Revenue (USD Million), by Country (2023-2030)
11.5.2 South America Deli Meat Revenue (USD Million), by Type (2023-2030)
11.5.3 South America Deli Meat Revenue (USD Million), by Applications (2023-2030)
11.6 Middle East and Africa Deli Meat Revenue (USD Million), by Type, and Applications (2023-2030)
11.6.1 Middle East and Africa Deli Meat Revenue (USD Million), by Region (2023-2030)
11.6.2 Middle East and Africa Deli Meat Revenue (USD Million), by Type (2023-2030)
11.6.3 Middle East and Africa Deli Meat Revenue (USD Million), by Applications (2023-2030)
12 Methodology and Data Sources
12.1 Methodology/Research Approach
12.1.1 Research Programs/Design
12.1.2 Market Size Estimation
12.1.3 Market Breakdown and Data Triangulation
12.2 Data Sources
12.2.1 Secondary Sources
12.2.2 Primary Sources
12.3 Disclaimer
List of Tables
Table 1 Market Segmentation Analysis
Table 2 Global Deli Meat Market Companies with Areas Served
Table 3 Products Offerings Global Deli Meat Market
Table 4 Low Growth Scenario Forecasts
Table 5 Reference Case Growth Scenario
Table 6 High Growth Case Scenario
Table 7 Global Deli Meat Revenue (USD Million) And CAGR (%) By Type (2018-2030)
Table 8 Global Deli Meat Revenue (USD Million) And CAGR (%) By Applications (2018-2030)
Table 9 Global Deli Meat Revenue (USD Million) And CAGR (%) By Regions (2018-2030)
Table 10 Global Deli Meat Revenue (USD Million) By Type (2018-2022)
Table 11 Global Deli Meat Revenue Market Share (%) By Type (2018-2022)
Table 12 Global Deli Meat Revenue (USD Million) By Applications (2018-2022)
Table 13 Global Deli Meat Revenue Market Share (%) By Applications (2018-2022)
Table 14 Global Deli Meat Market Revenue (USD Million) By Regions (2018-2022)
Table 15 Global Deli Meat Market Share (%) By Regions (2018-2022)
Table 16 North America Deli Meat Revenue (USD Million) By Country (2018-2022)
Table 17 North America Deli Meat Revenue (USD Million) By Type (2018-2022)
Table 18 North America Deli Meat Revenue (USD Million) By Applications (2018-2022)
Table 19 Europe Deli Meat Revenue (USD Million) By Country (2018-2022)
Table 20 Europe Deli Meat Revenue (USD Million) By Type (2018-2022)
Table 21 Europe Deli Meat Revenue (USD Million) By Applications (2018-2022)
Table 22 Asia Pacific Deli Meat Revenue (USD Million) By Country (2018-2022)
Table 23 Asia Pacific Deli Meat Revenue (USD Million) By Type (2018-2022)
Table 24 Asia Pacific Deli Meat Revenue (USD Million) By Applications (2018-2022)
Table 25 South America Deli Meat Revenue (USD Million) By Country (2018-2022)
Table 26 South America Deli Meat Revenue (USD Million) By Type (2018-2022)
Table 27 South America Deli Meat Revenue (USD Million) By Applications (2018-2022)
Table 28 Middle East and Africa Deli Meat Revenue (USD Million) By Region (2018-2022)
Table 29 Middle East and Africa Deli Meat Revenue (USD Million) By Type (2018-2022)
Table 30 Middle East and Africa Deli Meat Revenue (USD Million) By Applications (2018-2022)
Table 31 Financial Analysis
Table 32 Global Deli Meat Revenue (USD Million) By Type (2023-2030)
Table 33 Global Deli Meat Revenue Market Share (%) By Type (2023-2030)
Table 34 Global Deli Meat Revenue (USD Million) By Applications (2023-2030)
Table 35 Global Deli Meat Revenue Market Share (%) By Applications (2023-2030)
Table 36 Global Deli Meat Market Revenue (USD Million), And Revenue (USD Million) By Regions (2023-2030)
Table 37 North America Deli Meat Revenue (USD)By Country (2023-2030)
Table 38 North America Deli Meat Revenue (USD Million) By Type (2023-2030)
Table 39 North America Deli Meat Revenue (USD Million) By Applications (2023-2030)
Table 40 Europe Deli Meat Revenue (USD Million) By Country (2023-2030)
Table 41 Europe Deli Meat Revenue (USD Million) By Type (2023-2030)
Table 42 Europe Deli Meat Revenue (USD Million) By Applications (2023-2030)
Table 43 Asia Pacific Deli Meat Revenue (USD Million) By Country (2023-2030)
Table 44 Asia Pacific Deli Meat Revenue (USD Million) By Type (2023-2030)
Table 45 Asia Pacific Deli Meat Revenue (USD Million) By Applications (2023-2030)
Table 46 South America Deli Meat Revenue (USD Million) By Country (2023-2030)
Table 47 South America Deli Meat Revenue (USD Million) By Type (2023-2030)
Table 48 South America Deli Meat Revenue (USD Million) By Applications (2023-2030)
Table 49 Middle East and Africa Deli Meat Revenue (USD Million) By Region (2023-2030)
Table 50 Middle East and Africa Deli Meat Revenue (USD Million) By Region (2023-2030)
Table 51 Middle East and Africa Deli Meat Revenue (USD Million) By Type (2023-2030)
Table 52 Middle East and Africa Deli Meat Revenue (USD Million) By Applications (2023-2030)
Table 53 Research Programs/Design for This Report
Table 54 Key Data Information from Secondary Sources
Table 55 Key Data Information from Primary Sources
List of Figures
Figure 1 Market Scope
Figure 2 Porter’s Five Forces
Figure 3 Global Deli Meat Revenue (USD Million) By Type (2018-2022)
Figure 4 Global Deli Meat Revenue Market Share (%) By Type (2022)
Figure 5 Global Deli Meat Revenue (USD Million) By Applications (2018-2022)
Figure 6 Global Deli Meat Revenue Market Share (%) By Applications (2022)
Figure 7 Global Deli Meat Market Revenue (USD Million) By Regions (2018-2022)
Figure 8 Global Deli Meat Market Share (%) By Regions (2022)
Figure 9 North America Deli Meat Revenue (USD Million) By Country (2018-2022)
Figure 10 North America Deli Meat Revenue (USD Million) By Type (2018-2022)
Figure 11 North America Deli Meat Revenue (USD Million) By Applications (2018-2022)
Figure 12 Europe Deli Meat Revenue (USD Million) By Country (2018-2022)
Figure 13 Europe Deli Meat Revenue (USD Million) By Type (2018-2022)
Figure 14 Europe Deli Meat Revenue (USD Million) By Applications (2018-2022)
Figure 15 Asia Pacific Deli Meat Revenue (USD Million) By Country (2018-2022)
Figure 16 Asia Pacific Deli Meat Revenue (USD Million) By Type (2018-2022)
Figure 17 Asia Pacific Deli Meat Revenue (USD Million) By Applications (2018-2022)
Figure 18 South America Deli Meat Revenue (USD Million) By Country (2018-2022)
Figure 19 South America Deli Meat Revenue (USD Million) By Type (2018-2022)
Figure 20 South America Deli Meat Revenue (USD Million) By Applications (2018-2022)
Figure 21 Middle East and Africa Deli Meat Revenue (USD Million) By Region (2018-2022)
Figure 22 Middle East and Africa Deli Meat Revenue (USD Million) By Type (2018-2022)
Figure 23 Middle East and Africa Deli Meat Revenue (USD Million) By Applications (2018-2022)
Figure 24 Global Deli Meat Revenue (USD Million) By Type (2023-2030)
Figure 25 Global Deli Meat Revenue Market Share (%) By Type (2030)
Figure 26 Global Deli Meat Revenue (USD Million) By Applications (2023-2030)
Figure 27 Global Deli Meat Revenue Market Share (%) By Applications (2030)
Figure 28 Global Deli Meat Market Revenue (USD Million) By Regions (2023-2030)
Figure 29 North America Deli Meat Revenue (USD Million) By Country (2023-2030)
Figure 30 North America Deli Meat Revenue (USD Million) By Type (2023-2030)
Figure 31 North America Deli Meat Revenue (USD Million) By Applications (2023-2030)
Figure 32 Europe Deli Meat Revenue (USD Million) By Country (2023-2030)
Figure 33 Europe Deli Meat Revenue (USD Million) By Type (2023-2030)
Figure 34 Europe Deli Meat Revenue (USD Million) By Applications (2023-2030)
Figure 35 Asia Pacific Deli Meat Revenue (USD Million) By Country (2023-2030)
Figure 36 Asia Pacific Deli Meat Revenue (USD Million) By Type (2023-2030)
Figure 37 Asia Pacific Deli Meat Revenue (USD Million) By Applications (2023-2030)
Figure 38 South America Deli Meat Revenue (USD Million) By Country (2023-2030)
Figure 39 South America Deli Meat Revenue (USD Million) By Type (2023-2030)
Figure 40 South America Deli Meat Revenue (USD Million) By Applications (2023-2030)
Figure 41 Middle East and Africa Deli Meat Revenue (USD Million) By Region (2023-2030)
Figure 42 Middle East and Africa Deli Meat Revenue (USD Million) By Region (2023-2030)
Figure 43 Middle East and Africa Deli Meat Revenue (USD Million) By Type (2023-2030)
Figure 44 Middle East and Africa Deli Meat Revenue (USD Million) By Applications (2023-2030)
Figure 45 Bottom-Up and Top-Down Approaches For This Report
Figure 46 Data Triangulation
