Dental Bone Graft Substitutes and Other Biomaterials Market Outlook 2023
1 Market Overview
1.1 Introduction to the Dental Bone Graft Substitutes and Other Biomaterials Market
1.2 Scope of the Study
1.3 Research Objective
1.3.1 Key Market Scope and Segments
1.3.2 Players Covered
1.3.3 Years Considered
2 Executive Summary
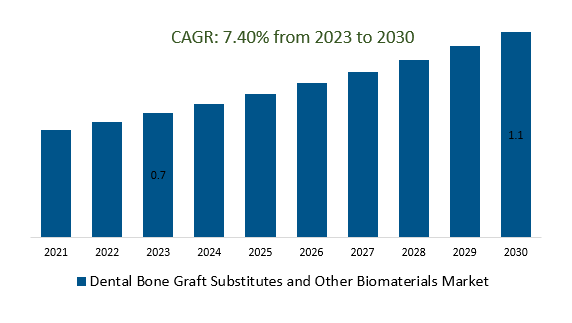
2.1 2023 Dental Bone Graft Substitutes and Other Biomaterials Industry- Market Statistics
3 Market Dynamics
3.1 Market Drivers
3.2 Market Challenges
3.3 Market Opportunities
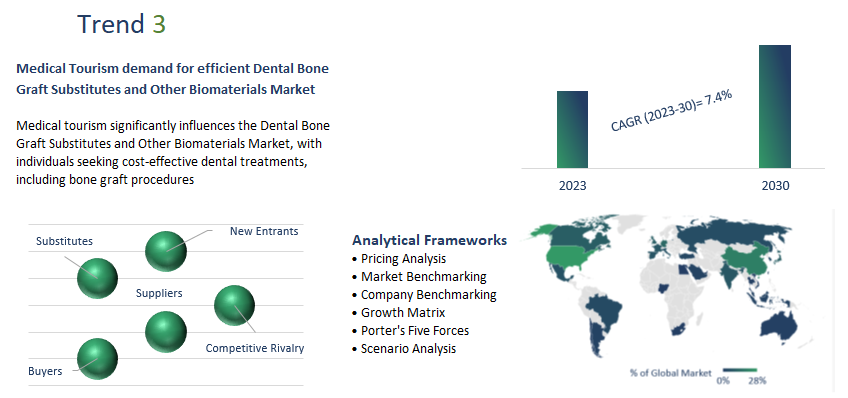
3.4 Market Trends
4 Market Factor Analysis
4.1 Porter’s Five Forces
4.2 Market Entropy
4.2.1 Global Dental Bone Graft Substitutes and Other Biomaterials Market Companies with Area Served
4.2.2 Products Offerings Global Dental Bone Graft Substitutes and Other Biomaterials Market
5 COVID-19 Impact Analysis and Outlook Scenarios
5.1.1 Covid-19 Impact Analysis
5.1.2 Post-COVID-19 Scenario- Low Growth Case
5.1.3 Post-COVID-19 Scenario- Reference Growth Case
5.1.4 Post-COVID-19 Scenario- Low Growth Case
6 Global Dental Bone Graft Substitutes and Other Biomaterials Market Trends
6.1 Global Dental Bone Graft Substitutes and Other Biomaterials Revenue (USD Million) and CAGR (%) by Type (2018-2030)
6.2 Global Dental Bone Graft Substitutes and Other Biomaterials Revenue (USD Million) and CAGR (%) by Applications (2018-2030)
6.3 Global Dental Bone Graft Substitutes and Other Biomaterials Revenue (USD Million) and CAGR (%) by Regions (2018-2030)
7 Global Dental Bone Graft Substitutes and Other Biomaterials Market Revenue (USD Million) by Type, and Applications (2018-2022)
7.1 Global Dental Bone Graft Substitutes and Other Biomaterials Revenue (USD Million) by Type (2018-2022)
7.1.1 Global Dental Bone Graft Substitutes and Other Biomaterials Revenue (USD Million), Market Share (%) by Type (2018-2022)
7.2 Global Dental Bone Graft Substitutes and Other Biomaterials Revenue (USD Million) by Applications (2018-2022)
7.2.1 Global Dental Bone Graft Substitutes and Other Biomaterials Revenue (USD Million), Market Share (%) by Applications (2018-2022)
8 Global Dental Bone Graft Substitutes and Other Biomaterials Development Regional Status and Outlook
8.1 Global Dental Bone Graft Substitutes and Other Biomaterials Revenue (USD Million) By Regions (2018-2022)
8.2 North America Dental Bone Graft Substitutes and Other Biomaterials Revenue (USD Million) by Type, and Application (2018-2022)
8.2.1 North America Dental Bone Graft Substitutes and Other Biomaterials Revenue (USD Million) by Country (2018-2022)
8.2.2 North America Dental Bone Graft Substitutes and Other Biomaterials Revenue (USD Million) by Type (2018-2022)
8.2.3 North America Dental Bone Graft Substitutes and Other Biomaterials Revenue (USD Million) by Applications (2018-2022)
8.3 Europe Dental Bone Graft Substitutes and Other Biomaterials Revenue (USD Million), by Type, and Applications (USD Million) (2018-2022)
8.3.1 Europe Dental Bone Graft Substitutes and Other Biomaterials Revenue (USD Million), by Country (2018-2022)
8.3.2 Europe Dental Bone Graft Substitutes and Other Biomaterials Revenue (USD Million) by Type (2018-2022)
8.3.3 Europe Dental Bone Graft Substitutes and Other Biomaterials Revenue (USD Million) by Applications (2018-2022)
8.4 Asia Pacific Dental Bone Graft Substitutes and Other Biomaterials Revenue (USD Million), and Revenue (USD Million) by Type, and Applications (2018-2022)
8.4.1 Asia Pacific Dental Bone Graft Substitutes and Other Biomaterials Revenue (USD Million) by Country (2018-2022)
8.4.2 Asia Pacific Dental Bone Graft Substitutes and Other Biomaterials Revenue (USD Million) by Type (2018-2022)
8.4.3 Asia Pacific Dental Bone Graft Substitutes and Other Biomaterials Revenue (USD Million) by Applications (2018-2022)
8.5 South America Dental Bone Graft Substitutes and Other Biomaterials Revenue (USD Million), by Type, and Applications (2018-2022)
8.5.1 South America Dental Bone Graft Substitutes and Other Biomaterials Revenue (USD Million), by Country (2018-2022)
8.5.2 South America Dental Bone Graft Substitutes and Other Biomaterials Revenue (USD Million) by Type (2018-2022)
8.5.3 South America Dental Bone Graft Substitutes and Other Biomaterials Revenue (USD Million) by Applications (2018-2022)
8.6 Middle East and Africa Dental Bone Graft Substitutes and Other Biomaterials Revenue (USD Million), by Type, Technology, Application, Thickness (2018-2022)
8.6.1 Middle East and Africa Dental Bone Graft Substitutes and Other Biomaterials Revenue (USD Million) by Country (2018-2022)
8.6.2 Middle East and Africa Dental Bone Graft Substitutes and Other Biomaterials Revenue (USD Million) by Type (2018-2022)
8.6.3 Middle East and Africa Dental Bone Graft Substitutes and Other Biomaterials Revenue (USD Million) by Applications (2018-2022)
9 Company Profiles
10 Global Dental Bone Graft Substitutes and Other Biomaterials Market Revenue (USD Million), by Type, and Applications (2023-2030)
10.1 Global Dental Bone Graft Substitutes and Other Biomaterials Revenue (USD Million) and Market Share (%) by Type (2023-2030)
10.1.1 Global Dental Bone Graft Substitutes and Other Biomaterials Revenue (USD Million), and Market Share (%) by Type (2023-2030)
10.2 Global Dental Bone Graft Substitutes and Other Biomaterials Revenue (USD Million) and Market Share (%) by Applications (2023-2030)
10.2.1 Global Dental Bone Graft Substitutes and Other Biomaterials Revenue (USD Million), and Market Share (%) by Applications (2023-2030)
11 Global Dental Bone Graft Substitutes and Other Biomaterials Development Regional Status and Outlook Forecast
11.1 Global Dental Bone Graft Substitutes and Other Biomaterials Revenue (USD Million) By Regions (2023-2030)
11.2 North America Dental Bone Graft Substitutes and Other Biomaterials Revenue (USD Million) by Type, and Applications (2023-2030)
11.2.1 North America Dental Bone Graft Substitutes and Other Biomaterials Revenue (USD) Million by Country (2023-2030)
11.2.2 North America Dental Bone Graft Substitutes and Other Biomaterials Revenue (USD Million), by Type (2023-2030)
11.2.3 North America Dental Bone Graft Substitutes and Other Biomaterials Revenue (USD Million), Market Share (%) by Applications (2023-2030)
11.3 Europe Dental Bone Graft Substitutes and Other Biomaterials Revenue (USD Million), by Type, and Applications (2023-2030)
11.3.1 Europe Dental Bone Graft Substitutes and Other Biomaterials Revenue (USD Million), by Country (2023-2030)
11.3.2 Europe Dental Bone Graft Substitutes and Other Biomaterials Revenue (USD Million), by Type (2023-2030)
11.3.3 Europe Dental Bone Graft Substitutes and Other Biomaterials Revenue (USD Million), by Applications (2023-2030)
11.4 Asia Pacific Dental Bone Graft Substitutes and Other Biomaterials Revenue (USD Million) by Type, and Applications (2023-2030)
11.4.1 Asia Pacific Dental Bone Graft Substitutes and Other Biomaterials Revenue (USD Million), by Country (2023-2030)
11.4.2 Asia Pacific Dental Bone Graft Substitutes and Other Biomaterials Revenue (USD Million), by Type (2023-2030)
11.4.3 Asia Pacific Dental Bone Graft Substitutes and Other Biomaterials Revenue (USD Million), by Applications (2023-2030)
11.5 South America Dental Bone Graft Substitutes and Other Biomaterials Revenue (USD Million), by Type, and Applications (2023-2030)
11.5.1 South America Dental Bone Graft Substitutes and Other Biomaterials Revenue (USD Million), by Country (2023-2030)
11.5.2 South America Dental Bone Graft Substitutes and Other Biomaterials Revenue (USD Million), by Type (2023-2030)
11.5.3 South America Dental Bone Graft Substitutes and Other Biomaterials Revenue (USD Million), by Applications (2023-2030)
11.6 Middle East and Africa Dental Bone Graft Substitutes and Other Biomaterials Revenue (USD Million), by Type, and Applications (2023-2030)
11.6.1 Middle East and Africa Dental Bone Graft Substitutes and Other Biomaterials Revenue (USD Million), by Region (2023-2030)
11.6.2 Middle East and Africa Dental Bone Graft Substitutes and Other Biomaterials Revenue (USD Million), by Type (2023-2030)
11.6.3 Middle East and Africa Dental Bone Graft Substitutes and Other Biomaterials Revenue (USD Million), by Applications (2023-2030)
12 Methodology and Data Sources
12.1 Methodology/Research Approach
12.1.1 Research Programs/Design
12.1.2 Market Size Estimation
12.1.3 Market Breakdown and Data Triangulation
12.2 Data Sources
12.2.1 Secondary Sources
12.2.2 Primary Sources
12.3 Disclaimer
List Of Tables
Table 1 Market Segmentation Analysis
Table 2 Global Dental Bone Graft Substitutes and Other Biomaterials Market Companies with Areas Served
Table 3 Products Offerings Global Dental Bone Graft Substitutes and Other Biomaterials Market
Table 4 Low Growth Scenario Forecasts
Table 5 Reference Case Growth Scenario
Table 6 High Growth Case Scenario
Table 7 Global Dental Bone Graft Substitutes and Other Biomaterials Revenue (USD Million) And CAGR (%) By Type (2018-2030)
Table 8 Global Dental Bone Graft Substitutes and Other Biomaterials Revenue (USD Million) And CAGR (%) By Applications (2018-2030)
Table 9 Global Dental Bone Graft Substitutes and Other Biomaterials Revenue (USD Million) And CAGR (%) By Regions (2018-2030)
Table 10 Global Dental Bone Graft Substitutes and Other Biomaterials Revenue (USD Million) By Type (2018-2022)
Table 11 Global Dental Bone Graft Substitutes and Other Biomaterials Revenue Market Share (%) By Type (2018-2022)
Table 12 Global Dental Bone Graft Substitutes and Other Biomaterials Revenue (USD Million) By Applications (2018-2022)
Table 13 Global Dental Bone Graft Substitutes and Other Biomaterials Revenue Market Share (%) By Applications (2018-2022)
Table 14 Global Dental Bone Graft Substitutes and Other Biomaterials Market Revenue (USD Million) By Regions (2018-2022)
Table 15 Global Dental Bone Graft Substitutes and Other Biomaterials Market Share (%) By Regions (2018-2022)
Table 16 North America Dental Bone Graft Substitutes and Other Biomaterials Revenue (USD Million) By Country (2018-2022)
Table 17 North America Dental Bone Graft Substitutes and Other Biomaterials Revenue (USD Million) By Type (2018-2022)
Table 18 North America Dental Bone Graft Substitutes and Other Biomaterials Revenue (USD Million) By Applications (2018-2022)
Table 19 Europe Dental Bone Graft Substitutes and Other Biomaterials Revenue (USD Million) By Country (2018-2022)
Table 20 Europe Dental Bone Graft Substitutes and Other Biomaterials Revenue (USD Million) By Type (2018-2022)
Table 21 Europe Dental Bone Graft Substitutes and Other Biomaterials Revenue (USD Million) By Applications (2018-2022)
Table 22 Asia Pacific Dental Bone Graft Substitutes and Other Biomaterials Revenue (USD Million) By Country (2018-2022)
Table 23 Asia Pacific Dental Bone Graft Substitutes and Other Biomaterials Revenue (USD Million) By Type (2018-2022)
Table 24 Asia Pacific Dental Bone Graft Substitutes and Other Biomaterials Revenue (USD Million) By Applications (2018-2022)
Table 25 South America Dental Bone Graft Substitutes and Other Biomaterials Revenue (USD Million) By Country (2018-2022)
Table 26 South America Dental Bone Graft Substitutes and Other Biomaterials Revenue (USD Million) By Type (2018-2022)
Table 27 South America Dental Bone Graft Substitutes and Other Biomaterials Revenue (USD Million) By Applications (2018-2022)
Table 28 Middle East and Africa Dental Bone Graft Substitutes and Other Biomaterials Revenue (USD Million) By Region (2018-2022)
Table 29 Middle East and Africa Dental Bone Graft Substitutes and Other Biomaterials Revenue (USD Million) By Type (2018-2022)
Table 30 Middle East and Africa Dental Bone Graft Substitutes and Other Biomaterials Revenue (USD Million) By Applications (2018-2022)
Table 31 Financial Analysis
Table 32 Global Dental Bone Graft Substitutes and Other Biomaterials Revenue (USD Million) By Type (2023-2030)
Table 33 Global Dental Bone Graft Substitutes and Other Biomaterials Revenue Market Share (%) By Type (2023-2030)
Table 34 Global Dental Bone Graft Substitutes and Other Biomaterials Revenue (USD Million) By Applications (2023-2030)
Table 35 Global Dental Bone Graft Substitutes and Other Biomaterials Revenue Market Share (%) By Applications (2023-2030)
Table 36 Global Dental Bone Graft Substitutes and Other Biomaterials Market Revenue (USD Million), And Revenue (USD Million) By Regions (2023-2030)
Table 37 North America Dental Bone Graft Substitutes and Other Biomaterials Revenue (USD)By Country (2023-2030)
Table 38 North America Dental Bone Graft Substitutes and Other Biomaterials Revenue (USD Million) By Type (2023-2030)
Table 39 North America Dental Bone Graft Substitutes and Other Biomaterials Revenue (USD Million) By Applications (2023-2030)
Table 40 Europe Dental Bone Graft Substitutes and Other Biomaterials Revenue (USD Million) By Country (2023-2030)
Table 41 Europe Dental Bone Graft Substitutes and Other Biomaterials Revenue (USD Million) By Type (2023-2030)
Table 42 Europe Dental Bone Graft Substitutes and Other Biomaterials Revenue (USD Million) By Applications (2023-2030)
Table 43 Asia Pacific Dental Bone Graft Substitutes and Other Biomaterials Revenue (USD Million) By Country (2023-2030)
Table 44 Asia Pacific Dental Bone Graft Substitutes and Other Biomaterials Revenue (USD Million) By Type (2023-2030)
Table 45 Asia Pacific Dental Bone Graft Substitutes and Other Biomaterials Revenue (USD Million) By Applications (2023-2030)
Table 46 South America Dental Bone Graft Substitutes and Other Biomaterials Revenue (USD Million) By Country (2023-2030)
Table 47 South America Dental Bone Graft Substitutes and Other Biomaterials Revenue (USD Million) By Type (2023-2030)
Table 48 South America Dental Bone Graft Substitutes and Other Biomaterials Revenue (USD Million) By Applications (2023-2030)
Table 49 Middle East and Africa Dental Bone Graft Substitutes and Other Biomaterials Revenue (USD Million) By Region (2023-2030)
Table 50 Middle East and Africa Dental Bone Graft Substitutes and Other Biomaterials Revenue (USD Million) By Region (2023-2030)
Table 51 Middle East and Africa Dental Bone Graft Substitutes and Other Biomaterials Revenue (USD Million) By Type (2023-2030)
Table 52 Middle East and Africa Dental Bone Graft Substitutes and Other Biomaterials Revenue (USD Million) By Applications (2023-2030)
Table 53 Research Programs/Design for This Report
Table 54 Key Data Information from Secondary Sources
Table 55 Key Data Information from Primary Sources
List Of Figures
Figure 1 Market Scope
Figure 2 Porter’s Five Forces
Figure 3 Global Dental Bone Graft Substitutes and Other Biomaterials Revenue (USD Million) By Type (2018-2022)
Figure 4 Global Dental Bone Graft Substitutes and Other Biomaterials Revenue Market Share (%) By Type (2022)
Figure 5 Global Dental Bone Graft Substitutes and Other Biomaterials Revenue (USD Million) By Applications (2018-2022)
Figure 6 Global Dental Bone Graft Substitutes and Other Biomaterials Revenue Market Share (%) By Applications (2022)
Figure 7 Global Dental Bone Graft Substitutes and Other Biomaterials Market Revenue (USD Million) By Regions (2018-2022)
Figure 8 Global Dental Bone Graft Substitutes and Other Biomaterials Market Share (%) By Regions (2022)
Figure 9 North America Dental Bone Graft Substitutes and Other Biomaterials Revenue (USD Million) By Country (2018-2022)
Figure 10 North America Dental Bone Graft Substitutes and Other Biomaterials Revenue (USD Million) By Type (2018-2022)
Figure 11 North America Dental Bone Graft Substitutes and Other Biomaterials Revenue (USD Million) By Applications (2018-2022)
Figure 12 Europe Dental Bone Graft Substitutes and Other Biomaterials Revenue (USD Million) By Country (2018-2022)
Figure 13 Europe Dental Bone Graft Substitutes and Other Biomaterials Revenue (USD Million) By Type (2018-2022)
Figure 14 Europe Dental Bone Graft Substitutes and Other Biomaterials Revenue (USD Million) By Applications (2018-2022)
Figure 15 Asia Pacific Dental Bone Graft Substitutes and Other Biomaterials Revenue (USD Million) By Country (2018-2022)
Figure 16 Asia Pacific Dental Bone Graft Substitutes and Other Biomaterials Revenue (USD Million) By Type (2018-2022)
Figure 17 Asia Pacific Dental Bone Graft Substitutes and Other Biomaterials Revenue (USD Million) By Applications (2018-2022)
Figure 18 South America Dental Bone Graft Substitutes and Other Biomaterials Revenue (USD Million) By Country (2018-2022)
Figure 19 South America Dental Bone Graft Substitutes and Other Biomaterials Revenue (USD Million) By Type (2018-2022)
Figure 20 South America Dental Bone Graft Substitutes and Other Biomaterials Revenue (USD Million) By Applications (2018-2022)
Figure 21 Middle East and Africa Dental Bone Graft Substitutes and Other Biomaterials Revenue (USD Million) By Region (2018-2022)
Figure 22 Middle East and Africa Dental Bone Graft Substitutes and Other Biomaterials Revenue (USD Million) By Type (2018-2022)
Figure 23 Middle East and Africa Dental Bone Graft Substitutes and Other Biomaterials Revenue (USD Million) By Applications (2018-2022)
Figure 24 Global Dental Bone Graft Substitutes and Other Biomaterials Revenue (USD Million) By Type (2023-2030)
Figure 25 Global Dental Bone Graft Substitutes and Other Biomaterials Revenue Market Share (%) By Type (2030)
Figure 26 Global Dental Bone Graft Substitutes and Other Biomaterials Revenue (USD Million) By Applications (2023-2030)
Figure 27 Global Dental Bone Graft Substitutes and Other Biomaterials Revenue Market Share (%) By Applications (2030)
Figure 28 Global Dental Bone Graft Substitutes and Other Biomaterials Market Revenue (USD Million) By Regions (2023-2030)
Figure 29 North America Dental Bone Graft Substitutes and Other Biomaterials Revenue (USD Million) By Country (2023-2030)
Figure 30 North America Dental Bone Graft Substitutes and Other Biomaterials Revenue (USD Million) By Type (2023-2030)
Figure 31 North America Dental Bone Graft Substitutes and Other Biomaterials Revenue (USD Million) By Applications (2023-2030)
Figure 32 Europe Dental Bone Graft Substitutes and Other Biomaterials Revenue (USD Million) By Country (2023-2030)
Figure 33 Europe Dental Bone Graft Substitutes and Other Biomaterials Revenue (USD Million) By Type (2023-2030)
Figure 34 Europe Dental Bone Graft Substitutes and Other Biomaterials Revenue (USD Million) By Applications (2023-2030)
Figure 35 Asia Pacific Dental Bone Graft Substitutes and Other Biomaterials Revenue (USD Million) By Country (2023-2030)
Figure 36 Asia Pacific Dental Bone Graft Substitutes and Other Biomaterials Revenue (USD Million) By Type (2023-2030)
Figure 37 Asia Pacific Dental Bone Graft Substitutes and Other Biomaterials Revenue (USD Million) By Applications (2023-2030)
Figure 38 South America Dental Bone Graft Substitutes and Other Biomaterials Revenue (USD Million) By Country (2023-2030)
Figure 39 South America Dental Bone Graft Substitutes and Other Biomaterials Revenue (USD Million) By Type (2023-2030)
Figure 40 South America Dental Bone Graft Substitutes and Other Biomaterials Revenue (USD Million) By Applications (2023-2030)
Figure 41 Middle East and Africa Dental Bone Graft Substitutes and Other Biomaterials Revenue (USD Million) By Region (2023-2030)
Figure 42 Middle East and Africa Dental Bone Graft Substitutes and Other Biomaterials Revenue (USD Million) By Region (2023-2030)
Figure 43 Middle East and Africa Dental Bone Graft Substitutes and Other Biomaterials Revenue (USD Million) By Type (2023-2030)
Figure 44 Middle East and Africa Dental Bone Graft Substitutes and Other Biomaterials Revenue (USD Million) By Applications (2023-2030)
Figure 45 Bottom-Up and Top-Down Approaches For This Report
Figure 46 Data Triangulation