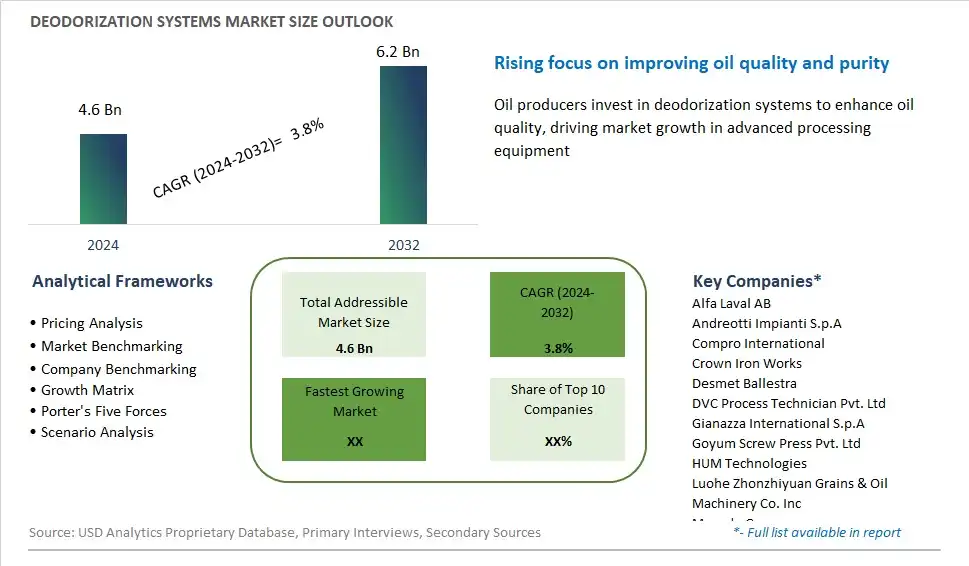
Global Deodorization Systems Market Size is valued at $4.6 Billion in 2024 and is forecast to register a growth rate (CAGR) of 3.8% to reach $6.2 Billion by 2032.
The global Deodorization Systems Market Comprehensive Study analyzes and forecasts the market size across 6 regions and 24 countries for diverse segments -By Technology (Packed Column, Thin Film), By Refining (Chemical Refining, Physical Refining), By Cooking Oil (Palm Oil, Sunflower Oil, Soybean Oil, Olive Oil, Peanut Oil, Coconut Oil, Mustard Seed Oil, and Others)
An Introduction to Deodorization Systems Market
Deodorization systems are essential equipment used in the refining of edible oils to remove unwanted odors, flavors, and impurities in 2024. During the oil refining process, various compounds such as free fatty acids, volatile organic compounds, and oxidation products can contribute to off-flavors and aromas, affecting the sensory quality and shelf stability of the final product. Deodorization systems employ steam distillation or vacuum stripping techniques to remove these undesirable compounds, resulting in refined oils with neutral taste, odor, and color characteristics suitable for a wide range of culinary and food processing applications. With advancements in deodorization technology, such as multi-stage distillation, molecular distillation, and solvent extraction, manufacturers can achieve precise control over the deodorization process to meet product specifications and regulatory requirements. Whether refining vegetable oils for cooking, frying, or salad dressing applications, deodorization systems play a critical role in enhancing the sensory attributes and consumer acceptance of edible oils. As consumer demand for clean-label, minimally processed foods grows, the market for deodorization systems is expected to expand, driven by investments in equipment upgrades, process optimization, and sustainability initiatives that improve efficiency, quality, and environmental performance.
Deodorization Systems Competitive Landscape
The market report analyses the leading companies in the industry including Alfa Laval AB, Andreotti Impianti S.p.A, Compro International, Crown Iron Works, Desmet Ballestra, DVC Process Technician Pvt. Ltd, Gianazza International S.p.A, Goyum Screw Press Pvt. Ltd, HUM Technologies, Luohe Zhonzhiyuan Grains & Oil Machinery Co. Inc, Myande Group, Zhengzhou Sunshine Machinery Co. Inc, and Others.
Deodorization Systems Market Dynamics
Deodorization Systems Market Trend: Shift Towards Sustainable and Eco-Friendly Solutions
One prominent trend in the deodorization systems market is the shift towards sustainable and eco-friendly solutions. With increasing awareness of environmental concerns and the need to reduce carbon footprint, industries are seeking deodorization systems that employ green technologies and processes. This trend is driven by regulatory mandates, corporate sustainability goals, and consumer preferences for environmentally responsible products. Manufacturers of deodorization systems are responding by developing innovative technologies that minimize energy consumption, emissions, and waste generation during the deodorization process. Additionally, there's a growing demand for bio-based deodorization agents and renewable energy sources to power these systems, further contributing to sustainability efforts. As industries across various sectors prioritize environmental stewardship, the adoption of sustainable deodorization systems is expected to continue growing, presenting opportunities for manufacturers to innovate and capture market share with eco-friendly solutions.
Market Driver: Stringent Environmental Regulations and Odor Control Mandates
A key driver propelling the growth of the deodorization systems market is the implementation of stringent environmental regulations and odor control mandates across industries. Governments and regulatory bodies worldwide are enacting laws and guidelines to address air pollution, odor nuisance, and emissions from industrial activities. This driver is fueled by concerns about public health, community well-being, and environmental impact associated with odorous emissions from manufacturing facilities, wastewater treatment plants, landfills, and agricultural operations. As a result, industries are required to invest in effective odor control measures, including the installation of advanced deodorization systems, to mitigate the release of odorous compounds into the atmosphere. Deodorization system manufacturers are capitalizing on this driver by offering innovative technologies, such as activated carbon filters, chemical scrubbers, biological treatment systems, and thermal oxidation units, that efficiently capture and neutralize odors from various sources. By providing compliant solutions that meet regulatory requirements for odor abatement, manufacturers can address the growing demand for effective odor control solutions and expand their market presence.
Market Opportunity: Integration of IoT and Smart Monitoring Technologies
An opportunity within the deodorization systems market lies in the integration of Internet of Things (IoT) and smart monitoring technologies to enhance system performance, efficiency, and maintenance. As industries strive for operational excellence and cost optimization, there's a growing demand for deodorization systems that offer real-time monitoring, data analytics, and predictive maintenance capabilities. IoT-enabled sensors and connectivity solutions can provide valuable insights into system parameters, such as airflow rates, chemical dosages, temperature, and odor levels, allowing operators to optimize system performance and energy efficiency. Additionally, smart monitoring technologies enable remote monitoring and control of deodorization systems, facilitating proactive maintenance, troubleshooting, and fault detection to minimize downtime and operational disruptions. By leveraging IoT and smart monitoring solutions, deodorization system manufacturers can differentiate their offerings, improve customer satisfaction, and capture new market opportunities in industries where odor control is a critical concern.
Deodorization Systems Market Share Analysis: Packed Column held the dominant market share in 2024
In the Deodorization Systems Market segmented by technology, the packed column segment is the largest, driven by several pivotal factors. Packed column technology is widely adopted in the deodorization process for its efficiency, versatility, and reliability in removing unwanted odors and flavors from oils and fats. This technology involves the use of structured or random packing materials within a column to facilitate the separation of volatile compounds from the oil or fat matrix through mass transfer processes. Packed column systems offer high throughput capacities, allowing for continuous processing of large volumes of oils and fats, which is essential for industrial-scale applications. Further, packed column technology enables precise control over process parameters, such as temperature, pressure, and residence time, to optimize deodorization efficiency and product quality. Additionally, packed column systems are known for their robustness and ease of operation, requiring minimal maintenance and downtime. Furthermore, advancements in packing materials and column design have further enhanced the performance and efficiency of packed column deodorization systems, driving their widespread adoption across the food processing, edible oil refining, and oleochemical industries. As a result, the packed column segment stands as the largest in the Deodorization Systems Market, poised for continued growth as manufacturers seek reliable and cost-effective solutions to meet the increasing demand for high-quality deodorized oils and fats.
Deodorization Systems Market Share Analysis: Physical Refining market is poised to register the fastest growth rae over the forecast period to 2032
In the Deodorization Systems Market segmented by refining method, the physical refining segment is the fastest-growing, driven by several transformative factors. Physical refining, also known as steam distillation or steam stripping, is gaining traction due to its advantages over chemical refining in terms of product quality, environmental sustainability, and cost-effectiveness. Physical refining involves the use of steam to remove volatile impurities and free fatty acids from crude oils, resulting in a purer and higher-quality refined oil product. This method eliminates the need for chemical additives, such as caustic soda and phosphoric acid, reducing the risk of chemical residues in the final product and minimizing environmental impact. Further, physical refining preserves the natural flavors, colors, and nutritional attributes of oils, making it particularly suitable for premium and specialty oil products catering to health-conscious consumers. Additionally, advancements in physical refining technology, such as improved steam distillation processes and enhanced equipment designs, have contributed to higher efficiency and throughput rates, driving its adoption by oil refining facilities worldwide. Furthermore, the growing consumer demand for clean-label and minimally processed food products further fuels the preference for physical refining methods in the food processing industry. As a result, the physical refining segment stands as the fastest-growing in the Deodorization Systems Market, poised for continued expansion as manufacturers prioritize sustainable and high-quality oil refining solutions to meet evolving market demands.
Deodorization Systems Market Share Analysis: Palm Oil held the dominant market share in 2024
In the Deodorization Systems Market segmented by cooking oil type, the palm oil segment is the largest, driven by several pivotal factors. Palm oil is one of the most widely consumed and traded vegetable oils globally, finding extensive application in various food products, including cooking oils, margarine, bakery goods, and processed foods. The high demand for palm oil is attributed to its unique combination of attributes, including its low cost of production, high yield per hectare, and versatile functionality in food processing. Additionally, palm oil possesses desirable characteristics such as stability at high temperatures, resistance to oxidation, and a neutral flavor profile, making it a preferred choice for frying and cooking applications in both commercial and household settings. Further, palm oil is favored by food manufacturers for its ability to impart texture, mouthfeel, and shelf stability to a wide range of food products. Furthermore, the widespread availability of palm oil and its derivatives, coupled with its cost competitiveness compared to other cooking oils, contribute to its dominance in the Deodorization Systems Market. As a result, the palm oil segment stands as the largest, poised for sustained growth as the demand for cooking oils continues to rise globally, particularly in emerging economies experiencing rapid urbanization and dietary shifts.
Deodorization Systems Market Segmentation
By Technology
Packed Column
Thin Film
By Refining
Chemical Refining
Physical Refining
By Cooking Oil
Palm Oil
Sunflower Oil
Soybean Oil
Olive Oil
Peanut Oil
Coconut Oil
Mustard Seed Oil
Others
Countries Analyzed
North America (US, Canada, Mexico)
Europe (Germany, UK, France, Spain, Italy, Russia, Rest of Europe)
Asia Pacific (China, India, Japan, South Korea, Australia, South East Asia, Rest of Asia)
South America (Brazil, Argentina, Rest of South America)
Middle East and Africa (Saudi Arabia, UAE, Rest of Middle East, South Africa, Egypt, Rest of Africa)
Deodorization Systems Companies Profiled in the Study
Alfa Laval AB
Andreotti Impianti S.p.A
Compro International
Crown Iron Works
Desmet Ballestra
DVC Process Technician Pvt. Ltd
Gianazza International S.p.A
Goyum Screw Press Pvt. Ltd
HUM Technologies
Luohe Zhonzhiyuan Grains & Oil Machinery Co. Inc
Myande Group
Zhengzhou Sunshine Machinery Co. Inc
*- List Not Exhaustive
Chapter 1. TABLE OF CONTENTS
Chapter 2. Introduction to Deodorization Systems Market
2.1. Market Overview
2.2. Key Statistics and Report Highlights
2.3. Scope of the Comprehensive Study
2.3.1. Market Definition
2.3.2 Countries and Regions Covered
2.3.3 Research Objective
2.3.4 Units, Currency, and Conversions
2.3.5 Industry Value Chain
2.4. Key Market Segments
2.5. Key Companies
2.6. Study Period
Chapter 3. Strategic Analysis Review
3.1. Deodorization Systems Pricing Analysis and Forecast
3.2. Porter’s Five Forces
3.3. Market Ecosystem
3.4. SWOT Analysis
3.5. Regulatory Scenario
3.3. Effects of Inflation, Russia-Ukraine War, moderating economic growth, and other macroeconomic factors
Chapter 4. Competitive Landscape
4.1. Market Share Analysis
4.1.1. Global Deodorization Systems Market Share by Company, 2023
4.1.2. Product Offerings of Leading Deodorization Systems Companies
4.2. Market Entropy
4.2.1. New Product Launches in the Industry
4.2.2. Mergers, Acquisitions, Joint ventures, and Partnerships
4.3. Key Strategies and Best Practices
Chapter 5. Global Market Projections: Best, Reference, and Low Case Scenarios
5.1. Growth Analysis- Case Scenario Definitions
5.2. Low Growth Case Scenario Forecasts
5.3. Reference Growth Case Scenario Forecasts
5.4. High Growth Case Scenario Forecasts
Chapter 6. Market Dynamics
6.1. Deodorization Systems Market Drivers
6.2. Deodorization Systems Market Challenges
6.6. Deodorization Systems Market Opportunities
6.4. Deodorization Systems Market Trends
Chapter 7. Global Deodorization Systems Market Outlook Trends
7.1. Global Deodorization Systems Revenue (USD Million) and CAGR (%) by Type (2021-2032)
7.2. Global Deodorization Systems Revenue (USD Million) and CAGR (%) by Application (2021-2032)
7.3. Global Deodorization Systems Revenue (USD Million) and CAGR (%) by Product (2021-2032)
By Technology
Packed Column
Thin Film
By Refining
Chemical Refining
Physical Refining
By Cooking Oil
Palm Oil
Sunflower Oil
Soybean Oil
Olive Oil
Peanut Oil
Coconut Oil
Mustard Seed Oil
Others
Chapter 8. Global Deodorization Systems Regional Analysis and Outlook
8.1. Global Deodorization Systems Revenue (USD Million) By Regions (2021- 2032)
8.2. North America Deodorization Systems Revenue (USD Million) by Country (2021-2032)
8.2.1. United States Deodorization Systems Regional Analysis and Outlook
8.2.2. Canada Deodorization Systems Regional Analysis and Outlook
8.2.3. Mexico Deodorization Systems Regional Analysis and Outlook
8.3. Europe Deodorization Systems Revenue (USD Million), by Country (2021-2032)
8.3.1. Germany Deodorization Systems Regional Analysis and Outlook
8.3.2. France Deodorization Systems Regional Analysis and Outlook
8.3.3. United Kingdom Deodorization Systems Regional Analysis and Outlook
8.3.4. Spain Deodorization Systems Regional Analysis and Outlook
8.3.5. Italy Deodorization Systems Regional Analysis and Outlook
8.3.6. Russia Deodorization Systems Regional Analysis and Outlook
8.3.7. Rest of Europe Deodorization Systems Regional Analysis and Outlook
8.4. Asia Pacific Deodorization Systems Revenue (USD Million) by Country (2021-2032)
8.4.1. China Deodorization Systems Regional Analysis and Outlook
8.4.2. Japan Deodorization Systems Regional Analysis and Outlook
8.4.3. India Deodorization Systems Regional Analysis and Outlook
8.4.4. South Korea Deodorization Systems Regional Analysis and Outlook
8.4.5. Australia Deodorization Systems Regional Analysis and Outlook
8.4.6. South East Asia Deodorization Systems Regional Analysis and Outlook
8.4.7. Rest of Asia Pacific Deodorization Systems Regional Analysis and Outlook
8.5. South America Deodorization Systems Revenue (USD Million), by Country (2021-2032)
8.5.1. Brazil Deodorization Systems Regional Analysis and Outlook
8.5.2. Argentina Deodorization Systems Regional Analysis and Outlook
8.5.3. Rest of South America Deodorization Systems Regional Analysis and Outlook
8.6. Middle East and Africa Deodorization Systems Revenue (USD Million) by Country (2021-2032)
8.6.1. Middle East Deodorization Systems Regional Analysis and Outlook
8.6.2. Africa Deodorization Systems Regional Analysis and Outlook
Chapter 9. North America Deodorization Systems Analysis and Outlook
9.1. North America Deodorization Systems Revenue (USD Million) by Segments (2021-2032)
9.1.1. North America Deodorization Systems Revenue (USD Million) by Type (2021-2032)
9.1.2. North America Deodorization Systems Revenue (USD Million) by Application (2021-2032)
9.1.3. North America Deodorization Systems Revenue (USD Million) by Product (2021-2032)
By Technology
Packed Column
Thin Film
By Refining
Chemical Refining
Physical Refining
By Cooking Oil
Palm Oil
Sunflower Oil
Soybean Oil
Olive Oil
Peanut Oil
Coconut Oil
Mustard Seed Oil
Others
Chapter 10. Europe Deodorization Systems Analysis and Outlook
10.1. Europe Deodorization Systems Revenue (USD Million), by Segments (USD Million) (2021-2032)
10.1.1. Europe Deodorization Systems Revenue (USD Million) by Type (2021-2032)
10.1.2. Europe Deodorization Systems Revenue (USD Million) by Application (2021-2032)
10.1.3. Europe Deodorization Systems Revenue (USD Million) by Product (2021-2032)
By Technology
Packed Column
Thin Film
By Refining
Chemical Refining
Physical Refining
By Cooking Oil
Palm Oil
Sunflower Oil
Soybean Oil
Olive Oil
Peanut Oil
Coconut Oil
Mustard Seed Oil
Others
Chapter 11. Asia Pacific Deodorization Systems Analysis and Outlook
11.1. Asia Pacific Deodorization Systems Revenue (USD Million), and Revenue (USD Million) by Segments (2021-2032)
11.1.1. Asia Pacific Deodorization Systems Revenue (USD Million) by Type (2021-2032)
11.1.2. Asia Pacific Deodorization Systems Revenue (USD Million) by Application (2021-2032)
11.1.3. Asia Pacific Deodorization Systems Revenue (USD Million) by Product (2021-2032)
By Technology
Packed Column
Thin Film
By Refining
Chemical Refining
Physical Refining
By Cooking Oil
Palm Oil
Sunflower Oil
Soybean Oil
Olive Oil
Peanut Oil
Coconut Oil
Mustard Seed Oil
Others
Chapter 12. South America Deodorization Systems Analysis and Outlook
12.1. South America Deodorization Systems Revenue (USD Million), by Segments (2021-2032)
12.1.1. South America Deodorization Systems Revenue (USD Million) by Type (2021-2032)
12.1.2. South America Deodorization Systems Revenue (USD Million) by Application (2021-2032)
12.1.3. South America Deodorization Systems Revenue (USD Million) by Product (2021-2032)
By Technology
Packed Column
Thin Film
By Refining
Chemical Refining
Physical Refining
By Cooking Oil
Palm Oil
Sunflower Oil
Soybean Oil
Olive Oil
Peanut Oil
Coconut Oil
Mustard Seed Oil
Others
Chapter 13. Middle East and Africa Deodorization Systems Analysis and Outlook
13.1. Middle East and Africa Deodorization Systems Revenue (USD Million), by Segments (2021-2032)
13.1.1. Middle East and Africa Deodorization Systems Revenue (USD Million) by Type (2021-2032)
13.1.2. Middle East and Africa Deodorization Systems Revenue (USD Million) by Application (2021-2032)
13.1.3. Middle East and Africa Deodorization Systems Revenue (USD Million) by Product (2021-2032)
By Technology
Packed Column
Thin Film
By Refining
Chemical Refining
Physical Refining
By Cooking Oil
Palm Oil
Sunflower Oil
Soybean Oil
Olive Oil
Peanut Oil
Coconut Oil
Mustard Seed Oil
Others
Chapter 14. Deodorization Systems Company Profiles
14.1 Business Overview
14.2 Product Profiles
14.3 SWOT Profiles
14.5 Recent Developments
14.6 Financial Profile
List of Companies
Alfa Laval AB
Andreotti Impianti S.p.A
Compro International
Crown Iron Works
Desmet Ballestra
DVC Process Technician Pvt. Ltd
Gianazza International S.p.A
Goyum Screw Press Pvt. Ltd
HUM Technologies
Luohe Zhonzhiyuan Grains & Oil Machinery Co. Inc
Myande Group
Zhengzhou Sunshine Machinery Co. Inc
15. Methodology and Data Sources
15.1 Customization Offerings
15.2 Subscription Services
15.3 Related Reports
15.4 Publisher Expertise
LIST OF TABLES
Table 1 Market Segmentation Analysis
Table 2 Global Deodorization Systems Market Share of Leading Companies, 2023
Table 3 Product Offerings of Leading Companies
Table 4 Low Growth Scenario Forecasts
Table 5 Reference Case Growth Scenario
Table 6 High Growth Case Scenario
Table 7 Global Deodorization Systems Revenue (USD Million) And CAGR (%) By Type (2021-2032)
Table 8 Global Deodorization Systems Revenue (USD Million) And CAGR (%) By Application (2021-2032)
Table 9 Global Deodorization Systems Revenue (USD Million) And CAGR (%) By Product (2021-2032)
Table 10 Global Deodorization Systems Market Revenue (USD Million) By Regions (2021-2032)
Table 11 Global Deodorization Systems Market Share (%) By Regions (2021-2032)
Table 12 North America Deodorization Systems Revenue (USD Million) By Country (2021-2032)
Table 13 Europe Deodorization Systems Revenue (USD Million) By Country (2021-2032)
Table 14 Asia Pacific Deodorization Systems Revenue (USD Million) By Country (2021-2032)
Table 15 South America Deodorization Systems Revenue (USD Million) By Country (2021-2032)
Table 16 Middle East and Africa Deodorization Systems Revenue (USD Million) By Region (2021-2032)
Table 17 North America Deodorization Systems Revenue (USD Million) By Type (2021-2032)
Table 18 North America Deodorization Systems Revenue (USD Million) By Application (2021-2032)
Table 19 North America Deodorization Systems Revenue (USD Million) By Product (2021-2032)
Table 20 Europe Deodorization Systems Revenue (USD Million) By Type (2021-2032)
Table 21 Europe Deodorization Systems Revenue (USD Million) By Application (2021-2032)
Table 22 Europe Deodorization Systems Revenue (USD Million) By Product (2021-2032)
Table 23 Asia Pacific Deodorization Systems Revenue (USD Million) By Type (2021-2032)
Table 24 Asia Pacific Deodorization Systems Revenue (USD Million) By Application (2021-2032)
Table 25 Asia Pacific Deodorization Systems Revenue (USD Million) By Product (2021-2032)
Table 26 South America Deodorization Systems Revenue (USD Million) By Type (2021-2032)
Table 27 South America Deodorization Systems Revenue (USD Million) By Application (2021-2032)
Table 28 South America Deodorization Systems Revenue (USD Million) By Product (2021-2032)
Table 29 Middle East and Africa Deodorization Systems Revenue (USD Million) By Type (2021-2032)
Table 30 Middle East and Africa Deodorization Systems Revenue (USD Million) By Application (2021-2032)
Table 31 Middle East and Africa Deodorization Systems Revenue (USD Million) By Product (2021-2032)
LIST OF FIGURES
Figure 1. Market Scope
Figure 2. Pricing Forecasts Per Unit, 2023- 2032
Figure 3. Porter’s Five Forces
Figure 4. Global Deodorization Systems Market Revenue (USD Million) By Regions (2021-2032)
Figure 5. Global Deodorization Systems Market Share (%) By Regions (2023)
Figure 6. North America Deodorization Systems Revenue (USD Million) By Country (2021-2032)
Figure 7. United States Deodorization Systems Revenue (USD Million) By Country (2021-2032)
Figure 8. Canada Deodorization Systems Revenue (USD Million) By Country (2021-2032)
Figure 9. Mexico Deodorization Systems Revenue (USD Million) By Country (2021-2032)
Figure 10. Europe Deodorization Systems Revenue (USD Million) By Country (2021-2032)
Figure 11. Germany Deodorization Systems Revenue (USD Million) By Country (2021-2032)
Figure 12. France Deodorization Systems Revenue (USD Million) By Country (2021-2032)
Figure 13. United Kingdom Deodorization Systems Revenue (USD Million) By Country (2021-2032)
Figure 14. Spain Deodorization Systems Revenue (USD Million) By Country (2021-2032)
Figure 15. Italy Deodorization Systems Revenue (USD Million) By Country (2021-2032)
Figure 16. Russia Deodorization Systems Revenue (USD Million) By Country (2021-2032)
Figure 17. Rest of Europe Deodorization Systems Revenue (USD Million) By Country (2021-2032)
Figure 11. Asia Pacific Deodorization Systems Revenue (USD Million) By Country (2021-2032)
Figure 12. China Deodorization Systems Revenue (USD Million) By Country (2021-2032)
Figure 13. Japan Deodorization Systems Revenue (USD Million) By Country (2021-2032)
Figure 14. India Deodorization Systems Revenue (USD Million) By Country (2021-2032)
Figure 15. South Korea Deodorization Systems Revenue (USD Million) By Country (2021-2032)
Figure 16. Australia Deodorization Systems Revenue (USD Million) By Country (2021-2032)
Figure 17. South East Asia Deodorization Systems Revenue (USD Million) By Country (2021-2032)
Figure 18. South America Deodorization Systems Revenue (USD Million) By Country (2021-2032)
Figure 19. Brazil Deodorization Systems Revenue (USD Million) By Country (2021-2032)
Figure 20. Argentina Deodorization Systems Revenue (USD Million) By Country (2021-2032)
Figure 21. Rest of Asia Pacific Deodorization Systems Revenue (USD Million) By Country (2021-2032)
Figure 22. Middle East and Africa Deodorization Systems Revenue (USD Million) By Region (2021-2032)
Figure 23. Saudi Arabia Deodorization Systems Revenue (USD Million) By Region (2021-2032)
Figure 24. The UAE Deodorization Systems Revenue (USD Million) By Region (2021-2032)
Figure 25. Rest of Middle East Deodorization Systems Revenue (USD Million) By Region (2021-2032)
Figure 26. South Africa Deodorization Systems Revenue (USD Million) By Region (2021-2032)
Figure 27. Africa Deodorization Systems Revenue (USD Million) By Region (2021-2032)
Figure 28. North America Deodorization Systems Revenue (USD Million) By Type (2021-2032)
Figure 29. North America Deodorization Systems Revenue (USD Million) By Application (2021-2032)
Figure 30. North America Deodorization Systems Revenue (USD Million) By Product (2021-2032)
Figure 31. Europe Deodorization Systems Revenue (USD Million) By Type (2021-2032)
Figure 32. Europe Deodorization Systems Revenue (USD Million) By Application (2021-2032)
Figure 33. Europe Deodorization Systems Revenue (USD Million) By Product (2021-2032)
Figure 34. Asia Pacific Deodorization Systems Revenue (USD Million) By Type (2021-2032)
Figure 35. Asia Pacific Deodorization Systems Revenue (USD Million) By Application (2021-2032)
Figure 36. Asia Pacific Deodorization Systems Revenue (USD Million) By Product (2021-2032)
Figure 37. South America Deodorization Systems Revenue (USD Million) By Type (2021-2032)
Figure 38. South America Deodorization Systems Revenue (USD Million) By Application (2021-2032)
Figure 39. South America Deodorization Systems Revenue (USD Million) By Product (2021-2032)
Figure 40. Middle East and Africa Deodorization Systems Revenue (USD Million) By Type (2021-2032)
Figure 41. Middle East and Africa Deodorization Systems Revenue (USD Million) By Application (2021-2032)
Figure 42. Middle East and Africa Deodorization Systems Revenue (USD Million) By Product (2021-2032)
By Technology
Packed Column
Thin Film
By Refining
Chemical Refining
Physical Refining
By Cooking Oil
Palm Oil
Sunflower Oil
Soybean Oil
Olive Oil
Peanut Oil
Coconut Oil
Mustard Seed Oil
Others
Countries Analyzed
North America (US, Canada, Mexico)
Europe (Germany, UK, France, Spain, Italy, Russia, Rest of Europe)
Asia Pacific (China, India, Japan, South Korea, Australia, South East Asia, Rest of Asia)
South America (Brazil, Argentina, Rest of South America)
Middle East and Africa (Saudi Arabia, UAE, Rest of Middle East, South Africa, Egypt, Rest of Africa)
