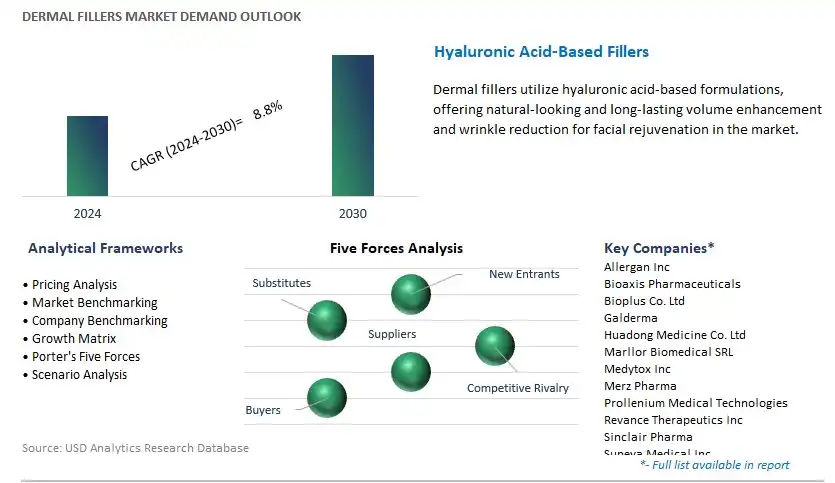
The Global Dermal Fillers Market is estimated to be US$ 6.8 Billion in 2023. It is poised to register 8.8% growth over the forecast period from 2023 to 2030 to reach US $ 11.8 billion 2030.
The market growth is driven by the increasing importance of proper training and education for healthcare professionals offering dermal filler treatments is likely to grow, ensuring safe and effective procedures. Leading companies are focusing on Advanced Formulations, Personalization, Regulatory Changes, Innovative Delivery Techniques, Telemedicine and Teledermatology, Training and Education, and others to boost market shares in the industry.
Market Overview
The Dermal Fillers Market comprises cosmetic products used for non-surgical facial rejuvenation and augmentation. Key segments include various filler types (e.g., hyaluronic acid, collagen) with applications in wrinkle reduction and lip augmentation, serving medical professionals and cosmetic practitioners. Market growth is driven by an aging population, formulation advancements, minimal downtime, and social media influence, while challenges include regulatory compliance and competition.
Market Dynamics
Market Trends- The Growing Popularity of Medical Tourism for Dermal Fillers
The popularity of medical tourism for dermal fillers is growing due to cost savings, access to skilled practitioners, reduced wait times, and the opportunity for a combined treatment and vacation experience. However, patients should conduct thorough research on providers and safety standards in their chosen destination for a safe and positive experience.
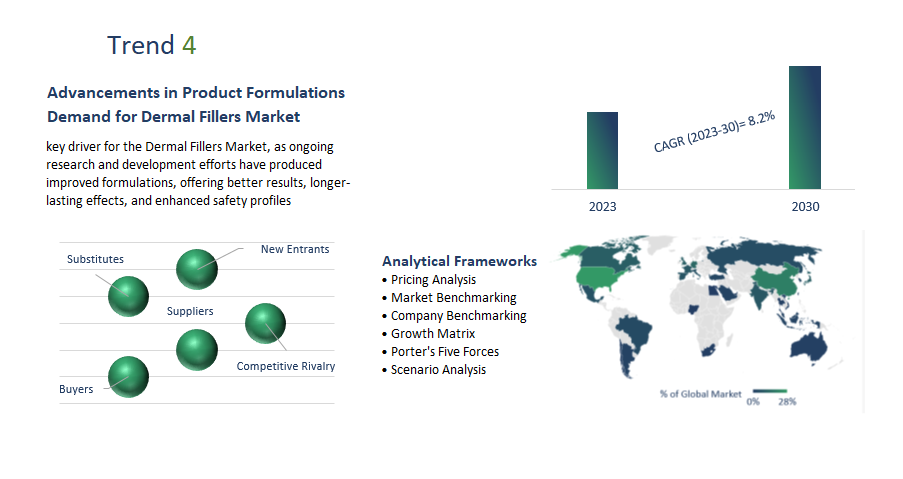
Market Driver- Advancements in Product Formulations Demand for Dermal Fillers Market
Advancements in product formulations are a key driver for the Dermal Fillers Market, as ongoing research and development efforts have produced improved formulations, offering better results, longer-lasting effects, and enhanced safety profiles, thereby increasing demand among consumers and healthcare providers.
Market Opportunity-Introduction of Technological Advancements
Technological advancements are pivotal in shaping the Dermal Fillers Market, improving injection techniques, product formulations, and delivery systems. These innovations enhance treatment effectiveness, safety, and patient satisfaction while driving market growth and innovation.
Market Share Analysis- Hyaluronic acid Dermal Fillers Market will register the fastest growth
The Global Dermal Fillers Market is analyzed across Hyaluronic acid, Calcium hydroxylapatite, Polylactic acid (PLLA), Polymethyl-methacrylate microspheres, and others. Of these, Hyaluronic acid will register the fastest growth. Hyaluronic acid is a central component of the Dermal Fillers Market, widely used in various filler products for its natural appearance, safety, and versatility in addressing facial concerns. It is commonly employed for lip augmentation, wrinkle reduction, and facial volume enhancement. The market for hyaluronic acid-based dermal fillers is expanding due to its popularity among consumers seeking non-invasive cosmetic treatments and ongoing research aimed at enhancing product formulations.
Market Share Analysis- Biodegradable held a significant market share in 2023
The Global Dermal Fillers Market is analyzed across various Types including Biodegradable, Non-biodegradable, and others. Of these, Biodegradables held a significant market share in 2023. Biodegradable dermal fillers are gaining popularity in the Dermal Fillers Market due to their gradual breakdown and absorption by the body, offering temporary cosmetic enhancements. They align with sustainability trends, appealing to eco-conscious consumers and regulatory requirements, contributing to market diversification.
Dermal Fillers Market Segmentation
By Product
- Hyaluronic acid
- Calcium hydroxylapatite
- Polylactic acid (PLLA)
- Polymethyl-methacrylate microspheres
- Others
By Type
- Biodegradable
- Non-biodegradable
By Application
- Wrinkle Correction
- Facial Contouring
- Scar Treatment
- Lip Enhancement
- Others
By End-user
- Med Spa
- Cosmetic Surgery Clinics
- Hospitals
By Region
- North America (United States, Canada, Mexico)
- Europe (Germany, France, United Kingdom, Spain, Italy, Others)
- Asia Pacific (China, India, Japan, South Korea, Australia, Others)
- Latin America (Brazil, Argentina, Others)
- Middle East and Africa (Saudi Arabia, UAE, Kuwait, Other Middle East, South Africa, Nigeria, Other Africa)
Dermal Fillers Market Companies
- Allergan Inc
- Merz Pharma
- Suneva Medical Inc
- Sinclair Pharma
- Prollenium Medical Technologies
- Galderma
- Medytox Inc
- Revance Therapeutics Inc
- Bioplus Co. Ltd
- Teoxane Laboratories.
- Huadong Medicine Co. Ltd
- Marllor Biomedical SRL
- Bio axis Pharmaceuticals
* List not exhaustive
Dermal Fillers Market Outlook 2023
1 Market Overview
1.1 Introduction to the Dermal Fillers Market
1.2 Scope of the Study
1.3 Research Objective
1.3.1 Key Market Scope and Segments
1.3.2 Players Covered
1.3.3 Years Considered
2 Executive Summary
2.1 2023 Dermal Fillers Industry- Market Statistics
3 Market Dynamics
3.1 Market Drivers
3.2 Market Challenges
3.3 Market Opportunities
3.4 Market Trends
4 Market Factor Analysis
4.1 Porter’s Five Forces
4.2 Market Entropy
4.2.1 Global Dermal Fillers Market Companies with Area Served
4.2.2 Products Offerings Global Dermal Fillers Market
5 COVID-19 Impact Analysis and Outlook Scenarios
5.1.1 Covid-19 Impact Analysis
5.1.2 Post-COVID-19 Scenario- Low Growth Case
5.1.3 Post-COVID-19 Scenario- Reference Growth Case
5.1.4 Post-COVID-19 Scenario- Low Growth Case
6 Global Dermal Fillers Market Trends
6.1 Global Dermal Fillers Revenue (USD Million) and CAGR (%) by Type (2018-2030)
6.2 Global Dermal Fillers Revenue (USD Million) and CAGR (%) by Applications (2018-2030)
6.3 Global Dermal Fillers Revenue (USD Million) and CAGR (%) by Regions (2018-2030)
7 Global Dermal Fillers Market Revenue (USD Million) by Type, and Applications (2018-2022)
7.1 Global Dermal Fillers Revenue (USD Million) by Type (2018-2022)
7.1.1 Global Dermal Fillers Revenue (USD Million), Market Share (%) by Type (2018-2022)
7.2 Global Dermal Fillers Revenue (USD Million) by Applications (2018-2022)
7.2.1 Global Dermal Fillers Revenue (USD Million), Market Share (%) by Applications (2018-2022)
8 Global Dermal Fillers Development Regional Status and Outlook
8.1 Global Dermal Fillers Revenue (USD Million) By Regions (2018-2022)
8.2 North America Dermal Fillers Revenue (USD Million) by Type, and Application (2018-2022)
8.2.1 North America Dermal Fillers Revenue (USD Million) by Country (2018-2022)
8.2.2 North America Dermal Fillers Revenue (USD Million) by Type (2018-2022)
8.2.3 North America Dermal Fillers Revenue (USD Million) by Applications (2018-2022)
8.3 Europe Dermal Fillers Revenue (USD Million), by Type, and Applications (USD Million) (2018-2022)
8.3.1 Europe Dermal Fillers Revenue (USD Million), by Country (2018-2022)
8.3.2 Europe Dermal Fillers Revenue (USD Million) by Type (2018-2022)
8.3.3 Europe Dermal Fillers Revenue (USD Million) by Applications (2018-2022)
8.4 Asia Pacific Dermal Fillers Revenue (USD Million), and Revenue (USD Million) by Type, and Applications (2018-2022)
8.4.1 Asia Pacific Dermal Fillers Revenue (USD Million) by Country (2018-2022)
8.4.2 Asia Pacific Dermal Fillers Revenue (USD Million) by Type (2018-2022)
8.4.3 Asia Pacific Dermal Fillers Revenue (USD Million) by Applications (2018-2022)
8.5 South America Dermal Fillers Revenue (USD Million), by Type, and Applications (2018-2022)
8.5.1 South America Dermal Fillers Revenue (USD Million), by Country (2018-2022)
8.5.2 South America Dermal Fillers Revenue (USD Million) by Type (2018-2022)
8.5.3 South America Dermal Fillers Revenue (USD Million) by Applications (2018-2022)
8.6 Middle East and Africa Dermal Fillers Revenue (USD Million), by Type, Technology, Application, Thickness (2018-2022)
8.6.1 Middle East and Africa Dermal Fillers Revenue (USD Million) by Country (2018-2022)
8.6.2 Middle East and Africa Dermal Fillers Revenue (USD Million) by Type (2018-2022)
8.6.3 Middle East and Africa Dermal Fillers Revenue (USD Million) by Applications (2018-2022)
9 Company Profiles
10 Global Dermal Fillers Market Revenue (USD Million), by Type, and Applications (2023-2030)
10.1 Global Dermal Fillers Revenue (USD Million) and Market Share (%) by Type (2023-2030)
10.1.1 Global Dermal Fillers Revenue (USD Million), and Market Share (%) by Type (2023-2030)
10.2 Global Dermal Fillers Revenue (USD Million) and Market Share (%) by Applications (2023-2030)
10.2.1 Global Dermal Fillers Revenue (USD Million), and Market Share (%) by Applications (2023-2030)
11 Global Dermal Fillers Development Regional Status and Outlook Forecast
11.1 Global Dermal Fillers Revenue (USD Million) By Regions (2023-2030)
11.2 North America Dermal Fillers Revenue (USD Million) by Type, and Applications (2023-2030)
11.2.1 North America Dermal Fillers Revenue (USD) Million by Country (2023-2030)
11.2.2 North America Dermal Fillers Revenue (USD Million), by Type (2023-2030)
11.2.3 North America Dermal Fillers Revenue (USD Million), Market Share (%) by Applications (2023-2030)
11.3 Europe Dermal Fillers Revenue (USD Million), by Type, and Applications (2023-2030)
11.3.1 Europe Dermal Fillers Revenue (USD Million), by Country (2023-2030)
11.3.2 Europe Dermal Fillers Revenue (USD Million), by Type (2023-2030)
11.3.3 Europe Dermal Fillers Revenue (USD Million), by Applications (2023-2030)
11.4 Asia Pacific Dermal Fillers Revenue (USD Million) by Type, and Applications (2023-2030)
11.4.1 Asia Pacific Dermal Fillers Revenue (USD Million), by Country (2023-2030)
11.4.2 Asia Pacific Dermal Fillers Revenue (USD Million), by Type (2023-2030)
11.4.3 Asia Pacific Dermal Fillers Revenue (USD Million), by Applications (2023-2030)
11.5 South America Dermal Fillers Revenue (USD Million), by Type, and Applications (2023-2030)
11.5.1 South America Dermal Fillers Revenue (USD Million), by Country (2023-2030)
11.5.2 South America Dermal Fillers Revenue (USD Million), by Type (2023-2030)
11.5.3 South America Dermal Fillers Revenue (USD Million), by Applications (2023-2030)
11.6 Middle East and Africa Dermal Fillers Revenue (USD Million), by Type, and Applications (2023-2030)
11.6.1 Middle East and Africa Dermal Fillers Revenue (USD Million), by Region (2023-2030)
11.6.2 Middle East and Africa Dermal Fillers Revenue (USD Million), by Type (2023-2030)
11.6.3 Middle East and Africa Dermal Fillers Revenue (USD Million), by Applications (2023-2030)
12 Methodology and Data Sources
12.1 Methodology/Research Approach
12.1.1 Research Programs/Design
12.1.2 Market Size Estimation
12.1.3 Market Breakdown and Data Triangulation
12.2 Data Sources
12.2.1 Secondary Sources
12.2.2 Primary Sources
12.3 Disclaimer
List of Tables
Table 1 Market Segmentation Analysis
Table 2 Global Dermal Fillers Market Companies with Areas Served
Table 3 Products Offerings Global Dermal Fillers Market
Table 4 Low Growth Scenario Forecasts
Table 5 Reference Case Growth Scenario
Table 6 High Growth Case Scenario
Table 7 Global Dermal Fillers Revenue (USD Million) And CAGR (%) By Type (2018-2030)
Table 8 Global Dermal Fillers Revenue (USD Million) And CAGR (%) By Applications (2018-2030)
Table 9 Global Dermal Fillers Revenue (USD Million) And CAGR (%) By Regions (2018-2030)
Table 10 Global Dermal Fillers Revenue (USD Million) By Type (2018-2022)
Table 11 Global Dermal Fillers Revenue Market Share (%) By Type (2018-2022)
Table 12 Global Dermal Fillers Revenue (USD Million) By Applications (2018-2022)
Table 13 Global Dermal Fillers Revenue Market Share (%) By Applications (2018-2022)
Table 14 Global Dermal Fillers Market Revenue (USD Million) By Regions (2018-2022)
Table 15 Global Dermal Fillers Market Share (%) By Regions (2018-2022)
Table 16 North America Dermal Fillers Revenue (USD Million) By Country (2018-2022)
Table 17 North America Dermal Fillers Revenue (USD Million) By Type (2018-2022)
Table 18 North America Dermal Fillers Revenue (USD Million) By Applications (2018-2022)
Table 19 Europe Dermal Fillers Revenue (USD Million) By Country (2018-2022)
Table 20 Europe Dermal Fillers Revenue (USD Million) By Type (2018-2022)
Table 21 Europe Dermal Fillers Revenue (USD Million) By Applications (2018-2022)
Table 22 Asia Pacific Dermal Fillers Revenue (USD Million) By Country (2018-2022)
Table 23 Asia Pacific Dermal Fillers Revenue (USD Million) By Type (2018-2022)
Table 24 Asia Pacific Dermal Fillers Revenue (USD Million) By Applications (2018-2022)
Table 25 South America Dermal Fillers Revenue (USD Million) By Country (2018-2022)
Table 26 South America Dermal Fillers Revenue (USD Million) By Type (2018-2022)
Table 27 South America Dermal Fillers Revenue (USD Million) By Applications (2018-2022)
Table 28 Middle East and Africa Dermal Fillers Revenue (USD Million) By Region (2018-2022)
Table 29 Middle East and Africa Dermal Fillers Revenue (USD Million) By Type (2018-2022)
Table 30 Middle East and Africa Dermal Fillers Revenue (USD Million) By Applications (2018-2022)
Table 31 Financial Analysis
Table 32 Global Dermal Fillers Revenue (USD Million) By Type (2023-2030)
Table 33 Global Dermal Fillers Revenue Market Share (%) By Type (2023-2030)
Table 34 Global Dermal Fillers Revenue (USD Million) By Applications (2023-2030)
Table 35 Global Dermal Fillers Revenue Market Share (%) By Applications (2023-2030)
Table 36 Global Dermal Fillers Market Revenue (USD Million), And Revenue (USD Million) By Regions (2023-2030)
Table 37 North America Dermal Fillers Revenue (USD)By Country (2023-2030)
Table 38 North America Dermal Fillers Revenue (USD Million) By Type (2023-2030)
Table 39 North America Dermal Fillers Revenue (USD Million) By Applications (2023-2030)
Table 40 Europe Dermal Fillers Revenue (USD Million) By Country (2023-2030)
Table 41 Europe Dermal Fillers Revenue (USD Million) By Type (2023-2030)
Table 42 Europe Dermal Fillers Revenue (USD Million) By Applications (2023-2030)
Table 43 Asia Pacific Dermal Fillers Revenue (USD Million) By Country (2023-2030)
Table 44 Asia Pacific Dermal Fillers Revenue (USD Million) By Type (2023-2030)
Table 45 Asia Pacific Dermal Fillers Revenue (USD Million) By Applications (2023-2030)
Table 46 South America Dermal Fillers Revenue (USD Million) By Country (2023-2030)
Table 47 South America Dermal Fillers Revenue (USD Million) By Type (2023-2030)
Table 48 South America Dermal Fillers Revenue (USD Million) By Applications (2023-2030)
Table 49 Middle East and Africa Dermal Fillers Revenue (USD Million) By Region (2023-2030)
Table 50 Middle East and Africa Dermal Fillers Revenue (USD Million) By Region (2023-2030)
Table 51 Middle East and Africa Dermal Fillers Revenue (USD Million) By Type (2023-2030)
Table 52 Middle East and Africa Dermal Fillers Revenue (USD Million) By Applications (2023-2030)
Table 53 Research Programs/Design for This Report
Table 54 Key Data Information from Secondary Sources
Table 55 Key Data Information from Primary Sources
List of Figures
Figure 1 Market Scope
Figure 2 Porter’s Five Forces
Figure 3 Global Dermal Fillers Revenue (USD Million) By Type (2018-2022)
Figure 4 Global Dermal Fillers Revenue Market Share (%) By Type (2022)
Figure 5 Global Dermal Fillers Revenue (USD Million) By Applications (2018-2022)
Figure 6 Global Dermal Fillers Revenue Market Share (%) By Applications (2022)
Figure 7 Global Dermal Fillers Market Revenue (USD Million) By Regions (2018-2022)
Figure 8 Global Dermal Fillers Market Share (%) By Regions (2022)
Figure 9 North America Dermal Fillers Revenue (USD Million) By Country (2018-2022)
Figure 10 North America Dermal Fillers Revenue (USD Million) By Type (2018-2022)
Figure 11 North America Dermal Fillers Revenue (USD Million) By Applications (2018-2022)
Figure 12 Europe Dermal Fillers Revenue (USD Million) By Country (2018-2022)
Figure 13 Europe Dermal Fillers Revenue (USD Million) By Type (2018-2022)
Figure 14 Europe Dermal Fillers Revenue (USD Million) By Applications (2018-2022)
Figure 15 Asia Pacific Dermal Fillers Revenue (USD Million) By Country (2018-2022)
Figure 16 Asia Pacific Dermal Fillers Revenue (USD Million) By Type (2018-2022)
Figure 17 Asia Pacific Dermal Fillers Revenue (USD Million) By Applications (2018-2022)
Figure 18 South America Dermal Fillers Revenue (USD Million) By Country (2018-2022)
Figure 19 South America Dermal Fillers Revenue (USD Million) By Type (2018-2022)
Figure 20 South America Dermal Fillers Revenue (USD Million) By Applications (2018-2022)
Figure 21 Middle East and Africa Dermal Fillers Revenue (USD Million) By Region (2018-2022)
Figure 22 Middle East and Africa Dermal Fillers Revenue (USD Million) By Type (2018-2022)
Figure 23 Middle East and Africa Dermal Fillers Revenue (USD Million) By Applications (2018-2022)
Figure 24 Global Dermal Fillers Revenue (USD Million) By Type (2023-2030)
Figure 25 Global Dermal Fillers Revenue Market Share (%) By Type (2030)
Figure 26 Global Dermal Fillers Revenue (USD Million) By Applications (2023-2030)
Figure 27 Global Dermal Fillers Revenue Market Share (%) By Applications (2030)
Figure 28 Global Dermal Fillers Market Revenue (USD Million) By Regions (2023-2030)
Figure 29 North America Dermal Fillers Revenue (USD Million) By Country (2023-2030)
Figure 30 North America Dermal Fillers Revenue (USD Million) By Type (2023-2030)
Figure 31 North America Dermal Fillers Revenue (USD Million) By Applications (2023-2030)
Figure 32 Europe Dermal Fillers Revenue (USD Million) By Country (2023-2030)
Figure 33 Europe Dermal Fillers Revenue (USD Million) By Type (2023-2030)
Figure 34 Europe Dermal Fillers Revenue (USD Million) By Applications (2023-2030)
Figure 35 Asia Pacific Dermal Fillers Revenue (USD Million) By Country (2023-2030)
Figure 36 Asia Pacific Dermal Fillers Revenue (USD Million) By Type (2023-2030)
Figure 37 Asia Pacific Dermal Fillers Revenue (USD Million) By Applications (2023-2030)
Figure 38 South America Dermal Fillers Revenue (USD Million) By Country (2023-2030)
Figure 39 South America Dermal Fillers Revenue (USD Million) By Type (2023-2030)
Figure 40 South America Dermal Fillers Revenue (USD Million) By Applications (2023-2030)
Figure 41 Middle East and Africa Dermal Fillers Revenue (USD Million) By Region (2023-2030)
Figure 42 Middle East and Africa Dermal Fillers Revenue (USD Million) By Region (2023-2030)
Figure 43 Middle East and Africa Dermal Fillers Revenue (USD Million) By Type (2023-2030)
Figure 44 Middle East and Africa Dermal Fillers Revenue (USD Million) By Applications (2023-2030)
Figure 45 Bottom-Up and Top-Down Approaches For This Report
Figure 46 Data Triangulation
