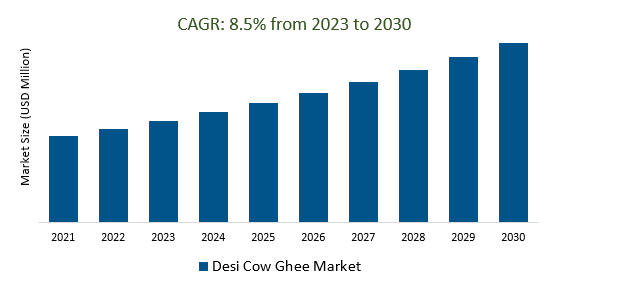
The Desi Cow Ghee Market Size is estimated to register 8.5% growth over the forecast period from 2023 to 2030.
Desi Cow Ghee Market Overview
The growing awareness and preference for natural, organic, and traditional food products are propelling the demand. Derived from indigenous cow breeds, prized for its purity, superior nutritional value, and rich aroma are the key factors. Manufacturers are diversifying their product offerings, introducing variations such as organic, grass-fed, or A2 Desi Cow Ghee. Additionally, Consumers are increasingly opting for healthier alternatives in their diets, favouring ghee sourced from indigenous cows due to its perceived health advantages over other types of fats. Further, the cultural significance of ghee in traditional Indian cuisine and Ayurvedic practices are fueling the demand. Brands are leveraging e-commerce to reach a wider audience, offering convenience and accessibility to consumers looking for authentic Desi Cow Ghee products.
Desi Cow Ghee Market Dynamics
Market Trends- Health Consciousness Fuels Surge in Desi Cow Ghee Demand.
Growing understanding and appreciation for healthier dietary choices and the nutritional benefits are increasing the market.
Businesses are emphasizing the nutritional benefits of their products, conducting educational campaigns, and highlighting the health-enhancing properties of Desi Cow Ghee in their marketing strategies.
Additionally, the heightened awareness of its nutritional profile, including its rich content of essential nutrients, vitamins, and beneficial fatty acids are positioning it as a preferred alternative to other cooking fats.
Market Driver- Surging Demand for Organic and Natural Desi Cow Ghee Products propels the market.
Consumers' concerns about additives, chemicals, and the overall quality of food consumed are bolstering the demand for organic and natural products.
Desi Cow Ghee, derived from indigenous cow breeds and produced through traditional methods, is capturing consumer attention as a natural and organic alternative to conventional cooking fats.
Businesses are showcasing the organic and natural attributes of their products through certifications, transparent sourcing, and highlighting traditional preparation methods leading to market growth.
Market Opportunity- The Desi Cow Ghee market sees a surge owing to its cultural and Ayurvedic significance.
Consumers' growing interest in heritage-based wellness practices and traditional culinary wisdom are fueling the demand.
The renewed focus on Ayurvedic principles and heritage-based wellness are sparking a resurgence in the consumption of Desi Cow Ghee, with consumers recognizing its role in promoting overall health and balance.
Additionally, Manufacturers are emphasizing its role in Ayurveda as a beneficial dietary ingredient and promoting its traditional preparation methods to resonate with consumers seeking authentic and time-tested wellness solutions.
Market Share Analysis- Organic will register the fastest growth
The Desi Cow Ghee Market is analyzed across Organic and Conventional. Organic is poised to register the fastest growth. Organic Desi Cow Ghee has gained prominence due to its perceived purity, superior nutritional profile, and alignment with consumers' desires for chemical-free and additive-free dietary options. Produced from indigenous cow breeds and processed through traditional methods without synthetic additives or pesticides, organic Desi Cow Ghee is highly regarded for its authenticity and adherence to organic farming practices. Consumers increasingly associate organic variants with better health benefits, considering them to be free from harmful residues and offering higher nutritional value compared to conventionally produced ghee. This growing demand for organic Desi Cow Ghee has led to increased product diversification and availability, with manufacturers emphasizing organic certifications, transparent sourcing, and eco-friendly production methods to meet the rising consumer expectations for organic, wholesome, and environmentally sustainable food choices.
Market Share Analysis- Household held a significant market share in 2023
The Desi Cow Ghee Market is analyzed across various applications including Household and Industrial. Of these, Household held a significant market share in 2023. Desi Cow Ghee holds deep-rooted cultural significance in Indian households, where it is an integral ingredient in culinary practices, revered for its flavor-enhancing properties, and widely used in traditional Indian cooking. Its versatility extends beyond cooking; Desi Cow Ghee is also utilized in religious ceremonies, Ayurvedic treatments, and cultural rituals, further solidifying its importance within the household setting. Known for its rich aroma, taste, and perceived health benefits, households across India incorporate Desi Cow Ghee into daily meals, considering it an essential part of their culinary heritage and wellness regimen. The segment's significance lies in its consistent demand from consumers seeking authenticity, purity, and the traditional essence that Desi Cow Ghee adds to their households' culinary and cultural traditions.
Desi Cow Ghee Market News
Sid’s Farm Unveils New Premium Cow Ghee Brand, Elevating Quality Standards.
God’s Choice Organic Farms Private Limited Introduces Premium Line of Minimally Processed Healthy Food Products.
Desi Cow Ghee Market Segmentation
By Type
By Application
By Sales Channel
- Online (E-commerce Channel, Company Website)
- Offline (Supermarket/Hypermarket, Specialty Store, Traditional Grocery Store)
By Region
- North America (United States, Canada, Mexico)
- Europe (Germany, France, United Kingdom, Spain, Italy, Others)
- Asia Pacific (China, India, Japan, South Korea, Australia, Others)
- Latin America (Brazil, Argentina, Others)
- Middle East and Africa (Saudi Arabia, UAE, Kuwait, Other Middle East, South Africa, Nigeria, Other Africa)
Desi Cow Ghee Market Companies
- Amul (India)
- Patanjali (India)
- Nestlé (Switzerland)
- Britannia Industries (India)
- Mother Dairy (India)
- Baba Ramdev's Divya Pharmacy (India)
- Organic Valley (USA)
- Naturyz (India)
- Om India Export (India)
- Govardhan (India)
*List not exhaustive
Desi Cow Ghee Market Outlook 2023
1 Market Overview
1.1 Introduction to the Desi Cow Ghee Market
1.2 Scope of the Study
1.3 Research Objective
1.3.1 Key Market Scope and Segments
1.3.2 Players Covered
1.3.3 Years Considered
2 Executive Summary
2.1 2023 Desi Cow Ghee Industry- Market Statistics
3 Market Dynamics
3.1 Market Drivers
3.2 Market Challenges
3.3 Market Opportunities
3.4 Market Trends
4 Market Factor Analysis
4.1 Porter’s Five Forces
4.2 Market Entropy
4.2.1 Global Desi Cow Ghee Market Companies with Area Served
4.2.2 Products Offerings Global Desi Cow Ghee Market
5 COVID-19 Impact Analysis and Outlook Scenarios
5.1.1 Covid-19 Impact Analysis
5.1.2 post-COVID-19 Scenario- Low Growth Case
5.1.3 Post-COVID-19 Scenario- Reference Growth Case
5.1.4 Post-COVID-19 Scenario- Low Growth Case
6 Global Desi Cow Ghee Market Trends
6.1 Global Desi Cow Ghee Revenue (USD Million) and CAGR (%) by Type (2018-2030)
6.2 Global Desi Cow Ghee Revenue (USD Million) and CAGR (%) by Applications (2018-2030)
6.3 Global Desi Cow Ghee Revenue (USD Million) and CAGR (%) by Regions (2018-2030)
7 Global Desi Cow Ghee Market Revenue (USD Million) by Type, and Applications (2018-2022)
7.1 Global Desi Cow Ghee Revenue (USD Million) by Type (2018-2022)
7.1.1 Global Desi Cow Ghee Revenue (USD Million), Market Share (%) by Type (2018-2022)
7.2 Global Desi Cow Ghee Revenue (USD Million) by Applications (2018-2022)
7.2.1 Global Desi Cow Ghee Revenue (USD Million), Market Share (%) by Applications (2018-2022)
8 Global Desi Cow Ghee Development Regional Status and Outlook
8.1 Global Desi Cow Ghee Revenue (USD Million) By Regions (2018-2022)
8.2 North America Desi Cow Ghee Revenue (USD Million) by Type, and Application (2018-2022)
8.2.1 North America Desi Cow Ghee Revenue (USD Million) by Country (2018-2022)
8.2.2 North America Desi Cow Ghee Revenue (USD Million) by Type (2018-2022)
8.2.3 North America Desi Cow Ghee Revenue (USD Million) by Applications (2018-2022)
8.3 Europe Desi Cow Ghee Revenue (USD Million), by Type, and Applications (USD Million) (2018-2022)
8.3.1 Europe Desi Cow Ghee Revenue (USD Million), by Country (2018-2022)
8.3.2 Europe Desi Cow Ghee Revenue (USD Million) by Type (2018-2022)
8.3.3 Europe Desi Cow Ghee Revenue (USD Million) by Applications (2018-2022)
8.4 Asia Pacific Desi Cow Ghee Revenue (USD Million), and Revenue (USD Million) by Type, and Applications (2018-2022)
8.4.1 Asia Pacific Desi Cow Ghee Revenue (USD Million) by Country (2018-2022)
8.4.2 Asia Pacific Desi Cow Ghee Revenue (USD Million) by Type (2018-2022)
8.4.3 Asia Pacific Desi Cow Ghee Revenue (USD Million) by Applications (2018-2022)
8.5 South America Desi Cow Ghee Revenue (USD Million), by Type, and Applications (2018-2022)
8.5.1 South America Desi Cow Ghee Revenue (USD Million), by Country (2018-2022)
8.5.2 South America Desi Cow Ghee Revenue (USD Million) by Type (2018-2022)
8.5.3 South America Desi Cow Ghee Revenue (USD Million) by Applications (2018-2022)
8.6 Middle East and Africa Desi Cow Ghee Revenue (USD Million), by Type, Technology, Application, Thickness (2018-2022)
8.6.1 Middle East and Africa Desi Cow Ghee Revenue (USD Million) by Country (2018-2022)
8.6.2 Middle East and Africa Desi Cow Ghee Revenue (USD Million) by Type (2018-2022)
8.6.3 Middle East and Africa Desi Cow Ghee Revenue (USD Million) by Applications (2018-2022)
9 Company Profiles
10 Global Desi Cow Ghee Market Revenue (USD Million), by Type, and Applications (2023-2030)
10.1 Global Desi Cow Ghee Revenue (USD Million) and Market Share (%) by Type (2023-2030)
10.1.1 Global Desi Cow Ghee Revenue (USD Million), and Market Share (%) by Type (2023-2030)
10.2 Global Desi Cow Ghee Revenue (USD Million) and Market Share (%) by Applications (2023-2030)
10.2.1 Global Desi Cow Ghee Revenue (USD Million), and Market Share (%) by Applications (2023-2030)
11 Global Desi Cow Ghee Development Regional Status and Outlook Forecast
11.1 Global Desi Cow Ghee Revenue (USD Million) By Regions (2023-2030)
11.2 North America Desi Cow Ghee Revenue (USD Million) by Type, and Applications (2023-2030)
11.2.1 North America Desi Cow Ghee Revenue (USD) Million by Country (2023-2030)
11.2.2 North America Desi Cow Ghee Revenue (USD Million), by Type (2023-2030)
11.2.3 North America Desi Cow Ghee Revenue (USD Million), Market Share (%) by Applications (2023-2030)
11.3 Europe Desi Cow Ghee Revenue (USD Million), by Type, and Applications (2023-2030)
11.3.1 Europe Desi Cow Ghee Revenue (USD Million), by Country (2023-2030)
11.3.2 Europe Desi Cow Ghee Revenue (USD Million), by Type (2023-2030)
11.3.3 Europe Desi Cow Ghee Revenue (USD Million), by Applications (2023-2030)
11.4 Asia Pacific Desi Cow Ghee Revenue (USD Million) by Type, and Applications (2023-2030)
11.4.1 Asia Pacific Desi Cow Ghee Revenue (USD Million), by Country (2023-2030)
11.4.2 Asia Pacific Desi Cow Ghee Revenue (USD Million), by Type (2023-2030)
11.4.3 Asia Pacific Desi Cow Ghee Revenue (USD Million), by Applications (2023-2030)
11.5 South America Desi Cow Ghee Revenue (USD Million), by Type, and Applications (2023-2030)
11.5.1 South America Desi Cow Ghee Revenue (USD Million), by Country (2023-2030)
11.5.2 South America Desi Cow Ghee Revenue (USD Million), by Type (2023-2030)
11.5.3 South America Desi Cow Ghee Revenue (USD Million), by Applications (2023-2030)
11.6 Middle East and Africa Desi Cow Ghee Revenue (USD Million), by Type, and Applications (2023-2030)
11.6.1 Middle East and Africa Desi Cow Ghee Revenue (USD Million), by Region (2023-2030)
11.6.2 Middle East and Africa Desi Cow Ghee Revenue (USD Million), by Type (2023-2030)
11.6.3 Middle East and Africa Desi Cow Ghee Revenue (USD Million), by Applications (2023-2030)
12 Methodology and Data Sources
12.1 Methodology/Research Approach
12.1.1 Research Programs/Design
12.1.2 Market Size Estimation
12.1.3 Market Breakdown and Data Triangulation
12.2 Data Sources
12.2.1 Secondary Sources
12.2.2 Primary Sources
12.3 Disclaimer
List of Tables
Table 1 Market Segmentation Analysis
Table 2 Global Desi Cow Ghee Market Companies with Areas Served
Table 3 Products Offerings Global Desi Cow Ghee Market
Table 4 Low Growth Scenario Forecasts
Table 5 Reference Case Growth Scenario
Table 6 High Growth Case Scenario
Table 7 Global Desi Cow Ghee Revenue (USD Million) And CAGR (%) By Type (2018-2030)
Table 8 Global Desi Cow Ghee Revenue (USD Million) And CAGR (%) By Applications (2018-2030)
Table 9 Global Desi Cow Ghee Revenue (USD Million) And CAGR (%) By Regions (2018-2030)
Table 10 Global Desi Cow Ghee Revenue (USD Million) By Type (2018-2022)
Table 11 Global Desi Cow Ghee Revenue Market Share (%) By Type (2018-2022)
Table 12 Global Desi Cow Ghee Revenue (USD Million) By Applications (2018-2022)
Table 13 Global Desi Cow Ghee Revenue Market Share (%) By Applications (2018-2022)
Table 14 Global Desi Cow Ghee Market Revenue (USD Million) By Regions (2018-2022)
Table 15 Global Desi Cow Ghee Market Share (%) By Regions (2018-2022)
Table 16 North America Desi Cow Ghee Revenue (USD Million) By Country (2018-2022)
Table 17 North America Desi Cow Ghee Revenue (USD Million) By Type (2018-2022)
Table 18 North America Desi Cow Ghee Revenue (USD Million) By Applications (2018-2022)
Table 19 Europe Desi Cow Ghee Revenue (USD Million) By Country (2018-2022)
Table 20 Europe Desi Cow Ghee Revenue (USD Million) By Type (2018-2022)
Table 21 Europe Desi Cow Ghee Revenue (USD Million) By Applications (2018-2022)
Table 22 Asia Pacific Desi Cow Ghee Revenue (USD Million) By Country (2018-2022)
Table 23 Asia Pacific Desi Cow Ghee Revenue (USD Million) By Type (2018-2022)
Table 24 Asia Pacific Desi Cow Ghee Revenue (USD Million) By Applications (2018-2022)
Table 25 South America Desi Cow Ghee Revenue (USD Million) By Country (2018-2022)
Table 26 South America Desi Cow Ghee Revenue (USD Million) By Type (2018-2022)
Table 27 South America Desi Cow Ghee Revenue (USD Million) By Applications (2018-2022)
Table 28 Middle East and Africa Desi Cow Ghee Revenue (USD Million) By Region (2018-2022)
Table 29 Middle East and Africa Desi Cow Ghee Revenue (USD Million) By Type (2018-2022)
Table 30 Middle East and Africa Desi Cow Ghee Revenue (USD Million) By Applications (2018-2022)
Table 31 Financial Analysis
Table 32 Global Desi Cow Ghee Revenue (USD Million) By Type (2023-2030)
Table 33 Global Desi Cow Ghee Revenue Market Share (%) By Type (2023-2030)
Table 34 Global Desi Cow Ghee Revenue (USD Million) By Applications (2023-2030)
Table 35 Global Desi Cow Ghee Revenue Market Share (%) By Applications (2023-2030)
Table 36 Global Desi Cow Ghee Market Revenue (USD Million), And Revenue (USD Million) By Regions (2023-2030)
Table 37 North America Desi Cow Ghee Revenue (USD)By Country (2023-2030)
Table 38 North America Desi Cow Ghee Revenue (USD Million) By Type (2023-2030)
Table 39 North America Desi Cow Ghee Revenue (USD Million) By Applications (2023-2030)
Table 40 Europe Desi Cow Ghee Revenue (USD Million) By Country (2023-2030)
Table 41 Europe Desi Cow Ghee Revenue (USD Million) By Type (2023-2030)
Table 42 Europe Desi Cow Ghee Revenue (USD Million) By Applications (2023-2030)
Table 43 Asia Pacific Desi Cow Ghee Revenue (USD Million) By Country (2023-2030)
Table 44 Asia Pacific Desi Cow Ghee Revenue (USD Million) By Type (2023-2030)
Table 45 Asia Pacific Desi Cow Ghee Revenue (USD Million) By Applications (2023-2030)
Table 46 South America Desi Cow Ghee Revenue (USD Million) By Country (2023-2030)
Table 47 South America Desi Cow Ghee Revenue (USD Million) By Type (2023-2030)
Table 48 South America Desi Cow Ghee Revenue (USD Million) By Applications (2023-2030)
Table 49 Middle East and Africa Desi Cow Ghee Revenue (USD Million) By Region (2023-2030)
Table 50 Middle East and Africa Desi Cow Ghee Revenue (USD Million) By Region (2023-2030)
Table 51 Middle East and Africa Desi Cow Ghee Revenue (USD Million) By Type (2023-2030)
Table 52 Middle East and Africa Desi Cow Ghee Revenue (USD Million) By Applications (2023-2030)
Table 53 Research Programs/Design for This Report
Table 54 Key Data Information from Secondary Sources
Table 55 Key Data Information from Primary Sources
List of Figures
Figure 1 Market Scope
Figure 2 Porter’s Five Forces
Figure 3 Global Desi Cow Ghee Revenue (USD Million) By Type (2018-2022)
Figure 4 Global Desi Cow Ghee Revenue Market Share (%) By Type (2022)
Figure 5 Global Desi Cow Ghee Revenue (USD Million) By Applications (2018-2022)
Figure 6 Global Desi Cow Ghee Revenue Market Share (%) By Applications (2022)
Figure 7 Global Desi Cow Ghee Market Revenue (USD Million) By Regions (2018-2022)
Figure 8 Global Desi Cow Ghee Market Share (%) By Regions (2022)
Figure 9 North America Desi Cow Ghee Revenue (USD Million) By Country (2018-2022)
Figure 10 North America Desi Cow Ghee Revenue (USD Million) By Type (2018-2022)
Figure 11 North America Desi Cow Ghee Revenue (USD Million) By Applications (2018-2022)
Figure 12 Europe Desi Cow Ghee Revenue (USD Million) By Country (2018-2022)
Figure 13 Europe Desi Cow Ghee Revenue (USD Million) By Type (2018-2022)
Figure 14 Europe Desi Cow Ghee Revenue (USD Million) By Applications (2018-2022)
Figure 15 Asia Pacific Desi Cow Ghee Revenue (USD Million) By Country (2018-2022)
Figure 16 Asia Pacific Desi Cow Ghee Revenue (USD Million) By Type (2018-2022)
Figure 17 Asia Pacific Desi Cow Ghee Revenue (USD Million) By Applications (2018-2022)
Figure 18 South America Desi Cow Ghee Revenue (USD Million) By Country (2018-2022)
Figure 19 South America Desi Cow Ghee Revenue (USD Million) By Type (2018-2022)
Figure 20 South America Desi Cow Ghee Revenue (USD Million) By Applications (2018-2022)
Figure 21 Middle East and Africa Desi Cow Ghee Revenue (USD Million) By Region (2018-2022)
Figure 22 Middle East and Africa Desi Cow Ghee Revenue (USD Million) By Type (2018-2022)
Figure 23 Middle East and Africa Desi Cow Ghee Revenue (USD Million) By Applications (2018-2022)
Figure 24 Global Desi Cow Ghee Revenue (USD Million) By Type (2023-2030)
Figure 25 Global Desi Cow Ghee Revenue Market Share (%) By Type (2030)
Figure 26 Global Desi Cow Ghee Revenue (USD Million) By Applications (2023-2030)
Figure 27 Global Desi Cow Ghee Revenue Market Share (%) By Applications (2030)
Figure 28 Global Desi Cow Ghee Market Revenue (USD Million) By Regions (2023-2030)
Figure 29 North America Desi Cow Ghee Revenue (USD Million) By Country (2023-2030)
Figure 30 North America Desi Cow Ghee Revenue (USD Million) By Type (2023-2030)
Figure 31 North America Desi Cow Ghee Revenue (USD Million) By Applications (2023-2030)
Figure 32 Europe Desi Cow Ghee Revenue (USD Million) By Country (2023-2030)
Figure 33 Europe Desi Cow Ghee Revenue (USD Million) By Type (2023-2030)
Figure 34 Europe Desi Cow Ghee Revenue (USD Million) By Applications (2023-2030)
Figure 35 Asia Pacific Desi Cow Ghee Revenue (USD Million) By Country (2023-2030)
Figure 36 Asia Pacific Desi Cow Ghee Revenue (USD Million) By Type (2023-2030)
Figure 37 Asia Pacific Desi Cow Ghee Revenue (USD Million) By Applications (2023-2030)
Figure 38 South America Desi Cow Ghee Revenue (USD Million) By Country (2023-2030)
Figure 39 South America Desi Cow Ghee Revenue (USD Million) By Type (2023-2030)
Figure 40 South America Desi Cow Ghee Revenue (USD Million) By Applications (2023-2030)
Figure 41 Middle East and Africa Desi Cow Ghee Revenue (USD Million) By Region (2023-2030)
Figure 42 Middle East and Africa Desi Cow Ghee Revenue (USD Million) By Region (2023-2030)
Figure 43 Middle East and Africa Desi Cow Ghee Revenue (USD Million) By Type (2023-2030)
Figure 44 Middle East and Africa Desi Cow Ghee Revenue (USD Million) By Applications (2023-2030)
Figure 45 Bottom-Up and Top-Down Approaches For This Report
Figure 46 Data Triangulation
