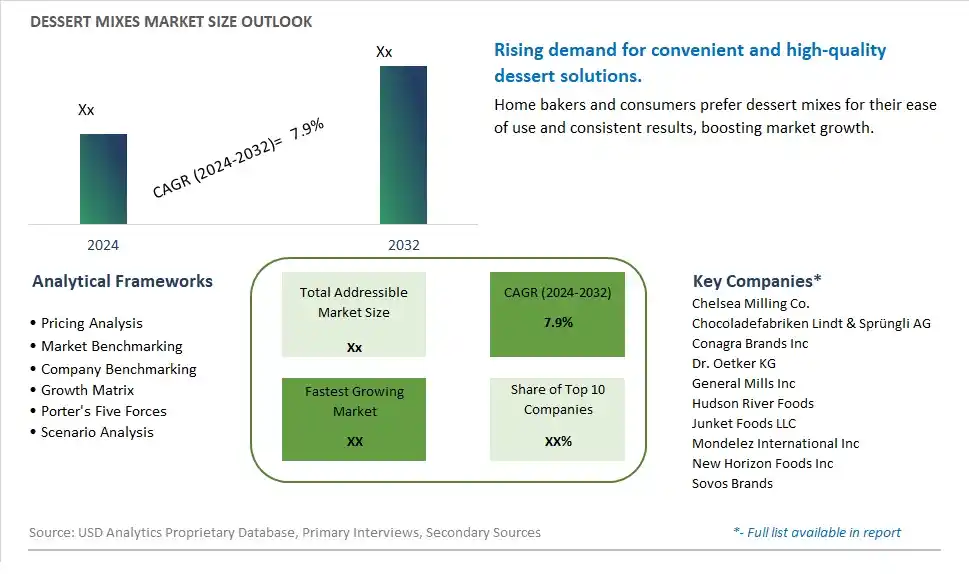
Global Dessert Mixes Market Size is valued at $XX Million in 2024 and is forecast to register a growth rate (CAGR) of 7.9% to reach $XX Million by 2032.
The global Dessert Mixes Market Comprehensive Study analyzes and forecasts the market size across 6 regions and 24 countries for diverse segments -By Product (Cake Mix, Brownie Mix, Ice-Cream Mix, Others), By Flavor (Chocolate, Vanilla, Red velvet, Others), By Type (Organic, Conventional), By Distribution Channel (Hypermarkets/Supermarkets, Convenience Stores, Online Retail, Others)
An Introduction to Dessert Mixes Market
The Dessert Mixes market in 2024 is expanding rapidly, driven by the increasing demand for convenient and easy-to-prepare dessert solutions. Dessert mixes, which include cake, brownie, pudding, and cookie mixes, are popular for their convenience, consistent results, and variety of flavors. The market is supported by the growing trend towards home baking and the desire for gourmet, homemade desserts. Advances in formulation and packaging technologies are enhancing the quality, flavor, and shelf life of dessert mixes. The market is also benefiting from the trend towards clean-label and natural ingredients, appealing to consumers seeking high-quality and effortless dessert options.
Dessert Mixes Competitive Landscape
The market report analyses the leading companies in the industry including Chelsea Milling Co., Chocoladefabriken Lindt & Sprüngli AG, Conagra Brands Inc, Dr. Oetker KG, General Mills Inc, Hudson River Foods, Junket Foods LLC, Mondelez International Inc, New Horizon Foods Inc, Sovos Brands, and Others.
Dessert Mixes Market Dynamics
Dessert Mixes Market Trend: Growing Demand for Convenient and Indulgent Dessert Solutions
A prominent trend in the dessert mixes market is the growing demand for convenient and indulgent dessert solutions. Consumers are seeking easy-to-prepare dessert options that offer restaurant-quality taste and presentation at home. This trend is driven by factors such as busy lifestyles, the desire for gourmet experiences, and the availability of a wide range of dessert mix flavors and varieties catering to diverse tastes and preferences.
Dessert Mixes Market Driver: Increased Interest in Home Baking and Cooking
A key driver influencing the dessert mixes market is the increased interest in home baking and cooking, particularly during times of stay-at-home orders and social distancing measures. Dessert mixes provide amateur and experienced bakers with convenient and foolproof options to create delicious desserts without the need for extensive baking skills or time-consuming preparation. This driver is pushing consumers to explore baking at home and experiment with different dessert mix flavors, driving sales and market growth in the dessert mixes segment.
Dessert Mixes Market Opportunity: Expansion into Health-Conscious and Specialty Desserts
An exciting opportunity in the dessert mixes market lies in expansion into health-conscious and specialty desserts. There is potential to develop dessert mixes that cater to health-conscious consumers by offering low-sugar, reduced-calorie, gluten-free, or vegan options. Additionally, there is an opportunity to create specialty dessert mixes inspired by global cuisines, seasonal flavors, or gourmet ingredients, targeting niche markets and attracting discerning consumers looking for unique and premium dessert experiences. This expansion into health-conscious and specialty desserts allows companies to diversify their product offerings, tap into new consumer segments, and differentiate their dessert mixes in a competitive market landscape.
Dessert Mixes Market Share Analysis: Cake Mix segment generated the highest revenue share in the industry
Among the segments in the Dessert Mixes Market based on product types, the largest segment is Cake Mix. Cake mixes are pre-packaged dry ingredients that include flour, sugar, baking powder, and flavorings, making it convenient for consumers to bake cakes at home without the need for individual ingredients. The popularity of cake mixes can be attributed to their ease of use, time-saving benefits, and consistent results, making them a favorite choice for both occasional and regular bakers. Cake mixes come in various flavors and varieties, catering to diverse consumer preferences and occasions, further contributing to their dominance in the dessert mixes market.
Dessert Mixes Market Share Analysis: Red Velvet Flavor is the fastest growing segment over the forecast period to 2032
Within the Dessert Mixes Market segmented by flavor types, the fastest growing segment is Red Velvet. Red velvet flavor has gained significant popularity in recent years due to its unique taste, vibrant color, and versatility in dessert applications. This flavor's appeal extends across various age groups and occasions, from everyday indulgence to special celebrations like birthdays and holidays. The growing demand for red velvet dessert mixes can be attributed to consumers' increasing interest in trying new and exciting flavors, as well as the appeal of visually appealing desserts. As a result, manufacturers and retailers are focusing on expanding their red velvet product lines and promoting innovative recipes to cater to this rising consumer trend.
Dessert Mixes Market Share Analysis: Conventional Dessert Mixes segment generated the highest revenue share in the industry
In the Dessert Mixes Market categorized by type, the largest segment is Conventional Dessert Mixes. Conventional dessert mixes are widely consumed and preferred by a majority of consumers due to their affordability, availability, and familiar taste profiles. They are produced using traditional methods and ingredients, offering a range of flavors and options such as cake mixes, brownie mixes, ice-cream mixes, and more. The conventional segment dominates the market share because it caters to a broad consumer base, including households, bakeries, restaurants, and foodservice establishments. Additionally, the convenience and ease of use associated with conventional dessert mixes contribute to their widespread adoption. As a result, manufacturers continue to innovate within this segment by introducing new flavors, packaging formats, and marketing strategies to maintain their market leadership position and meet evolving consumer preferences.
Dessert Mixes Market Share Analysis: Online Retail is the fastest growing segment over the forecast period to 2032
The fastest-growing segment in the Dessert Mixes Market by Distribution Channel is Online Retail. With the rise of e-commerce platforms and digitalization, online retail channels have experienced exponential growth in recent years and are expected to continue expanding significantly by 2032. The convenience, accessibility, and wide variety of products offered by online retailers attract consumers looking for diverse dessert mix options without the constraints of physical store locations. Online platforms provide a seamless shopping experience, allowing consumers to browse, compare, and purchase dessert mixes from the comfort of their homes or on-the-go using mobile devices. Further, the global shift towards digital transactions and the growing preference for doorstep deliveries further boost the growth of online retail channels for dessert mixes. As a result, manufacturers and retailers are increasingly investing in enhancing their online presence, optimizing digital marketing strategies, and streamlining logistics to capitalize on the thriving online retail segment in the dessert mixes market.
Dessert Mixes Market Segmentation
By Product
Cake Mix
Brownie Mix
Ice-Cream Mix
Others
By Flavor
Chocolate
Vanilla
Red velvet
Others
By Type
Organic
Conventional
By Distribution Channel
Hypermarkets/Supermarkets
Convenience Stores
Online Retail
Others
Countries Analyzed
North America (US, Canada, Mexico)
Europe (Germany, UK, France, Spain, Italy, Russia, Rest of Europe)
Asia Pacific (China, India, Japan, South Korea, Australia, South East Asia, Rest of Asia)
South America (Brazil, Argentina, Rest of South America)
Middle East and Africa (Saudi Arabia, UAE, Rest of Middle East, South Africa, Egypt, Rest of Africa)
Dessert Mixes Companies Profiled in the Study
Chelsea Milling Co.
Chocoladefabriken Lindt & Sprüngli AG
Conagra Brands Inc
Dr. Oetker KG
General Mills Inc
Hudson River Foods
Junket Foods LLC
Mondelez International Inc
New Horizon Foods Inc
Sovos Brands
*- List Not Exhaustive
Chapter 1. TABLE OF CONTENTS
Chapter 2. Introduction to Dessert Mixes Market
2.1. Market Overview
2.2. Key Statistics and Report Highlights
2.3. Scope of the Comprehensive Study
2.3.1. Market Definition
2.3.2 Countries and Regions Covered
2.3.3 Research Objective
2.3.4 Units, Currency, and Conversions
2.3.5 Industry Value Chain
2.4. Key Market Segments
2.5. Key Companies
2.6. Study Period
Chapter 3. Strategic Analysis Review
3.1. Dessert Mixes Pricing Analysis and Forecast
3.2. Porter’s Five Forces
3.3. Market Ecosystem
3.4. SWOT Analysis
3.5. Regulatory Scenario
3.3. Effects of Inflation, Russia-Ukraine War, moderating economic growth, and other macroeconomic factors
Chapter 4. Competitive Landscape
4.1. Market Share Analysis
4.1.1. Global Dessert Mixes Market Share by Company, 2023
4.1.2. Product Offerings of Leading Dessert Mixes Companies
4.2. Market Entropy
4.2.1. New Product Launches in the Industry
4.2.2. Mergers, Acquisitions, Joint ventures, and Partnerships
4.3. Key Strategies and Best Practices
Chapter 5. Global Market Projections: Best, Reference, and Low Case Scenarios
5.1. Growth Analysis- Case Scenario Definitions
5.2. Low Growth Case Scenario Forecasts
5.3. Reference Growth Case Scenario Forecasts
5.4. High Growth Case Scenario Forecasts
Chapter 6. Market Dynamics
6.1. Dessert Mixes Market Drivers
6.2. Dessert Mixes Market Challenges
6.6. Dessert Mixes Market Opportunities
6.4. Dessert Mixes Market Trends
Chapter 7. Global Dessert Mixes Market Outlook Trends
7.1. Global Dessert Mixes Revenue (USD Million) and CAGR (%) by Type (2021-2032)
7.2. Global Dessert Mixes Revenue (USD Million) and CAGR (%) by Application (2021-2032)
7.3. Global Dessert Mixes Revenue (USD Million) and CAGR (%) by Product (2021-2032)
By Product
Cake Mix
Brownie Mix
Ice-Cream Mix
Others
By Flavor
Chocolate
Vanilla
Red velvet
Others
By Type
Organic
Conventional
By Distribution Channel
Hypermarkets/Supermarkets
Convenience Stores
Online Retail
Others
Chapter 8. Global Dessert Mixes Regional Analysis and Outlook
8.1. Global Dessert Mixes Revenue (USD Million) By Regions (2021- 2032)
8.2. North America Dessert Mixes Revenue (USD Million) by Country (2021-2032)
8.2.1. United States Dessert Mixes Regional Analysis and Outlook
8.2.2. Canada Dessert Mixes Regional Analysis and Outlook
8.2.3. Mexico Dessert Mixes Regional Analysis and Outlook
8.3. Europe Dessert Mixes Revenue (USD Million), by Country (2021-2032)
8.3.1. Germany Dessert Mixes Regional Analysis and Outlook
8.3.2. France Dessert Mixes Regional Analysis and Outlook
8.3.3. United Kingdom Dessert Mixes Regional Analysis and Outlook
8.3.4. Spain Dessert Mixes Regional Analysis and Outlook
8.3.5. Italy Dessert Mixes Regional Analysis and Outlook
8.3.6. Russia Dessert Mixes Regional Analysis and Outlook
8.3.7. Rest of Europe Dessert Mixes Regional Analysis and Outlook
8.4. Asia Pacific Dessert Mixes Revenue (USD Million) by Country (2021-2032)
8.4.1. China Dessert Mixes Regional Analysis and Outlook
8.4.2. Japan Dessert Mixes Regional Analysis and Outlook
8.4.3. India Dessert Mixes Regional Analysis and Outlook
8.4.4. South Korea Dessert Mixes Regional Analysis and Outlook
8.4.5. Australia Dessert Mixes Regional Analysis and Outlook
8.4.6. South East Asia Dessert Mixes Regional Analysis and Outlook
8.4.7. Rest of Asia Pacific Dessert Mixes Regional Analysis and Outlook
8.5. South America Dessert Mixes Revenue (USD Million), by Country (2021-2032)
8.5.1. Brazil Dessert Mixes Regional Analysis and Outlook
8.5.2. Argentina Dessert Mixes Regional Analysis and Outlook
8.5.3. Rest of South America Dessert Mixes Regional Analysis and Outlook
8.6. Middle East and Africa Dessert Mixes Revenue (USD Million) by Country (2021-2032)
8.6.1. Middle East Dessert Mixes Regional Analysis and Outlook
8.6.2. Africa Dessert Mixes Regional Analysis and Outlook
Chapter 9. North America Dessert Mixes Analysis and Outlook
9.1. North America Dessert Mixes Revenue (USD Million) by Segments (2021-2032)
9.1.1. North America Dessert Mixes Revenue (USD Million) by Type (2021-2032)
9.1.2. North America Dessert Mixes Revenue (USD Million) by Application (2021-2032)
9.1.3. North America Dessert Mixes Revenue (USD Million) by Product (2021-2032)
By Product
Cake Mix
Brownie Mix
Ice-Cream Mix
Others
By Flavor
Chocolate
Vanilla
Red velvet
Others
By Type
Organic
Conventional
By Distribution Channel
Hypermarkets/Supermarkets
Convenience Stores
Online Retail
Others
Chapter 10. Europe Dessert Mixes Analysis and Outlook
10.1. Europe Dessert Mixes Revenue (USD Million), by Segments (USD Million) (2021-2032)
10.1.1. Europe Dessert Mixes Revenue (USD Million) by Type (2021-2032)
10.1.2. Europe Dessert Mixes Revenue (USD Million) by Application (2021-2032)
10.1.3. Europe Dessert Mixes Revenue (USD Million) by Product (2021-2032)
By Product
Cake Mix
Brownie Mix
Ice-Cream Mix
Others
By Flavor
Chocolate
Vanilla
Red velvet
Others
By Type
Organic
Conventional
By Distribution Channel
Hypermarkets/Supermarkets
Convenience Stores
Online Retail
Others
Chapter 11. Asia Pacific Dessert Mixes Analysis and Outlook
11.1. Asia Pacific Dessert Mixes Revenue (USD Million), and Revenue (USD Million) by Segments (2021-2032)
11.1.1. Asia Pacific Dessert Mixes Revenue (USD Million) by Type (2021-2032)
11.1.2. Asia Pacific Dessert Mixes Revenue (USD Million) by Application (2021-2032)
11.1.3. Asia Pacific Dessert Mixes Revenue (USD Million) by Product (2021-2032)
By Product
Cake Mix
Brownie Mix
Ice-Cream Mix
Others
By Flavor
Chocolate
Vanilla
Red velvet
Others
By Type
Organic
Conventional
By Distribution Channel
Hypermarkets/Supermarkets
Convenience Stores
Online Retail
Others
Chapter 12. South America Dessert Mixes Analysis and Outlook
12.1. South America Dessert Mixes Revenue (USD Million), by Segments (2021-2032)
12.1.1. South America Dessert Mixes Revenue (USD Million) by Type (2021-2032)
12.1.2. South America Dessert Mixes Revenue (USD Million) by Application (2021-2032)
12.1.3. South America Dessert Mixes Revenue (USD Million) by Product (2021-2032)
By Product
Cake Mix
Brownie Mix
Ice-Cream Mix
Others
By Flavor
Chocolate
Vanilla
Red velvet
Others
By Type
Organic
Conventional
By Distribution Channel
Hypermarkets/Supermarkets
Convenience Stores
Online Retail
Others
Chapter 13. Middle East and Africa Dessert Mixes Analysis and Outlook
13.1. Middle East and Africa Dessert Mixes Revenue (USD Million), by Segments (2021-2032)
13.1.1. Middle East and Africa Dessert Mixes Revenue (USD Million) by Type (2021-2032)
13.1.2. Middle East and Africa Dessert Mixes Revenue (USD Million) by Application (2021-2032)
13.1.3. Middle East and Africa Dessert Mixes Revenue (USD Million) by Product (2021-2032)
By Product
Cake Mix
Brownie Mix
Ice-Cream Mix
Others
By Flavor
Chocolate
Vanilla
Red velvet
Others
By Type
Organic
Conventional
By Distribution Channel
Hypermarkets/Supermarkets
Convenience Stores
Online Retail
Others
Chapter 14. Dessert Mixes Company Profiles
14.1 Business Overview
14.2 Product Profiles
14.3 SWOT Profiles
14.5 Recent Developments
14.6 Financial Profile
List of Companies
Chelsea Milling Co.
Chocoladefabriken Lindt & Sprüngli AG
Conagra Brands Inc
Dr. Oetker KG
General Mills Inc
Hudson River Foods
Junket Foods LLC
Mondelez International Inc
New Horizon Foods Inc
Sovos Brands
15. Methodology and Data Sources
15.1 Customization Offerings
15.2 Subscription Services
15.3 Related Reports
15.4 Publisher Expertise
LIST OF TABLES
Table 1 Market Segmentation Analysis
Table 2 Global Dessert Mixes Market Share of Leading Companies, 2023
Table 3 Product Offerings of Leading Companies
Table 4 Low Growth Scenario Forecasts
Table 5 Reference Case Growth Scenario
Table 6 High Growth Case Scenario
Table 7 Global Dessert Mixes Revenue (USD Million) And CAGR (%) By Type (2021-2032)
Table 8 Global Dessert Mixes Revenue (USD Million) And CAGR (%) By Application (2021-2032)
Table 9 Global Dessert Mixes Revenue (USD Million) And CAGR (%) By Product (2021-2032)
Table 10 Global Dessert Mixes Market Revenue (USD Million) By Regions (2021-2032)
Table 11 Global Dessert Mixes Market Share (%) By Regions (2021-2032)
Table 12 North America Dessert Mixes Revenue (USD Million) By Country (2021-2032)
Table 13 Europe Dessert Mixes Revenue (USD Million) By Country (2021-2032)
Table 14 Asia Pacific Dessert Mixes Revenue (USD Million) By Country (2021-2032)
Table 15 South America Dessert Mixes Revenue (USD Million) By Country (2021-2032)
Table 16 Middle East and Africa Dessert Mixes Revenue (USD Million) By Region (2021-2032)
Table 17 North America Dessert Mixes Revenue (USD Million) By Type (2021-2032)
Table 18 North America Dessert Mixes Revenue (USD Million) By Application (2021-2032)
Table 19 North America Dessert Mixes Revenue (USD Million) By Product (2021-2032)
Table 20 Europe Dessert Mixes Revenue (USD Million) By Type (2021-2032)
Table 21 Europe Dessert Mixes Revenue (USD Million) By Application (2021-2032)
Table 22 Europe Dessert Mixes Revenue (USD Million) By Product (2021-2032)
Table 23 Asia Pacific Dessert Mixes Revenue (USD Million) By Type (2021-2032)
Table 24 Asia Pacific Dessert Mixes Revenue (USD Million) By Application (2021-2032)
Table 25 Asia Pacific Dessert Mixes Revenue (USD Million) By Product (2021-2032)
Table 26 South America Dessert Mixes Revenue (USD Million) By Type (2021-2032)
Table 27 South America Dessert Mixes Revenue (USD Million) By Application (2021-2032)
Table 28 South America Dessert Mixes Revenue (USD Million) By Product (2021-2032)
Table 29 Middle East and Africa Dessert Mixes Revenue (USD Million) By Type (2021-2032)
Table 30 Middle East and Africa Dessert Mixes Revenue (USD Million) By Application (2021-2032)
Table 31 Middle East and Africa Dessert Mixes Revenue (USD Million) By Product (2021-2032)
LIST OF FIGURES
Figure 1. Market Scope
Figure 2. Pricing Forecasts Per Unit, 2023- 2032
Figure 3. Porter’s Five Forces
Figure 4. Global Dessert Mixes Market Revenue (USD Million) By Regions (2021-2032)
Figure 5. Global Dessert Mixes Market Share (%) By Regions (2023)
Figure 6. North America Dessert Mixes Revenue (USD Million) By Country (2021-2032)
Figure 7. United States Dessert Mixes Revenue (USD Million) By Country (2021-2032)
Figure 8. Canada Dessert Mixes Revenue (USD Million) By Country (2021-2032)
Figure 9. Mexico Dessert Mixes Revenue (USD Million) By Country (2021-2032)
Figure 10. Europe Dessert Mixes Revenue (USD Million) By Country (2021-2032)
Figure 11. Germany Dessert Mixes Revenue (USD Million) By Country (2021-2032)
Figure 12. France Dessert Mixes Revenue (USD Million) By Country (2021-2032)
Figure 13. United Kingdom Dessert Mixes Revenue (USD Million) By Country (2021-2032)
Figure 14. Spain Dessert Mixes Revenue (USD Million) By Country (2021-2032)
Figure 15. Italy Dessert Mixes Revenue (USD Million) By Country (2021-2032)
Figure 16. Russia Dessert Mixes Revenue (USD Million) By Country (2021-2032)
Figure 17. Rest of Europe Dessert Mixes Revenue (USD Million) By Country (2021-2032)
Figure 11. Asia Pacific Dessert Mixes Revenue (USD Million) By Country (2021-2032)
Figure 12. China Dessert Mixes Revenue (USD Million) By Country (2021-2032)
Figure 13. Japan Dessert Mixes Revenue (USD Million) By Country (2021-2032)
Figure 14. India Dessert Mixes Revenue (USD Million) By Country (2021-2032)
Figure 15. South Korea Dessert Mixes Revenue (USD Million) By Country (2021-2032)
Figure 16. Australia Dessert Mixes Revenue (USD Million) By Country (2021-2032)
Figure 17. South East Asia Dessert Mixes Revenue (USD Million) By Country (2021-2032)
Figure 18. South America Dessert Mixes Revenue (USD Million) By Country (2021-2032)
Figure 19. Brazil Dessert Mixes Revenue (USD Million) By Country (2021-2032)
Figure 20. Argentina Dessert Mixes Revenue (USD Million) By Country (2021-2032)
Figure 21. Rest of Asia Pacific Dessert Mixes Revenue (USD Million) By Country (2021-2032)
Figure 22. Middle East and Africa Dessert Mixes Revenue (USD Million) By Region (2021-2032)
Figure 23. Saudi Arabia Dessert Mixes Revenue (USD Million) By Region (2021-2032)
Figure 24. The UAE Dessert Mixes Revenue (USD Million) By Region (2021-2032)
Figure 25. Rest of Middle East Dessert Mixes Revenue (USD Million) By Region (2021-2032)
Figure 26. South Africa Dessert Mixes Revenue (USD Million) By Region (2021-2032)
Figure 27. Africa Dessert Mixes Revenue (USD Million) By Region (2021-2032)
Figure 28. North America Dessert Mixes Revenue (USD Million) By Type (2021-2032)
Figure 29. North America Dessert Mixes Revenue (USD Million) By Application (2021-2032)
Figure 30. North America Dessert Mixes Revenue (USD Million) By Product (2021-2032)
Figure 31. Europe Dessert Mixes Revenue (USD Million) By Type (2021-2032)
Figure 32. Europe Dessert Mixes Revenue (USD Million) By Application (2021-2032)
Figure 33. Europe Dessert Mixes Revenue (USD Million) By Product (2021-2032)
Figure 34. Asia Pacific Dessert Mixes Revenue (USD Million) By Type (2021-2032)
Figure 35. Asia Pacific Dessert Mixes Revenue (USD Million) By Application (2021-2032)
Figure 36. Asia Pacific Dessert Mixes Revenue (USD Million) By Product (2021-2032)
Figure 37. South America Dessert Mixes Revenue (USD Million) By Type (2021-2032)
Figure 38. South America Dessert Mixes Revenue (USD Million) By Application (2021-2032)
Figure 39. South America Dessert Mixes Revenue (USD Million) By Product (2021-2032)
Figure 40. Middle East and Africa Dessert Mixes Revenue (USD Million) By Type (2021-2032)
Figure 41. Middle East and Africa Dessert Mixes Revenue (USD Million) By Application (2021-2032)
Figure 42. Middle East and Africa Dessert Mixes Revenue (USD Million) By Product (2021-2032)
By Product
Cake Mix
Brownie Mix
Ice-Cream Mix
Others
By Flavor
Chocolate
Vanilla
Red velvet
Others
By Type
Organic
Conventional
By Distribution Channel
Hypermarkets/Supermarkets
Convenience Stores
Online Retail
Others
Countries Analyzed
North America (US, Canada, Mexico)
Europe (Germany, UK, France, Spain, Italy, Russia, Rest of Europe)
Asia Pacific (China, India, Japan, South Korea, Australia, South East Asia, Rest of Asia)
South America (Brazil, Argentina, Rest of South America)
Middle East and Africa (Saudi Arabia, UAE, Rest of Middle East, South Africa, Egypt, Rest of Africa)
