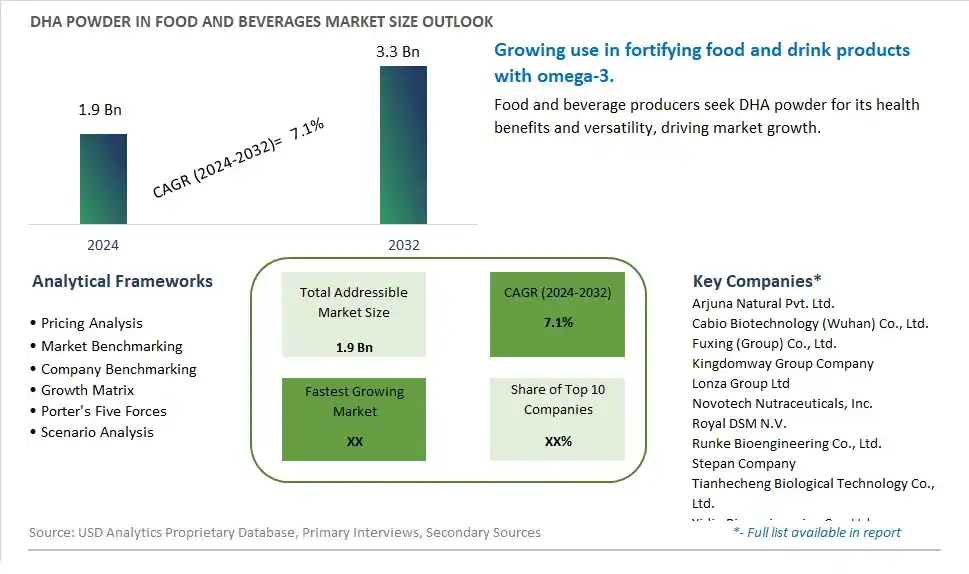
Global DHA Powder in Food and Beverages Market Size is valued at $1.9 Billion in 2024 and is forecast to register a growth rate (CAGR) of 7.1% to reach $3.3 Billion by 2032.
The global DHA Powder in Food and Beverages Market Comprehensive Study analyzes and forecasts the market size across 6 regions and 24 countries for diverse segments -By Type (Below 10% Content, 10 to 20% Content, Others), By Application (Maternity Application, Infant Formulae, Dietary Supplements, Others)
An Introduction to DHA Powder in Food and Beverages Market
The DHA Powder in Food and Beverages market in 2024 is expanding rapidly, driven by the increasing demand for functional foods and beverages enriched with essential nutrients. DHA powder is incorporated into various food and beverage products, including dairy alternatives, baked goods, and smoothies, to enhance their nutritional profile with omega-3 fatty acids. The market is supported by the growing trend towards health and wellness and the demand for fortified foods. Advances in formulation and processing technologies are enhancing the stability, taste, and bioavailability of DHA powder in food applications. The market is also benefiting from the trend towards clean-label and natural ingredients, appealing to consumers seeking nutritious and functional food options.
DHA Powder in Food and Beverages Competitive Landscape
The market report analyses the leading companies in the industry including Arjuna Natural Pvt. Ltd., Cabio Biotechnology (Wuhan) Co., Ltd., Fuxing (Group) Co., Ltd., Kingdomway Group Company, Lonza Group Ltd, Novotech Nutraceuticals, Inc., Royal DSM N.V., Runke Bioengineering Co., Ltd., Stepan Company, Tianhecheng Biological Technology Co., Ltd., Yidie Bioengineering Co., Ltd., and Others.
DHA Powder in Food and Beverages Market Dynamics
DHA Powder in Food and Beverages Market Trend: Growing Demand for Functional and Nutritious Food Products
A prominent trend in the DHA powder in food and beverages market is the growing demand for functional and nutritious food products. Consumers are increasingly seeking food and beverage options that offer health benefits beyond basic nutrition, including added nutrients like DHA (docosahexaenoic acid) powder. This trend is driven by the rising awareness of the importance of omega-3 fatty acids for brain health, heart health, and overall well-being, leading to increased interest in incorporating DHA powder into a variety of food and beverage applications to enhance their nutritional profiles.
DHA Powder in Food and Beverages Market Driver: Health-Conscious Consumer Preferences and Regulatory Support
A key driver influencing the DHA powder in food and beverages market is health-conscious consumer preferences and regulatory support. Consumers are prioritizing health and wellness, and are actively seeking products that align with their dietary goals, including increased omega-3 intake. Additionally, regulatory bodies and health organizations often recommend omega-3 supplementation, further driving the demand for DHA powder in food and beverage formulations. This driver is pushing food manufacturers and beverage producers to innovate and develop products fortified with DHA powder to meet consumer demands for healthier options.
DHA Powder in Food and Beverages Market Opportunity: Expansion into Functional and Fortified Food and Beverage Categories
An exciting opportunity in the DHA powder in food and beverages market lies in expansion into functional and fortified food and beverage categories. There is potential to incorporate DHA powder into a wide range of products, including dairy and plant-based milk alternatives, yogurt, smoothies, juices, bakery items, snacks, and nutritional supplements, to provide added health benefits and appeal to health-conscious consumers seeking omega-3-rich options. Additionally, there is an opportunity to collaborate with food technologists and beverage formulators to create innovative formulations that combine DHA powder with other functional ingredients, such as vitamins, minerals, antioxidants, and probiotics, to create holistic wellness products that cater to specific health concerns and nutritional needs. This expansion into functional and fortified food and beverage categories allows companies to tap into the growing market for functional ingredients, differentiate their products, and meet the evolving preferences of health-conscious consumers seeking convenient and nutritious options.
DHA Powder in Food and Beverages Market Share Analysis: 10 to 20% Content DHA Powder segment generated the highest revenue share in the industry
The 10 to 20% Content DHA Powder segment emerges as the largest category in the DHA Powder in Food and Beverages Market, showcasing rapid growth driven by its enhanced nutritional profile and versatility in food and beverage applications. DHA (docosahexaenoic acid) is a valuable omega-3 fatty acid known for its numerous health benefits, including supporting brain health, heart health, and overall well-being. DHA powder with a concentration of 10 to 20% ensures a potent and concentrated source of this essential nutrient, making it highly sought-after by food and beverage manufacturers aiming to enhance the nutritional value of their products. The versatility of this content range allows for its incorporation into various food and beverage applications, including dairy products, baked goods, beverages, and functional foods, without compromising taste or texture. Additionally, consumer awareness regarding the benefits of omega-3 fatty acids and the shift towards healthier dietary choices drive the demand for DHA-fortified food and beverage products. As consumers prioritize functional foods that offer added health benefits, the 10 to 20% Content DHA Powder segment remains at the forefront, driving innovation and growth in the DHA Powder in Food and Beverages Market.
DHA Powder in Food and Beverages Market Share Analysis: Infant Formulae Application is the fastest growing segment over the forecast period to 2032
The Infant Formulae Application segment within the DHA Powder in Food and Beverages Market emerges as the fastest-growing category projected to experience substantial growth by 2032. This surge is driven by several key factors. Firstly, the heightened focus on infant health and nutrition, coupled with the increasing awareness of the benefits of DHA (docosahexaenoic acid) in supporting early childhood development, drives the demand for DHA-fortified infant formulae. DHA is a crucial omega-3 fatty acid known for its role in brain and vision development in infants, making it a critical nutrient in infant nutrition. Additionally, parental awareness and education regarding the importance of DHA supplementation in infant diets contribute to the rising demand for DHA-fortified formulae in this segment. Further, regulatory support and recommendations from healthcare professionals emphasizing the benefits of DHA further drive the growth of this segment. As parents prioritize the health and well-being of their infants, the Infant Formulae Application of DHA powder in food and beverages emerges as a pivotal segment driving market growth and innovation in the DHA Powder in Food and Beverages Market.
DHA Powder in Food and Beverages Market Segmentation
By Type
Below 10% Content
10 to 20% Content
Others
By Application
Maternity Application
Infant Formulae
Dietary Supplements
Others
Countries Analyzed
North America (US, Canada, Mexico)
Europe (Germany, UK, France, Spain, Italy, Russia, Rest of Europe)
Asia Pacific (China, India, Japan, South Korea, Australia, South East Asia, Rest of Asia)
South America (Brazil, Argentina, Rest of South America)
Middle East and Africa (Saudi Arabia, UAE, Rest of Middle East, South Africa, Egypt, Rest of Africa)
DHA Powder in Food and Beverages Companies Profiled in the Study
Arjuna Natural Pvt. Ltd.
Cabio Biotechnology (Wuhan) Co., Ltd.
Fuxing (Group) Co., Ltd.
Kingdomway Group Company
Lonza Group Ltd
Novotech Nutraceuticals, Inc.
Royal DSM N.V.
Runke Bioengineering Co., Ltd.
Stepan Company
Tianhecheng Biological Technology Co., Ltd.
Yidie Bioengineering Co., Ltd.
*- List Not Exhaustive
Chapter 1. TABLE OF CONTENTS
Chapter 2. Introduction to DHA Powder in Food and Beverages Market
2.1. Market Overview
2.2. Key Statistics and Report Highlights
2.3. Scope of the Comprehensive Study
2.3.1. Market Definition
2.3.2 Countries and Regions Covered
2.3.3 Research Objective
2.3.4 Units, Currency, and Conversions
2.3.5 Industry Value Chain
2.4. Key Market Segments
2.5. Key Companies
2.6. Study Period
Chapter 3. Strategic Analysis Review
3.1. DHA Powder in Food and Beverages Pricing Analysis and Forecast
3.2. Porter’s Five Forces
3.3. Market Ecosystem
3.4. SWOT Analysis
3.5. Regulatory Scenario
3.3. Effects of Inflation, Russia-Ukraine War, moderating economic growth, and other macroeconomic factors
Chapter 4. Competitive Landscape
4.1. Market Share Analysis
4.1.1. Global DHA Powder in Food and Beverages Market Share by Company, 2023
4.1.2. Product Offerings of Leading DHA Powder in Food and Beverages Companies
4.2. Market Entropy
4.2.1. New Product Launches in the Industry
4.2.2. Mergers, Acquisitions, Joint ventures, and Partnerships
4.3. Key Strategies and Best Practices
Chapter 5. Global Market Projections: Best, Reference, and Low Case Scenarios
5.1. Growth Analysis- Case Scenario Definitions
5.2. Low Growth Case Scenario Forecasts
5.3. Reference Growth Case Scenario Forecasts
5.4. High Growth Case Scenario Forecasts
Chapter 6. Market Dynamics
6.1. DHA Powder in Food and Beverages Market Drivers
6.2. DHA Powder in Food and Beverages Market Challenges
6.6. DHA Powder in Food and Beverages Market Opportunities
6.4. DHA Powder in Food and Beverages Market Trends
Chapter 7. Global DHA Powder in Food and Beverages Market Outlook Trends
7.1. Global DHA Powder in Food and Beverages Revenue (USD Million) and CAGR (%) by Type (2021-2032)
7.2. Global DHA Powder in Food and Beverages Revenue (USD Million) and CAGR (%) by Application (2021-2032)
7.3. Global DHA Powder in Food and Beverages Revenue (USD Million) and CAGR (%) by Product (2021-2032)
By Type
Below 10% Content
10 to 20% Content
Others
By Application
Maternity Application
Infant Formulae
Dietary Supplements
Others
Chapter 8. Global DHA Powder in Food and Beverages Regional Analysis and Outlook
8.1. Global DHA Powder in Food and Beverages Revenue (USD Million) By Regions (2021- 2032)
8.2. North America DHA Powder in Food and Beverages Revenue (USD Million) by Country (2021-2032)
8.2.1. United States DHA Powder in Food and Beverages Regional Analysis and Outlook
8.2.2. Canada DHA Powder in Food and Beverages Regional Analysis and Outlook
8.2.3. Mexico DHA Powder in Food and Beverages Regional Analysis and Outlook
8.3. Europe DHA Powder in Food and Beverages Revenue (USD Million), by Country (2021-2032)
8.3.1. Germany DHA Powder in Food and Beverages Regional Analysis and Outlook
8.3.2. France DHA Powder in Food and Beverages Regional Analysis and Outlook
8.3.3. United Kingdom DHA Powder in Food and Beverages Regional Analysis and Outlook
8.3.4. Spain DHA Powder in Food and Beverages Regional Analysis and Outlook
8.3.5. Italy DHA Powder in Food and Beverages Regional Analysis and Outlook
8.3.6. Russia DHA Powder in Food and Beverages Regional Analysis and Outlook
8.3.7. Rest of Europe DHA Powder in Food and Beverages Regional Analysis and Outlook
8.4. Asia Pacific DHA Powder in Food and Beverages Revenue (USD Million) by Country (2021-2032)
8.4.1. China DHA Powder in Food and Beverages Regional Analysis and Outlook
8.4.2. Japan DHA Powder in Food and Beverages Regional Analysis and Outlook
8.4.3. India DHA Powder in Food and Beverages Regional Analysis and Outlook
8.4.4. South Korea DHA Powder in Food and Beverages Regional Analysis and Outlook
8.4.5. Australia DHA Powder in Food and Beverages Regional Analysis and Outlook
8.4.6. South East Asia DHA Powder in Food and Beverages Regional Analysis and Outlook
8.4.7. Rest of Asia Pacific DHA Powder in Food and Beverages Regional Analysis and Outlook
8.5. South America DHA Powder in Food and Beverages Revenue (USD Million), by Country (2021-2032)
8.5.1. Brazil DHA Powder in Food and Beverages Regional Analysis and Outlook
8.5.2. Argentina DHA Powder in Food and Beverages Regional Analysis and Outlook
8.5.3. Rest of South America DHA Powder in Food and Beverages Regional Analysis and Outlook
8.6. Middle East and Africa DHA Powder in Food and Beverages Revenue (USD Million) by Country (2021-2032)
8.6.1. Middle East DHA Powder in Food and Beverages Regional Analysis and Outlook
8.6.2. Africa DHA Powder in Food and Beverages Regional Analysis and Outlook
Chapter 9. North America DHA Powder in Food and Beverages Analysis and Outlook
9.1. North America DHA Powder in Food and Beverages Revenue (USD Million) by Segments (2021-2032)
9.1.1. North America DHA Powder in Food and Beverages Revenue (USD Million) by Type (2021-2032)
9.1.2. North America DHA Powder in Food and Beverages Revenue (USD Million) by Application (2021-2032)
9.1.3. North America DHA Powder in Food and Beverages Revenue (USD Million) by Product (2021-2032)
By Type
Below 10% Content
10 to 20% Content
Others
By Application
Maternity Application
Infant Formulae
Dietary Supplements
Others
Chapter 10. Europe DHA Powder in Food and Beverages Analysis and Outlook
10.1. Europe DHA Powder in Food and Beverages Revenue (USD Million), by Segments (USD Million) (2021-2032)
10.1.1. Europe DHA Powder in Food and Beverages Revenue (USD Million) by Type (2021-2032)
10.1.2. Europe DHA Powder in Food and Beverages Revenue (USD Million) by Application (2021-2032)
10.1.3. Europe DHA Powder in Food and Beverages Revenue (USD Million) by Product (2021-2032)
By Type
Below 10% Content
10 to 20% Content
Others
By Application
Maternity Application
Infant Formulae
Dietary Supplements
Others
Chapter 11. Asia Pacific DHA Powder in Food and Beverages Analysis and Outlook
11.1. Asia Pacific DHA Powder in Food and Beverages Revenue (USD Million), and Revenue (USD Million) by Segments (2021-2032)
11.1.1. Asia Pacific DHA Powder in Food and Beverages Revenue (USD Million) by Type (2021-2032)
11.1.2. Asia Pacific DHA Powder in Food and Beverages Revenue (USD Million) by Application (2021-2032)
11.1.3. Asia Pacific DHA Powder in Food and Beverages Revenue (USD Million) by Product (2021-2032)
By Type
Below 10% Content
10 to 20% Content
Others
By Application
Maternity Application
Infant Formulae
Dietary Supplements
Others
Chapter 12. South America DHA Powder in Food and Beverages Analysis and Outlook
12.1. South America DHA Powder in Food and Beverages Revenue (USD Million), by Segments (2021-2032)
12.1.1. South America DHA Powder in Food and Beverages Revenue (USD Million) by Type (2021-2032)
12.1.2. South America DHA Powder in Food and Beverages Revenue (USD Million) by Application (2021-2032)
12.1.3. South America DHA Powder in Food and Beverages Revenue (USD Million) by Product (2021-2032)
By Type
Below 10% Content
10 to 20% Content
Others
By Application
Maternity Application
Infant Formulae
Dietary Supplements
Others
Chapter 13. Middle East and Africa DHA Powder in Food and Beverages Analysis and Outlook
13.1. Middle East and Africa DHA Powder in Food and Beverages Revenue (USD Million), by Segments (2021-2032)
13.1.1. Middle East and Africa DHA Powder in Food and Beverages Revenue (USD Million) by Type (2021-2032)
13.1.2. Middle East and Africa DHA Powder in Food and Beverages Revenue (USD Million) by Application (2021-2032)
13.1.3. Middle East and Africa DHA Powder in Food and Beverages Revenue (USD Million) by Product (2021-2032)
By Type
Below 10% Content
10 to 20% Content
Others
By Application
Maternity Application
Infant Formulae
Dietary Supplements
Others
Chapter 14. DHA Powder in Food and Beverages Company Profiles
14.1 Business Overview
14.2 Product Profiles
14.3 SWOT Profiles
14.5 Recent Developments
14.6 Financial Profile
List of Companies
Arjuna Natural Pvt. Ltd.
Cabio Biotechnology (Wuhan) Co., Ltd.
Fuxing (Group) Co., Ltd.
Kingdomway Group Company
Lonza Group Ltd
Novotech Nutraceuticals, Inc.
Royal DSM N.V.
Runke Bioengineering Co., Ltd.
Stepan Company
Tianhecheng Biological Technology Co., Ltd.
Yidie Bioengineering Co., Ltd.
15. Methodology and Data Sources
15.1 Customization Offerings
15.2 Subscription Services
15.3 Related Reports
15.4 Publisher Expertise
LIST OF TABLES
Table 1 Market Segmentation Analysis
Table 2 Global DHA Powder in Food and Beverages Market Share of Leading Companies, 2023
Table 3 Product Offerings of Leading Companies
Table 4 Low Growth Scenario Forecasts
Table 5 Reference Case Growth Scenario
Table 6 High Growth Case Scenario
Table 7 Global DHA Powder in Food and Beverages Revenue (USD Million) And CAGR (%) By Type (2021-2032)
Table 8 Global DHA Powder in Food and Beverages Revenue (USD Million) And CAGR (%) By Application (2021-2032)
Table 9 Global DHA Powder in Food and Beverages Revenue (USD Million) And CAGR (%) By Product (2021-2032)
Table 10 Global DHA Powder in Food and Beverages Market Revenue (USD Million) By Regions (2021-2032)
Table 11 Global DHA Powder in Food and Beverages Market Share (%) By Regions (2021-2032)
Table 12 North America DHA Powder in Food and Beverages Revenue (USD Million) By Country (2021-2032)
Table 13 Europe DHA Powder in Food and Beverages Revenue (USD Million) By Country (2021-2032)
Table 14 Asia Pacific DHA Powder in Food and Beverages Revenue (USD Million) By Country (2021-2032)
Table 15 South America DHA Powder in Food and Beverages Revenue (USD Million) By Country (2021-2032)
Table 16 Middle East and Africa DHA Powder in Food and Beverages Revenue (USD Million) By Region (2021-2032)
Table 17 North America DHA Powder in Food and Beverages Revenue (USD Million) By Type (2021-2032)
Table 18 North America DHA Powder in Food and Beverages Revenue (USD Million) By Application (2021-2032)
Table 19 North America DHA Powder in Food and Beverages Revenue (USD Million) By Product (2021-2032)
Table 20 Europe DHA Powder in Food and Beverages Revenue (USD Million) By Type (2021-2032)
Table 21 Europe DHA Powder in Food and Beverages Revenue (USD Million) By Application (2021-2032)
Table 22 Europe DHA Powder in Food and Beverages Revenue (USD Million) By Product (2021-2032)
Table 23 Asia Pacific DHA Powder in Food and Beverages Revenue (USD Million) By Type (2021-2032)
Table 24 Asia Pacific DHA Powder in Food and Beverages Revenue (USD Million) By Application (2021-2032)
Table 25 Asia Pacific DHA Powder in Food and Beverages Revenue (USD Million) By Product (2021-2032)
Table 26 South America DHA Powder in Food and Beverages Revenue (USD Million) By Type (2021-2032)
Table 27 South America DHA Powder in Food and Beverages Revenue (USD Million) By Application (2021-2032)
Table 28 South America DHA Powder in Food and Beverages Revenue (USD Million) By Product (2021-2032)
Table 29 Middle East and Africa DHA Powder in Food and Beverages Revenue (USD Million) By Type (2021-2032)
Table 30 Middle East and Africa DHA Powder in Food and Beverages Revenue (USD Million) By Application (2021-2032)
Table 31 Middle East and Africa DHA Powder in Food and Beverages Revenue (USD Million) By Product (2021-2032)
LIST OF FIGURES
Figure 1. Market Scope
Figure 2. Pricing Forecasts Per Unit, 2023- 2032
Figure 3. Porter’s Five Forces
Figure 4. Global DHA Powder in Food and Beverages Market Revenue (USD Million) By Regions (2021-2032)
Figure 5. Global DHA Powder in Food and Beverages Market Share (%) By Regions (2023)
Figure 6. North America DHA Powder in Food and Beverages Revenue (USD Million) By Country (2021-2032)
Figure 7. United States DHA Powder in Food and Beverages Revenue (USD Million) By Country (2021-2032)
Figure 8. Canada DHA Powder in Food and Beverages Revenue (USD Million) By Country (2021-2032)
Figure 9. Mexico DHA Powder in Food and Beverages Revenue (USD Million) By Country (2021-2032)
Figure 10. Europe DHA Powder in Food and Beverages Revenue (USD Million) By Country (2021-2032)
Figure 11. Germany DHA Powder in Food and Beverages Revenue (USD Million) By Country (2021-2032)
Figure 12. France DHA Powder in Food and Beverages Revenue (USD Million) By Country (2021-2032)
Figure 13. United Kingdom DHA Powder in Food and Beverages Revenue (USD Million) By Country (2021-2032)
Figure 14. Spain DHA Powder in Food and Beverages Revenue (USD Million) By Country (2021-2032)
Figure 15. Italy DHA Powder in Food and Beverages Revenue (USD Million) By Country (2021-2032)
Figure 16. Russia DHA Powder in Food and Beverages Revenue (USD Million) By Country (2021-2032)
Figure 17. Rest of Europe DHA Powder in Food and Beverages Revenue (USD Million) By Country (2021-2032)
Figure 11. Asia Pacific DHA Powder in Food and Beverages Revenue (USD Million) By Country (2021-2032)
Figure 12. China DHA Powder in Food and Beverages Revenue (USD Million) By Country (2021-2032)
Figure 13. Japan DHA Powder in Food and Beverages Revenue (USD Million) By Country (2021-2032)
Figure 14. India DHA Powder in Food and Beverages Revenue (USD Million) By Country (2021-2032)
Figure 15. South Korea DHA Powder in Food and Beverages Revenue (USD Million) By Country (2021-2032)
Figure 16. Australia DHA Powder in Food and Beverages Revenue (USD Million) By Country (2021-2032)
Figure 17. South East Asia DHA Powder in Food and Beverages Revenue (USD Million) By Country (2021-2032)
Figure 18. South America DHA Powder in Food and Beverages Revenue (USD Million) By Country (2021-2032)
Figure 19. Brazil DHA Powder in Food and Beverages Revenue (USD Million) By Country (2021-2032)
Figure 20. Argentina DHA Powder in Food and Beverages Revenue (USD Million) By Country (2021-2032)
Figure 21. Rest of Asia Pacific DHA Powder in Food and Beverages Revenue (USD Million) By Country (2021-2032)
Figure 22. Middle East and Africa DHA Powder in Food and Beverages Revenue (USD Million) By Region (2021-2032)
Figure 23. Saudi Arabia DHA Powder in Food and Beverages Revenue (USD Million) By Region (2021-2032)
Figure 24. The UAE DHA Powder in Food and Beverages Revenue (USD Million) By Region (2021-2032)
Figure 25. Rest of Middle East DHA Powder in Food and Beverages Revenue (USD Million) By Region (2021-2032)
Figure 26. South Africa DHA Powder in Food and Beverages Revenue (USD Million) By Region (2021-2032)
Figure 27. Africa DHA Powder in Food and Beverages Revenue (USD Million) By Region (2021-2032)
Figure 28. North America DHA Powder in Food and Beverages Revenue (USD Million) By Type (2021-2032)
Figure 29. North America DHA Powder in Food and Beverages Revenue (USD Million) By Application (2021-2032)
Figure 30. North America DHA Powder in Food and Beverages Revenue (USD Million) By Product (2021-2032)
Figure 31. Europe DHA Powder in Food and Beverages Revenue (USD Million) By Type (2021-2032)
Figure 32. Europe DHA Powder in Food and Beverages Revenue (USD Million) By Application (2021-2032)
Figure 33. Europe DHA Powder in Food and Beverages Revenue (USD Million) By Product (2021-2032)
Figure 34. Asia Pacific DHA Powder in Food and Beverages Revenue (USD Million) By Type (2021-2032)
Figure 35. Asia Pacific DHA Powder in Food and Beverages Revenue (USD Million) By Application (2021-2032)
Figure 36. Asia Pacific DHA Powder in Food and Beverages Revenue (USD Million) By Product (2021-2032)
Figure 37. South America DHA Powder in Food and Beverages Revenue (USD Million) By Type (2021-2032)
Figure 38. South America DHA Powder in Food and Beverages Revenue (USD Million) By Application (2021-2032)
Figure 39. South America DHA Powder in Food and Beverages Revenue (USD Million) By Product (2021-2032)
Figure 40. Middle East and Africa DHA Powder in Food and Beverages Revenue (USD Million) By Type (2021-2032)
Figure 41. Middle East and Africa DHA Powder in Food and Beverages Revenue (USD Million) By Application (2021-2032)
Figure 42. Middle East and Africa DHA Powder in Food and Beverages Revenue (USD Million) By Product (2021-2032)
By Type
Below 10% Content
10 to 20% Content
Others
By Application
Maternity Application
Infant Formulae
Dietary Supplements
Others
Countries Analyzed
North America (US, Canada, Mexico)
Europe (Germany, UK, France, Spain, Italy, Russia, Rest of Europe)
Asia Pacific (China, India, Japan, South Korea, Australia, South East Asia, Rest of Asia)
South America (Brazil, Argentina, Rest of South America)
Middle East and Africa (Saudi Arabia, UAE, Rest of Middle East, South Africa, Egypt, Rest of Africa)
