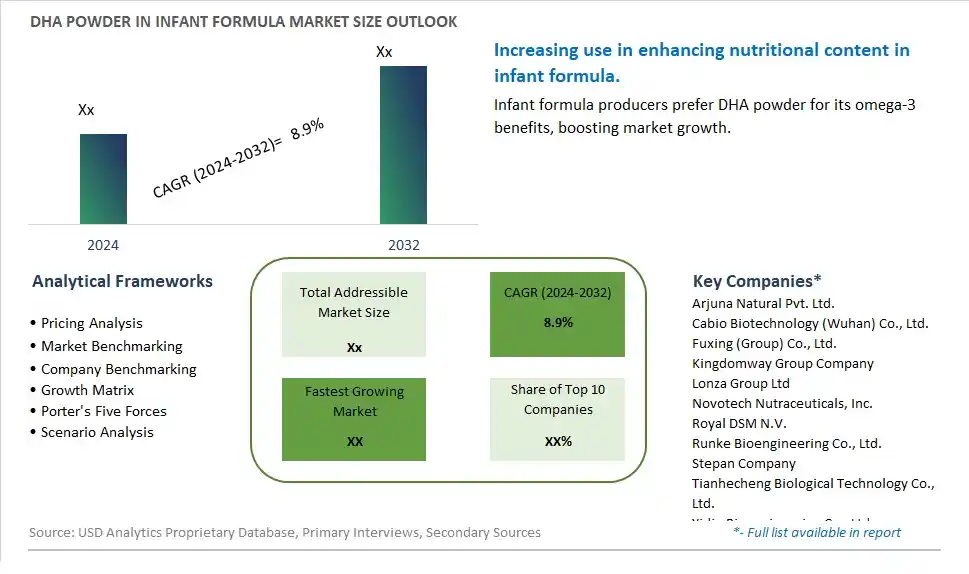
Global DHA Powder in Infant Formula Market Size is valued at $XX Million in 2024 and is forecast to register a growth rate (CAGR) of 8.9% to reach $XX Million by 2032.
The global DHA Powder in Infant Formula Market Comprehensive Study analyzes and forecasts the market size across 6 regions and 24 countries for diverse segments -By Type (Content Below 10%, Content 10-20%, Others), By Age Group (0 to 12 Months, 1 to 2 Years, Others)
An Introduction to DHA Powder in Infant Formula Market
In 2024, the DHA Powder in Infant Formula market is witnessing robust growth, driven by the increasing demand for high-quality, nutritionally complete infant nutrition products. DHA powder, rich in docosahexaenoic acid (DHA), is added to infant formulas to support optimal brain and eye development in infants. The market is supported by the growing awareness of the importance of DHA in early childhood development. Advances in microencapsulation and powder formulation technologies are enhancing the stability, purity, and bioavailability of DHA powder for use in infant formulas. The market is also benefiting from the trend towards clean-label and scientifically backed ingredients, appealing to parents seeking the best nutritional options for their infants.
DHA Powder in Infant Formula Competitive Landscape
The market report analyses the leading companies in the industry including Arjuna Natural Pvt. Ltd., Cabio Biotechnology (Wuhan) Co., Ltd., Fuxing (Group) Co., Ltd., Kingdomway Group Company, Lonza Group Ltd, Novotech Nutraceuticals, Inc., Royal DSM N.V., Runke Bioengineering Co., Ltd., Stepan Company, Tianhecheng Biological Technology Co., Ltd., Yidie Bioengineering Co., Ltd., and Others.
DHA Powder in Infant Formula Market Dynamics
DHA Powder in Infant Formula Market Trend: Increasing Emphasis on Brain Development and Cognitive Health in Infants
A prominent trend in the DHA powder in infant formula market is the increasing emphasis on brain development and cognitive health in infants. Parents and caregivers are becoming more aware of the critical role that DHA (docosahexaenoic acid) plays in supporting brain development, cognitive function, and visual acuity during the early stages of life. As a result, there is a growing demand for infant formulas fortified with DHA powder to ensure optimal nutrition for infants' brain development and overall well-being.
DHA Powder in Infant Formula Market Driver: Parental Awareness and Preference for Nutrient-Rich Infant Nutrition
A key driver influencing the DHA powder in infant formula market is parental awareness and preference for nutrient-rich infant nutrition. Parents are actively seeking formula options that mimic the nutritional composition of breast milk, including essential nutrients like DHA powder. The recognition of DHA's benefits for brain and eye development, coupled with parents' desire to provide the best possible nutrition for their infants, is driving the demand for infant formulas enriched with DHA powder as a crucial component of comprehensive infant nutrition.
DHA Powder in Infant Formula Market Opportunity: Innovation in Advanced Formulas and Premium Infant Nutrition
An exciting opportunity in the DHA powder in infant formula market lies in innovation in advanced formulas and premium infant nutrition. There is potential to develop specialized infant formulas that offer higher levels of DHA powder, catering to parents who prioritize brain development and cognitive health in their infants. Additionally, there is an opportunity to create premium and organic formula options fortified with DHA powder, targeting health-conscious parents seeking the highest quality nutrition for their babies. This innovation in advanced formulas and premium infant nutrition allows companies to differentiate their products, provide added value to consumers, and capitalize on the growing demand for nutrient-rich and brain-boosting infant formulas in the market.
DHA Powder in Infant Formula Market Share Analysis: Content 10-20% segment generated the highest revenue share in the industry
The Content 10-20% segment stands out as the largest category in the DHA Powder in Infant Formula Market, showcasing rapid growth driven by its enhanced nutritional profile and increasing demand for high-quality infant nutrition. DHA (docosahexaenoic acid) is a crucial omega-3 fatty acid known for its role in supporting brain development, cognitive function, and visual acuity in infants. DHA powder with a concentration of 10-20% ensures a potent and concentrated source of this essential nutrient, making it highly sought-after by parents and caregivers seeking optimal nutrition for their infants. The efficacy and bioavailability of DHA in this content range are crucial for providing meaningful health benefits, such as cognitive support, visual acuity, and overall development. Additionally, regulatory guidelines and recommendations emphasizing the importance of DHA in infant nutrition further drive the demand for DHA-fortified formulas in this segment. As parents prioritize the health and development of their infants, the Content 10-20% DHA Powder segment remains at the forefront, driving market growth and innovation in the DHA Powder in Infant Formula Market.
DHA Powder in Infant Formula Market Share Analysis: 0 to 12 Months Age Group is the fastest growing segment over the forecast period to 2032
The 0 to 12 Months Age Group segment within the DHA Powder in Infant Formula Market emerges as the fastest-growing category projected to experience substantial growth by 2032. This surge is driven by several key factors. Firstly, the first year of life is critical for infant growth, development, and brain formation, making it a period where nutritional requirements are paramount. DHA (docosahexaenoic acid), an essential omega-3 fatty acid, plays a vital role in supporting brain development, cognitive function, and visual acuity during infancy. DHA powder formulated specifically for the 0 to 12 months age group ensures a potent and concentrated source of this essential nutrient, meeting the specific nutritional needs of infants during this critical phase. Additionally, parental awareness and education regarding the importance of DHA supplementation in infant diets contribute to the rising demand for DHA-fortified formulas in this age category. Further, regulatory support and recommendations emphasizing the benefits of DHA further drive the growth of this segment. As parents prioritize the health and well-being of their infants, the 0 to 12 Months Age Group of DHA powder in infant formula emerges as a pivotal segment driving market growth and innovation in the DHA Powder in Infant Formula Market.
DHA Powder in Infant Formula Market Segmentation
By Type
Content Below 10%
Content 10-20%
Others
By Age Group
0 to 12 Months
1 to 2 Years
Others
Countries Analyzed
North America (US, Canada, Mexico)
Europe (Germany, UK, France, Spain, Italy, Russia, Rest of Europe)
Asia Pacific (China, India, Japan, South Korea, Australia, South East Asia, Rest of Asia)
South America (Brazil, Argentina, Rest of South America)
Middle East and Africa (Saudi Arabia, UAE, Rest of Middle East, South Africa, Egypt, Rest of Africa)
DHA Powder in Infant Formula Companies Profiled in the Study
Arjuna Natural Pvt. Ltd.
Cabio Biotechnology (Wuhan) Co., Ltd.
Fuxing (Group) Co., Ltd.
Kingdomway Group Company
Lonza Group Ltd
Novotech Nutraceuticals, Inc.
Royal DSM N.V.
Runke Bioengineering Co., Ltd.
Stepan Company
Tianhecheng Biological Technology Co., Ltd.
Yidie Bioengineering Co., Ltd.
*- List Not Exhaustive
Chapter 1. TABLE OF CONTENTS
Chapter 2. Introduction to DHA Powder in Infant Formula Market
2.1. Market Overview
2.2. Key Statistics and Report Highlights
2.3. Scope of the Comprehensive Study
2.3.1. Market Definition
2.3.2 Countries and Regions Covered
2.3.3 Research Objective
2.3.4 Units, Currency, and Conversions
2.3.5 Industry Value Chain
2.4. Key Market Segments
2.5. Key Companies
2.6. Study Period
Chapter 3. Strategic Analysis Review
3.1. DHA Powder in Infant Formula Pricing Analysis and Forecast
3.2. Porter’s Five Forces
3.3. Market Ecosystem
3.4. SWOT Analysis
3.5. Regulatory Scenario
3.3. Effects of Inflation, Russia-Ukraine War, moderating economic growth, and other macroeconomic factors
Chapter 4. Competitive Landscape
4.1. Market Share Analysis
4.1.1. Global DHA Powder in Infant Formula Market Share by Company, 2023
4.1.2. Product Offerings of Leading DHA Powder in Infant Formula Companies
4.2. Market Entropy
4.2.1. New Product Launches in the Industry
4.2.2. Mergers, Acquisitions, Joint ventures, and Partnerships
4.3. Key Strategies and Best Practices
Chapter 5. Global Market Projections: Best, Reference, and Low Case Scenarios
5.1. Growth Analysis- Case Scenario Definitions
5.2. Low Growth Case Scenario Forecasts
5.3. Reference Growth Case Scenario Forecasts
5.4. High Growth Case Scenario Forecasts
Chapter 6. Market Dynamics
6.1. DHA Powder in Infant Formula Market Drivers
6.2. DHA Powder in Infant Formula Market Challenges
6.6. DHA Powder in Infant Formula Market Opportunities
6.4. DHA Powder in Infant Formula Market Trends
Chapter 7. Global DHA Powder in Infant Formula Market Outlook Trends
7.1. Global DHA Powder in Infant Formula Revenue (USD Million) and CAGR (%) by Type (2021-2032)
7.2. Global DHA Powder in Infant Formula Revenue (USD Million) and CAGR (%) by Application (2021-2032)
7.3. Global DHA Powder in Infant Formula Revenue (USD Million) and CAGR (%) by Product (2021-2032)
By Type
Content Below 10%
Content 10-20%
Others
By Age Group
0 to 12 Months
1 to 2 Years
Others
Chapter 8. Global DHA Powder in Infant Formula Regional Analysis and Outlook
8.1. Global DHA Powder in Infant Formula Revenue (USD Million) By Regions (2021- 2032)
8.2. North America DHA Powder in Infant Formula Revenue (USD Million) by Country (2021-2032)
8.2.1. United States DHA Powder in Infant Formula Regional Analysis and Outlook
8.2.2. Canada DHA Powder in Infant Formula Regional Analysis and Outlook
8.2.3. Mexico DHA Powder in Infant Formula Regional Analysis and Outlook
8.3. Europe DHA Powder in Infant Formula Revenue (USD Million), by Country (2021-2032)
8.3.1. Germany DHA Powder in Infant Formula Regional Analysis and Outlook
8.3.2. France DHA Powder in Infant Formula Regional Analysis and Outlook
8.3.3. United Kingdom DHA Powder in Infant Formula Regional Analysis and Outlook
8.3.4. Spain DHA Powder in Infant Formula Regional Analysis and Outlook
8.3.5. Italy DHA Powder in Infant Formula Regional Analysis and Outlook
8.3.6. Russia DHA Powder in Infant Formula Regional Analysis and Outlook
8.3.7. Rest of Europe DHA Powder in Infant Formula Regional Analysis and Outlook
8.4. Asia Pacific DHA Powder in Infant Formula Revenue (USD Million) by Country (2021-2032)
8.4.1. China DHA Powder in Infant Formula Regional Analysis and Outlook
8.4.2. Japan DHA Powder in Infant Formula Regional Analysis and Outlook
8.4.3. India DHA Powder in Infant Formula Regional Analysis and Outlook
8.4.4. South Korea DHA Powder in Infant Formula Regional Analysis and Outlook
8.4.5. Australia DHA Powder in Infant Formula Regional Analysis and Outlook
8.4.6. South East Asia DHA Powder in Infant Formula Regional Analysis and Outlook
8.4.7. Rest of Asia Pacific DHA Powder in Infant Formula Regional Analysis and Outlook
8.5. South America DHA Powder in Infant Formula Revenue (USD Million), by Country (2021-2032)
8.5.1. Brazil DHA Powder in Infant Formula Regional Analysis and Outlook
8.5.2. Argentina DHA Powder in Infant Formula Regional Analysis and Outlook
8.5.3. Rest of South America DHA Powder in Infant Formula Regional Analysis and Outlook
8.6. Middle East and Africa DHA Powder in Infant Formula Revenue (USD Million) by Country (2021-2032)
8.6.1. Middle East DHA Powder in Infant Formula Regional Analysis and Outlook
8.6.2. Africa DHA Powder in Infant Formula Regional Analysis and Outlook
Chapter 9. North America DHA Powder in Infant Formula Analysis and Outlook
9.1. North America DHA Powder in Infant Formula Revenue (USD Million) by Segments (2021-2032)
9.1.1. North America DHA Powder in Infant Formula Revenue (USD Million) by Type (2021-2032)
9.1.2. North America DHA Powder in Infant Formula Revenue (USD Million) by Application (2021-2032)
9.1.3. North America DHA Powder in Infant Formula Revenue (USD Million) by Product (2021-2032)
By Type
Content Below 10%
Content 10-20%
Others
By Age Group
0 to 12 Months
1 to 2 Years
Others
Chapter 10. Europe DHA Powder in Infant Formula Analysis and Outlook
10.1. Europe DHA Powder in Infant Formula Revenue (USD Million), by Segments (USD Million) (2021-2032)
10.1.1. Europe DHA Powder in Infant Formula Revenue (USD Million) by Type (2021-2032)
10.1.2. Europe DHA Powder in Infant Formula Revenue (USD Million) by Application (2021-2032)
10.1.3. Europe DHA Powder in Infant Formula Revenue (USD Million) by Product (2021-2032)
By Type
Content Below 10%
Content 10-20%
Others
By Age Group
0 to 12 Months
1 to 2 Years
Others
Chapter 11. Asia Pacific DHA Powder in Infant Formula Analysis and Outlook
11.1. Asia Pacific DHA Powder in Infant Formula Revenue (USD Million), and Revenue (USD Million) by Segments (2021-2032)
11.1.1. Asia Pacific DHA Powder in Infant Formula Revenue (USD Million) by Type (2021-2032)
11.1.2. Asia Pacific DHA Powder in Infant Formula Revenue (USD Million) by Application (2021-2032)
11.1.3. Asia Pacific DHA Powder in Infant Formula Revenue (USD Million) by Product (2021-2032)
By Type
Content Below 10%
Content 10-20%
Others
By Age Group
0 to 12 Months
1 to 2 Years
Others
Chapter 12. South America DHA Powder in Infant Formula Analysis and Outlook
12.1. South America DHA Powder in Infant Formula Revenue (USD Million), by Segments (2021-2032)
12.1.1. South America DHA Powder in Infant Formula Revenue (USD Million) by Type (2021-2032)
12.1.2. South America DHA Powder in Infant Formula Revenue (USD Million) by Application (2021-2032)
12.1.3. South America DHA Powder in Infant Formula Revenue (USD Million) by Product (2021-2032)
By Type
Content Below 10%
Content 10-20%
Others
By Age Group
0 to 12 Months
1 to 2 Years
Others
Chapter 13. Middle East and Africa DHA Powder in Infant Formula Analysis and Outlook
13.1. Middle East and Africa DHA Powder in Infant Formula Revenue (USD Million), by Segments (2021-2032)
13.1.1. Middle East and Africa DHA Powder in Infant Formula Revenue (USD Million) by Type (2021-2032)
13.1.2. Middle East and Africa DHA Powder in Infant Formula Revenue (USD Million) by Application (2021-2032)
13.1.3. Middle East and Africa DHA Powder in Infant Formula Revenue (USD Million) by Product (2021-2032)
By Type
Content Below 10%
Content 10-20%
Others
By Age Group
0 to 12 Months
1 to 2 Years
Others
Chapter 14. DHA Powder in Infant Formula Company Profiles
14.1 Business Overview
14.2 Product Profiles
14.3 SWOT Profiles
14.5 Recent Developments
14.6 Financial Profile
List of Companies
Arjuna Natural Pvt. Ltd.
Cabio Biotechnology (Wuhan) Co., Ltd.
Fuxing (Group) Co., Ltd.
Kingdomway Group Company
Lonza Group Ltd
Novotech Nutraceuticals, Inc.
Royal DSM N.V.
Runke Bioengineering Co., Ltd.
Stepan Company
Tianhecheng Biological Technology Co., Ltd.
Yidie Bioengineering Co., Ltd.
15. Methodology and Data Sources
15.1 Customization Offerings
15.2 Subscription Services
15.3 Related Reports
15.4 Publisher Expertise
LIST OF TABLES
Table 1 Market Segmentation Analysis
Table 2 Global DHA Powder in Infant Formula Market Share of Leading Companies, 2023
Table 3 Product Offerings of Leading Companies
Table 4 Low Growth Scenario Forecasts
Table 5 Reference Case Growth Scenario
Table 6 High Growth Case Scenario
Table 7 Global DHA Powder in Infant Formula Revenue (USD Million) And CAGR (%) By Type (2021-2032)
Table 8 Global DHA Powder in Infant Formula Revenue (USD Million) And CAGR (%) By Application (2021-2032)
Table 9 Global DHA Powder in Infant Formula Revenue (USD Million) And CAGR (%) By Product (2021-2032)
Table 10 Global DHA Powder in Infant Formula Market Revenue (USD Million) By Regions (2021-2032)
Table 11 Global DHA Powder in Infant Formula Market Share (%) By Regions (2021-2032)
Table 12 North America DHA Powder in Infant Formula Revenue (USD Million) By Country (2021-2032)
Table 13 Europe DHA Powder in Infant Formula Revenue (USD Million) By Country (2021-2032)
Table 14 Asia Pacific DHA Powder in Infant Formula Revenue (USD Million) By Country (2021-2032)
Table 15 South America DHA Powder in Infant Formula Revenue (USD Million) By Country (2021-2032)
Table 16 Middle East and Africa DHA Powder in Infant Formula Revenue (USD Million) By Region (2021-2032)
Table 17 North America DHA Powder in Infant Formula Revenue (USD Million) By Type (2021-2032)
Table 18 North America DHA Powder in Infant Formula Revenue (USD Million) By Application (2021-2032)
Table 19 North America DHA Powder in Infant Formula Revenue (USD Million) By Product (2021-2032)
Table 20 Europe DHA Powder in Infant Formula Revenue (USD Million) By Type (2021-2032)
Table 21 Europe DHA Powder in Infant Formula Revenue (USD Million) By Application (2021-2032)
Table 22 Europe DHA Powder in Infant Formula Revenue (USD Million) By Product (2021-2032)
Table 23 Asia Pacific DHA Powder in Infant Formula Revenue (USD Million) By Type (2021-2032)
Table 24 Asia Pacific DHA Powder in Infant Formula Revenue (USD Million) By Application (2021-2032)
Table 25 Asia Pacific DHA Powder in Infant Formula Revenue (USD Million) By Product (2021-2032)
Table 26 South America DHA Powder in Infant Formula Revenue (USD Million) By Type (2021-2032)
Table 27 South America DHA Powder in Infant Formula Revenue (USD Million) By Application (2021-2032)
Table 28 South America DHA Powder in Infant Formula Revenue (USD Million) By Product (2021-2032)
Table 29 Middle East and Africa DHA Powder in Infant Formula Revenue (USD Million) By Type (2021-2032)
Table 30 Middle East and Africa DHA Powder in Infant Formula Revenue (USD Million) By Application (2021-2032)
Table 31 Middle East and Africa DHA Powder in Infant Formula Revenue (USD Million) By Product (2021-2032)
LIST OF FIGURES
Figure 1. Market Scope
Figure 2. Pricing Forecasts Per Unit, 2023- 2032
Figure 3. Porter’s Five Forces
Figure 4. Global DHA Powder in Infant Formula Market Revenue (USD Million) By Regions (2021-2032)
Figure 5. Global DHA Powder in Infant Formula Market Share (%) By Regions (2023)
Figure 6. North America DHA Powder in Infant Formula Revenue (USD Million) By Country (2021-2032)
Figure 7. United States DHA Powder in Infant Formula Revenue (USD Million) By Country (2021-2032)
Figure 8. Canada DHA Powder in Infant Formula Revenue (USD Million) By Country (2021-2032)
Figure 9. Mexico DHA Powder in Infant Formula Revenue (USD Million) By Country (2021-2032)
Figure 10. Europe DHA Powder in Infant Formula Revenue (USD Million) By Country (2021-2032)
Figure 11. Germany DHA Powder in Infant Formula Revenue (USD Million) By Country (2021-2032)
Figure 12. France DHA Powder in Infant Formula Revenue (USD Million) By Country (2021-2032)
Figure 13. United Kingdom DHA Powder in Infant Formula Revenue (USD Million) By Country (2021-2032)
Figure 14. Spain DHA Powder in Infant Formula Revenue (USD Million) By Country (2021-2032)
Figure 15. Italy DHA Powder in Infant Formula Revenue (USD Million) By Country (2021-2032)
Figure 16. Russia DHA Powder in Infant Formula Revenue (USD Million) By Country (2021-2032)
Figure 17. Rest of Europe DHA Powder in Infant Formula Revenue (USD Million) By Country (2021-2032)
Figure 11. Asia Pacific DHA Powder in Infant Formula Revenue (USD Million) By Country (2021-2032)
Figure 12. China DHA Powder in Infant Formula Revenue (USD Million) By Country (2021-2032)
Figure 13. Japan DHA Powder in Infant Formula Revenue (USD Million) By Country (2021-2032)
Figure 14. India DHA Powder in Infant Formula Revenue (USD Million) By Country (2021-2032)
Figure 15. South Korea DHA Powder in Infant Formula Revenue (USD Million) By Country (2021-2032)
Figure 16. Australia DHA Powder in Infant Formula Revenue (USD Million) By Country (2021-2032)
Figure 17. South East Asia DHA Powder in Infant Formula Revenue (USD Million) By Country (2021-2032)
Figure 18. South America DHA Powder in Infant Formula Revenue (USD Million) By Country (2021-2032)
Figure 19. Brazil DHA Powder in Infant Formula Revenue (USD Million) By Country (2021-2032)
Figure 20. Argentina DHA Powder in Infant Formula Revenue (USD Million) By Country (2021-2032)
Figure 21. Rest of Asia Pacific DHA Powder in Infant Formula Revenue (USD Million) By Country (2021-2032)
Figure 22. Middle East and Africa DHA Powder in Infant Formula Revenue (USD Million) By Region (2021-2032)
Figure 23. Saudi Arabia DHA Powder in Infant Formula Revenue (USD Million) By Region (2021-2032)
Figure 24. The UAE DHA Powder in Infant Formula Revenue (USD Million) By Region (2021-2032)
Figure 25. Rest of Middle East DHA Powder in Infant Formula Revenue (USD Million) By Region (2021-2032)
Figure 26. South Africa DHA Powder in Infant Formula Revenue (USD Million) By Region (2021-2032)
Figure 27. Africa DHA Powder in Infant Formula Revenue (USD Million) By Region (2021-2032)
Figure 28. North America DHA Powder in Infant Formula Revenue (USD Million) By Type (2021-2032)
Figure 29. North America DHA Powder in Infant Formula Revenue (USD Million) By Application (2021-2032)
Figure 30. North America DHA Powder in Infant Formula Revenue (USD Million) By Product (2021-2032)
Figure 31. Europe DHA Powder in Infant Formula Revenue (USD Million) By Type (2021-2032)
Figure 32. Europe DHA Powder in Infant Formula Revenue (USD Million) By Application (2021-2032)
Figure 33. Europe DHA Powder in Infant Formula Revenue (USD Million) By Product (2021-2032)
Figure 34. Asia Pacific DHA Powder in Infant Formula Revenue (USD Million) By Type (2021-2032)
Figure 35. Asia Pacific DHA Powder in Infant Formula Revenue (USD Million) By Application (2021-2032)
Figure 36. Asia Pacific DHA Powder in Infant Formula Revenue (USD Million) By Product (2021-2032)
Figure 37. South America DHA Powder in Infant Formula Revenue (USD Million) By Type (2021-2032)
Figure 38. South America DHA Powder in Infant Formula Revenue (USD Million) By Application (2021-2032)
Figure 39. South America DHA Powder in Infant Formula Revenue (USD Million) By Product (2021-2032)
Figure 40. Middle East and Africa DHA Powder in Infant Formula Revenue (USD Million) By Type (2021-2032)
Figure 41. Middle East and Africa DHA Powder in Infant Formula Revenue (USD Million) By Application (2021-2032)
Figure 42. Middle East and Africa DHA Powder in Infant Formula Revenue (USD Million) By Product (2021-2032)
By Type
Content Below 10%
Content 10-20%
Others
By Age Group
0 to 12 Months
1 to 2 Years
Others
Countries Analyzed
North America (US, Canada, Mexico)
Europe (Germany, UK, France, Spain, Italy, Russia, Rest of Europe)
Asia Pacific (China, India, Japan, South Korea, Australia, South East Asia, Rest of Asia)
South America (Brazil, Argentina, Rest of South America)
Middle East and Africa (Saudi Arabia, UAE, Rest of Middle East, South Africa, Egypt, Rest of Africa)
