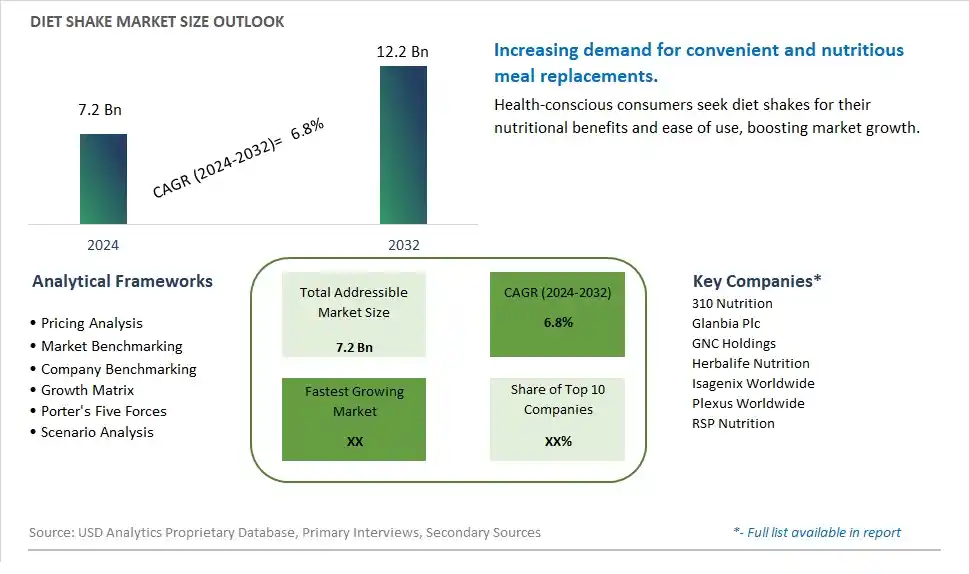
Global Diet Shake Market Size is valued at $7.2 Billion in 2024 and is forecast to register a growth rate (CAGR) of 6.8% to reach $12.2 Billion by 2032.
The global Diet Shake Market Comprehensive Study analyzes and forecasts the market size across 6 regions and 24 countries for diverse segments -By Type (Organic, Conventional), By Distribution Channel (Supermarket/Hypermarket, Specialty Retailers, Convenience Stores, Online Retail, Others)
An Introduction to Diet Shake Market
The Diet Shake market in 2024 is expanding rapidly, driven by the increasing demand for convenient, nutritious, and weight management solutions. Diet shakes, formulated with a balanced blend of proteins, fibers, vitamins, and minerals, are used as meal replacements or supplements to support weight loss and overall health. The market is supported by the growing trend towards health and wellness and the demand for easy-to-consume nutritional products. Advances in formulation and packaging technologies are enhancing the taste, nutritional profile, and shelf life of diet shakes. The market is also benefiting from the trend towards clean-label and functional ingredients, appealing to health-conscious consumers seeking effective and convenient diet solutions.
Diet Shake Competitive Landscape
The market report analyses the leading companies in the industry including 310 Nutrition, Glanbia Plc, GNC Holdings, Herbalife Nutrition, Isagenix Worldwide, Plexus Worldwide, RSP Nutrition, and Others.
Diet Shake Market Dynamics
Diet Shake Market Trend: Increasing Focus on Health and Weight Management
A prominent trend in the diet shake market is the increasing focus on health and weight management among consumers. With growing concerns about obesity, lifestyle-related diseases, and the desire for healthier lifestyles, more individuals are turning to diet shakes as a convenient and effective way to support their weight loss or weight management goals. This trend is driven by the recognition of the role of nutrition in overall well-being, leading consumers to seek meal replacement options that are low in calories, high in nutrients, and convenient for on-the-go consumption.
Diet Shake Market Driver: Demand for Convenient and Nutrient-Dense Meal Replacement Options
A key driver influencing the diet shake market is the demand for convenient and nutrient-dense meal replacement options. Busy lifestyles, hectic schedules, and a desire for quick and easy meal solutions drive consumers to seek diet shakes that offer a balanced nutritional profile, including protein, vitamins, minerals, and fiber, while being low in sugar and calories. The convenience factor of diet shakes, combined with their ability to provide essential nutrients and support weight management efforts, fuels their popularity among health-conscious individuals seeking convenient and effective meal solutions.
Diet Shake Market Opportunity: Innovation in Functional Ingredients and Targeted Formulations
An exciting opportunity in the diet shake market lies in innovation in functional ingredients and targeted formulations. There is potential to develop diet shakes with added functional ingredients such as probiotics, prebiotics, antioxidants, and metabolism-boosting compounds to enhance their health benefits and appeal to specific consumer needs. Additionally, there is an opportunity to create targeted formulations for different dietary preferences and goals, such as vegan, gluten-free, keto-friendly, or low-carb diet shakes, catering to a diverse range of consumers with varying nutritional requirements and preferences. This opportunity allows companies to differentiate their diet shakes, meet the evolving demands of health-conscious consumers, and capitalize on the growing market for convenient and nutritious meal replacement options.
Diet Shake Market Share Analysis: Conventional Type segment generated the highest revenue share in the industry
The Conventional Type segment stands out as the largest category in the Diet Shake Market, showcasing steady growth driven by its wide accessibility and established demand among consumers. Conventional diet shakes are formulated with standard ingredients and production methods, making them readily available in the market and familiar to consumers. These shakes cater to individuals seeking convenient and affordable options for weight management and nutritional supplementation. Additionally, the established presence of conventional diet shakes in retail outlets, online platforms, and fitness centers contributes to their popularity and market dominance. While organic diet shakes appeal to health-conscious consumers looking for natural and sustainable options, the conventional type maintains a larger share of the market due to its affordability and widespread availability. As consumers continue to prioritize health and wellness, the Conventional Type segment of diet shakes remains a key player in meeting the diverse needs of individuals seeking balanced nutrition and weight management solutions.
Diet Shake Market Share Analysis: Online Retail Distribution Channel is the fastest growing segment over the forecast period to 2032
The Online Retail Distribution Channel segment within the Diet Shake Market emerges as the fastest-growing category projected to experience substantial growth by 2032. This surge is driven by several key factors. Firstly, the digital transformation of the retail landscape has led to a significant shift in consumer shopping behavior, with more individuals opting for online purchases due to convenience, variety, and accessibility. The convenience of ordering diet shakes online and having them delivered to one's doorstep appeals to busy consumers seeking efficient ways to manage their nutrition and wellness goals. Additionally, online retail platforms offer a wide range of diet shake options, including specialty and niche products, catering to diverse dietary preferences and needs. Further, the Past few yearshas accelerated the adoption of online shopping as consumers prioritize safety and social distancing measures. As e-commerce continues to evolve and expand globally, the Online Retail Distribution Channel of diet shakes emerges as a pivotal segment driving market growth and meeting the changing preferences of consumers in the digital age.
Diet Shake Market Segmentation
By Type
Organic
Conventional
By Distribution Channel
Supermarket/Hypermarket
Specialty Retailers
Convenience Stores
Online Retail
Others
Countries Analyzed
North America (US, Canada, Mexico)
Europe (Germany, UK, France, Spain, Italy, Russia, Rest of Europe)
Asia Pacific (China, India, Japan, South Korea, Australia, South East Asia, Rest of Asia)
South America (Brazil, Argentina, Rest of South America)
Middle East and Africa (Saudi Arabia, UAE, Rest of Middle East, South Africa, Egypt, Rest of Africa)
Diet Shake Companies Profiled in the Study
310 Nutrition
Glanbia Plc
GNC Holdings
Herbalife Nutrition
Isagenix Worldwide
Plexus Worldwide
RSP Nutrition
*- List Not Exhaustive
Chapter 1. TABLE OF CONTENTS
Chapter 2. Introduction to Diet Shake Market
2.1. Market Overview
2.2. Key Statistics and Report Highlights
2.3. Scope of the Comprehensive Study
2.3.1. Market Definition
2.3.2 Countries and Regions Covered
2.3.3 Research Objective
2.3.4 Units, Currency, and Conversions
2.3.5 Industry Value Chain
2.4. Key Market Segments
2.5. Key Companies
2.6. Study Period
Chapter 3. Strategic Analysis Review
3.1. Diet Shake Pricing Analysis and Forecast
3.2. Porter’s Five Forces
3.3. Market Ecosystem
3.4. SWOT Analysis
3.5. Regulatory Scenario
3.3. Effects of Inflation, Russia-Ukraine War, moderating economic growth, and other macroeconomic factors
Chapter 4. Competitive Landscape
4.1. Market Share Analysis
4.1.1. Global Diet Shake Market Share by Company, 2023
4.1.2. Product Offerings of Leading Diet Shake Companies
4.2. Market Entropy
4.2.1. New Product Launches in the Industry
4.2.2. Mergers, Acquisitions, Joint ventures, and Partnerships
4.3. Key Strategies and Best Practices
Chapter 5. Global Market Projections: Best, Reference, and Low Case Scenarios
5.1. Growth Analysis- Case Scenario Definitions
5.2. Low Growth Case Scenario Forecasts
5.3. Reference Growth Case Scenario Forecasts
5.4. High Growth Case Scenario Forecasts
Chapter 6. Market Dynamics
6.1. Diet Shake Market Drivers
6.2. Diet Shake Market Challenges
6.6. Diet Shake Market Opportunities
6.4. Diet Shake Market Trends
Chapter 7. Global Diet Shake Market Outlook Trends
7.1. Global Diet Shake Revenue (USD Million) and CAGR (%) by Type (2021-2032)
7.2. Global Diet Shake Revenue (USD Million) and CAGR (%) by Application (2021-2032)
7.3. Global Diet Shake Revenue (USD Million) and CAGR (%) by Product (2021-2032)
By Type
Organic
Conventional
By Distribution Channel
Supermarket/Hypermarket
Specialty Retailers
Convenience Stores
Online Retail
Others
Chapter 8. Global Diet Shake Regional Analysis and Outlook
8.1. Global Diet Shake Revenue (USD Million) By Regions (2021- 2032)
8.2. North America Diet Shake Revenue (USD Million) by Country (2021-2032)
8.2.1. United States Diet Shake Regional Analysis and Outlook
8.2.2. Canada Diet Shake Regional Analysis and Outlook
8.2.3. Mexico Diet Shake Regional Analysis and Outlook
8.3. Europe Diet Shake Revenue (USD Million), by Country (2021-2032)
8.3.1. Germany Diet Shake Regional Analysis and Outlook
8.3.2. France Diet Shake Regional Analysis and Outlook
8.3.3. United Kingdom Diet Shake Regional Analysis and Outlook
8.3.4. Spain Diet Shake Regional Analysis and Outlook
8.3.5. Italy Diet Shake Regional Analysis and Outlook
8.3.6. Russia Diet Shake Regional Analysis and Outlook
8.3.7. Rest of Europe Diet Shake Regional Analysis and Outlook
8.4. Asia Pacific Diet Shake Revenue (USD Million) by Country (2021-2032)
8.4.1. China Diet Shake Regional Analysis and Outlook
8.4.2. Japan Diet Shake Regional Analysis and Outlook
8.4.3. India Diet Shake Regional Analysis and Outlook
8.4.4. South Korea Diet Shake Regional Analysis and Outlook
8.4.5. Australia Diet Shake Regional Analysis and Outlook
8.4.6. South East Asia Diet Shake Regional Analysis and Outlook
8.4.7. Rest of Asia Pacific Diet Shake Regional Analysis and Outlook
8.5. South America Diet Shake Revenue (USD Million), by Country (2021-2032)
8.5.1. Brazil Diet Shake Regional Analysis and Outlook
8.5.2. Argentina Diet Shake Regional Analysis and Outlook
8.5.3. Rest of South America Diet Shake Regional Analysis and Outlook
8.6. Middle East and Africa Diet Shake Revenue (USD Million) by Country (2021-2032)
8.6.1. Middle East Diet Shake Regional Analysis and Outlook
8.6.2. Africa Diet Shake Regional Analysis and Outlook
Chapter 9. North America Diet Shake Analysis and Outlook
9.1. North America Diet Shake Revenue (USD Million) by Segments (2021-2032)
9.1.1. North America Diet Shake Revenue (USD Million) by Type (2021-2032)
9.1.2. North America Diet Shake Revenue (USD Million) by Application (2021-2032)
9.1.3. North America Diet Shake Revenue (USD Million) by Product (2021-2032)
By Type
Organic
Conventional
By Distribution Channel
Supermarket/Hypermarket
Specialty Retailers
Convenience Stores
Online Retail
Others
Chapter 10. Europe Diet Shake Analysis and Outlook
10.1. Europe Diet Shake Revenue (USD Million), by Segments (USD Million) (2021-2032)
10.1.1. Europe Diet Shake Revenue (USD Million) by Type (2021-2032)
10.1.2. Europe Diet Shake Revenue (USD Million) by Application (2021-2032)
10.1.3. Europe Diet Shake Revenue (USD Million) by Product (2021-2032)
By Type
Organic
Conventional
By Distribution Channel
Supermarket/Hypermarket
Specialty Retailers
Convenience Stores
Online Retail
Others
Chapter 11. Asia Pacific Diet Shake Analysis and Outlook
11.1. Asia Pacific Diet Shake Revenue (USD Million), and Revenue (USD Million) by Segments (2021-2032)
11.1.1. Asia Pacific Diet Shake Revenue (USD Million) by Type (2021-2032)
11.1.2. Asia Pacific Diet Shake Revenue (USD Million) by Application (2021-2032)
11.1.3. Asia Pacific Diet Shake Revenue (USD Million) by Product (2021-2032)
By Type
Organic
Conventional
By Distribution Channel
Supermarket/Hypermarket
Specialty Retailers
Convenience Stores
Online Retail
Others
Chapter 12. South America Diet Shake Analysis and Outlook
12.1. South America Diet Shake Revenue (USD Million), by Segments (2021-2032)
12.1.1. South America Diet Shake Revenue (USD Million) by Type (2021-2032)
12.1.2. South America Diet Shake Revenue (USD Million) by Application (2021-2032)
12.1.3. South America Diet Shake Revenue (USD Million) by Product (2021-2032)
By Type
Organic
Conventional
By Distribution Channel
Supermarket/Hypermarket
Specialty Retailers
Convenience Stores
Online Retail
Others
Chapter 13. Middle East and Africa Diet Shake Analysis and Outlook
13.1. Middle East and Africa Diet Shake Revenue (USD Million), by Segments (2021-2032)
13.1.1. Middle East and Africa Diet Shake Revenue (USD Million) by Type (2021-2032)
13.1.2. Middle East and Africa Diet Shake Revenue (USD Million) by Application (2021-2032)
13.1.3. Middle East and Africa Diet Shake Revenue (USD Million) by Product (2021-2032)
By Type
Organic
Conventional
By Distribution Channel
Supermarket/Hypermarket
Specialty Retailers
Convenience Stores
Online Retail
Others
Chapter 14. Diet Shake Company Profiles
14.1 Business Overview
14.2 Product Profiles
14.3 SWOT Profiles
14.5 Recent Developments
14.6 Financial Profile
List of Companies
310 Nutrition
Glanbia Plc
GNC Holdings
Herbalife Nutrition
Isagenix Worldwide
Plexus Worldwide
RSP Nutrition
15. Methodology and Data Sources
15.1 Customization Offerings
15.2 Subscription Services
15.3 Related Reports
15.4 Publisher Expertise
LIST OF TABLES
Table 1 Market Segmentation Analysis
Table 2 Global Diet Shake Market Share of Leading Companies, 2023
Table 3 Product Offerings of Leading Companies
Table 4 Low Growth Scenario Forecasts
Table 5 Reference Case Growth Scenario
Table 6 High Growth Case Scenario
Table 7 Global Diet Shake Revenue (USD Million) And CAGR (%) By Type (2021-2032)
Table 8 Global Diet Shake Revenue (USD Million) And CAGR (%) By Application (2021-2032)
Table 9 Global Diet Shake Revenue (USD Million) And CAGR (%) By Product (2021-2032)
Table 10 Global Diet Shake Market Revenue (USD Million) By Regions (2021-2032)
Table 11 Global Diet Shake Market Share (%) By Regions (2021-2032)
Table 12 North America Diet Shake Revenue (USD Million) By Country (2021-2032)
Table 13 Europe Diet Shake Revenue (USD Million) By Country (2021-2032)
Table 14 Asia Pacific Diet Shake Revenue (USD Million) By Country (2021-2032)
Table 15 South America Diet Shake Revenue (USD Million) By Country (2021-2032)
Table 16 Middle East and Africa Diet Shake Revenue (USD Million) By Region (2021-2032)
Table 17 North America Diet Shake Revenue (USD Million) By Type (2021-2032)
Table 18 North America Diet Shake Revenue (USD Million) By Application (2021-2032)
Table 19 North America Diet Shake Revenue (USD Million) By Product (2021-2032)
Table 20 Europe Diet Shake Revenue (USD Million) By Type (2021-2032)
Table 21 Europe Diet Shake Revenue (USD Million) By Application (2021-2032)
Table 22 Europe Diet Shake Revenue (USD Million) By Product (2021-2032)
Table 23 Asia Pacific Diet Shake Revenue (USD Million) By Type (2021-2032)
Table 24 Asia Pacific Diet Shake Revenue (USD Million) By Application (2021-2032)
Table 25 Asia Pacific Diet Shake Revenue (USD Million) By Product (2021-2032)
Table 26 South America Diet Shake Revenue (USD Million) By Type (2021-2032)
Table 27 South America Diet Shake Revenue (USD Million) By Application (2021-2032)
Table 28 South America Diet Shake Revenue (USD Million) By Product (2021-2032)
Table 29 Middle East and Africa Diet Shake Revenue (USD Million) By Type (2021-2032)
Table 30 Middle East and Africa Diet Shake Revenue (USD Million) By Application (2021-2032)
Table 31 Middle East and Africa Diet Shake Revenue (USD Million) By Product (2021-2032)
LIST OF FIGURES
Figure 1. Market Scope
Figure 2. Pricing Forecasts Per Unit, 2023- 2032
Figure 3. Porter’s Five Forces
Figure 4. Global Diet Shake Market Revenue (USD Million) By Regions (2021-2032)
Figure 5. Global Diet Shake Market Share (%) By Regions (2023)
Figure 6. North America Diet Shake Revenue (USD Million) By Country (2021-2032)
Figure 7. United States Diet Shake Revenue (USD Million) By Country (2021-2032)
Figure 8. Canada Diet Shake Revenue (USD Million) By Country (2021-2032)
Figure 9. Mexico Diet Shake Revenue (USD Million) By Country (2021-2032)
Figure 10. Europe Diet Shake Revenue (USD Million) By Country (2021-2032)
Figure 11. Germany Diet Shake Revenue (USD Million) By Country (2021-2032)
Figure 12. France Diet Shake Revenue (USD Million) By Country (2021-2032)
Figure 13. United Kingdom Diet Shake Revenue (USD Million) By Country (2021-2032)
Figure 14. Spain Diet Shake Revenue (USD Million) By Country (2021-2032)
Figure 15. Italy Diet Shake Revenue (USD Million) By Country (2021-2032)
Figure 16. Russia Diet Shake Revenue (USD Million) By Country (2021-2032)
Figure 17. Rest of Europe Diet Shake Revenue (USD Million) By Country (2021-2032)
Figure 11. Asia Pacific Diet Shake Revenue (USD Million) By Country (2021-2032)
Figure 12. China Diet Shake Revenue (USD Million) By Country (2021-2032)
Figure 13. Japan Diet Shake Revenue (USD Million) By Country (2021-2032)
Figure 14. India Diet Shake Revenue (USD Million) By Country (2021-2032)
Figure 15. South Korea Diet Shake Revenue (USD Million) By Country (2021-2032)
Figure 16. Australia Diet Shake Revenue (USD Million) By Country (2021-2032)
Figure 17. South East Asia Diet Shake Revenue (USD Million) By Country (2021-2032)
Figure 18. South America Diet Shake Revenue (USD Million) By Country (2021-2032)
Figure 19. Brazil Diet Shake Revenue (USD Million) By Country (2021-2032)
Figure 20. Argentina Diet Shake Revenue (USD Million) By Country (2021-2032)
Figure 21. Rest of Asia Pacific Diet Shake Revenue (USD Million) By Country (2021-2032)
Figure 22. Middle East and Africa Diet Shake Revenue (USD Million) By Region (2021-2032)
Figure 23. Saudi Arabia Diet Shake Revenue (USD Million) By Region (2021-2032)
Figure 24. The UAE Diet Shake Revenue (USD Million) By Region (2021-2032)
Figure 25. Rest of Middle East Diet Shake Revenue (USD Million) By Region (2021-2032)
Figure 26. South Africa Diet Shake Revenue (USD Million) By Region (2021-2032)
Figure 27. Africa Diet Shake Revenue (USD Million) By Region (2021-2032)
Figure 28. North America Diet Shake Revenue (USD Million) By Type (2021-2032)
Figure 29. North America Diet Shake Revenue (USD Million) By Application (2021-2032)
Figure 30. North America Diet Shake Revenue (USD Million) By Product (2021-2032)
Figure 31. Europe Diet Shake Revenue (USD Million) By Type (2021-2032)
Figure 32. Europe Diet Shake Revenue (USD Million) By Application (2021-2032)
Figure 33. Europe Diet Shake Revenue (USD Million) By Product (2021-2032)
Figure 34. Asia Pacific Diet Shake Revenue (USD Million) By Type (2021-2032)
Figure 35. Asia Pacific Diet Shake Revenue (USD Million) By Application (2021-2032)
Figure 36. Asia Pacific Diet Shake Revenue (USD Million) By Product (2021-2032)
Figure 37. South America Diet Shake Revenue (USD Million) By Type (2021-2032)
Figure 38. South America Diet Shake Revenue (USD Million) By Application (2021-2032)
Figure 39. South America Diet Shake Revenue (USD Million) By Product (2021-2032)
Figure 40. Middle East and Africa Diet Shake Revenue (USD Million) By Type (2021-2032)
Figure 41. Middle East and Africa Diet Shake Revenue (USD Million) By Application (2021-2032)
Figure 42. Middle East and Africa Diet Shake Revenue (USD Million) By Product (2021-2032)
By Type
Organic
Conventional
By Distribution Channel
Supermarket/Hypermarket
Specialty Retailers
Convenience Stores
Online Retail
Others
Countries Analyzed
North America (US, Canada, Mexico)
Europe (Germany, UK, France, Spain, Italy, Russia, Rest of Europe)
Asia Pacific (China, India, Japan, South Korea, Australia, South East Asia, Rest of Asia)
South America (Brazil, Argentina, Rest of South America)
Middle East and Africa (Saudi Arabia, UAE, Rest of Middle East, South Africa, Egypt, Rest of Africa)
