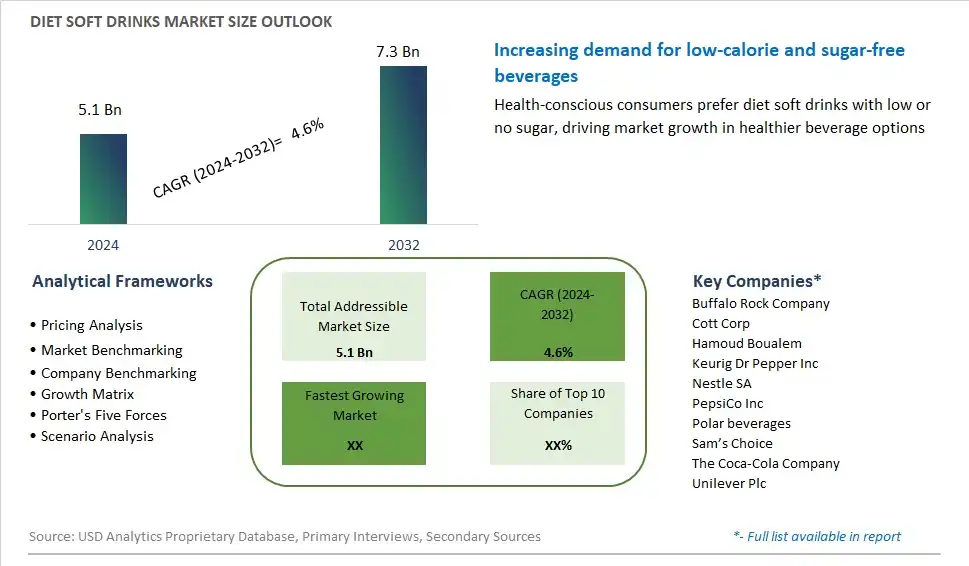
Global Diet Soft Drinks Market Size is valued at $5.1 Billion in 2024 and is forecast to register a growth rate (CAGR) of 4.6% to reach $7.3 Billion by 2032.
The global Diet Soft Drinks Market Comprehensive Study analyzes and forecasts the market size across 6 regions and 24 countries for diverse segments -By Distribution Channel (Supermarkets & General Merchandise, Convenience store, Food Service & Drinking Places, Online), By Product (Zero Calorie, Low Calorie)
An Introduction to Diet Soft Drinks Market
The diet soft drinks market in 2024 is experiencing steady growth as consumers continue to seek low-calorie and sugar-free beverage options. Diet soft drinks, sweetened with artificial or natural non-caloric sweeteners, offer the familiar taste of regular soft drinks without the added sugar and calories. This market is driven by the increasing awareness of the health risks associated with excessive sugar consumption, including obesity, diabetes, and heart disease. Innovations in sweetener technology and flavor development are enhancing the taste and appeal of diet soft drinks, making them more palatable to a wider audience. Additionally, the trend towards functional beverages is influencing the market, with manufacturers introducing diet soft drinks fortified with vitamins, minerals, and other health-promoting ingredients. The growing focus on sustainability and eco-friendly packaging is also shaping the market, as consumers seek out beverages that align with their environmental values.
Diet Soft Drinks Competitive Landscape
The market report analyses the leading companies in the industry including Buffalo Rock Company, Cott Corp, Hamoud Boualem, Keurig Dr Pepper Inc, Nestle SA, PepsiCo Inc, Polar beverages, Sam’s Choice, The Coca-Cola Company, Unilever Plc, and Others.
Diet Soft Drinks Market Dynamics
Diet Soft Drinks Market Trend: Increasing Demand for Low-Calorie and Sugar-Free Beverages
One of the most prominent trends in the diet soft drinks market is the increasing demand for low-calorie and sugar-free beverages. As consumers become more health-conscious and mindful of their dietary choices, there is a growing preference for beverages that offer reduced calories and sugar content without sacrificing taste. This trend is driven by rising concerns about obesity, diabetes, and other health conditions associated with excessive sugar consumption, prompting individuals to seek healthier alternatives to traditional sugary sodas. Diet soft drinks, formulated with artificial sweeteners or natural zero-calorie sweeteners, provide a guilt-free option for consumers looking to enjoy refreshing carbonated beverages without the added calories and sugar. Additionally, diet soft drinks often feature zero or low levels of carbohydrates, making them suitable for individuals following low-carb or ketogenic diets. As health and wellness continue to be top priorities for consumers, the demand for diet soft drinks is expected to grow, driving innovation and expansion in the market.
Market Driver: Weight Management and Dietary Preferences
The primary driver of the diet soft drinks market is the focus on weight management and dietary preferences among consumers. With increasing rates of obesity and overweight individuals worldwide, there is a growing emphasis on reducing calorie intake and making healthier beverage choices to support weight loss or weight maintenance goals. Diet soft drinks offer a convenient and satisfying option for individuals looking to limit their calorie consumption while still enjoying the refreshing taste of carbonated beverages. Moreover, diet soft drinks appeal to individuals with diabetes or those who need to monitor their blood sugar levels, as they provide a sugar-free alternative to traditional sodas. The availability of diet soft drinks in various flavors and formulations allows consumers to find options that align with their taste preferences and dietary needs, driving continued demand for these beverages in the market.
Market Opportunity: Innovation in Natural Ingredients and Flavor Profiles
A significant opportunity for the diet soft drinks market lies in innovation in natural ingredients and flavor profiles. While diet soft drinks traditionally relied on artificial sweeteners to achieve low-calorie and sugar-free formulations, there is growing consumer demand for products made with natural ingredients and clean label formulations. Manufacturers can capitalize on this opportunity by developing diet soft drinks using natural zero-calorie sweeteners such as stevia, monk fruit extract, or erythritol, which offer sweetness without the calories or negative health effects associated with artificial sweeteners. Additionally, there is an opportunity to innovate in flavor profiles by incorporating natural fruit extracts, botanicals, and herbal infusions to enhance the taste and aroma of diet soft drinks. By offering beverages made with natural ingredients and appealing flavor combinations, diet soft drink brands can attract health-conscious consumers seeking clean label products while maintaining the low-calorie and sugar-free attributes that make them popular choices for weight management and dietary preferences.
Diet Soft Drinks Market Share Analysis: Supermarkets & General Merchandise held the dominant market share in 2024
Within the Diet Soft Drinks Market, the supermarkets & general merchandise segment is the largest, holding a significant share of the industry. This dominance can be attributed to several key factors, including consumer accessibility, product availability, and convenience. Supermarkets and general merchandise stores serve as major retail channels for diet soft drinks, offering a diverse range of brands, flavors, and packaging options to cater to varying consumer preferences. These retail outlets provide a convenient shopping experience, allowing consumers to easily browse and select diet soft drinks alongside other grocery items during their routine shopping trips. Further, supermarkets and general merchandise stores often feature promotional displays, discounts, and bulk purchase options, further driving sales and consumer engagement. Additionally, the widespread presence of supermarkets and general merchandise stores in urban and rural areas ensures broad market coverage and accessibility for consumers seeking diet soft drinks. As consumer demand for low-calorie and sugar-free beverage options continues to rise, fueled by health-consciousness and weight management efforts, the supermarkets & general merchandise segment is expected to maintain its stronghold in the Diet Soft Drinks Market, driving market growth and innovation.
Diet Soft Drinks Market Segmentation
By Distribution Channel
Supermarkets & General Merchandise
Convenience store
Food Service & Drinking Places
Online
By Product
Zero Calorie
Low Calorie
Countries Analyzed
North America (US, Canada, Mexico)
Europe (Germany, UK, France, Spain, Italy, Russia, Rest of Europe)
Asia Pacific (China, India, Japan, South Korea, Australia, South East Asia, Rest of Asia)
South America (Brazil, Argentina, Rest of South America)
Middle East and Africa (Saudi Arabia, UAE, Rest of Middle East, South Africa, Egypt, Rest of Africa)
Diet Soft Drinks Companies Profiled in the Study
Buffalo Rock Company
Cott Corp
Hamoud Boualem
Keurig Dr Pepper Inc
Nestle SA
PepsiCo Inc
Polar beverages
Sam’s Choice
The Coca-Cola Company
Unilever Plc
*- List Not Exhaustive
Chapter 1. TABLE OF CONTENTS
Chapter 2. Introduction to Diet Soft Drinks Market
2.1. Market Overview
2.2. Key Statistics and Report Highlights
2.3. Scope of the Comprehensive Study
2.3.1. Market Definition
2.3.2 Countries and Regions Covered
2.3.3 Research Objective
2.3.4 Units, Currency, and Conversions
2.3.5 Industry Value Chain
2.4. Key Market Segments
2.5. Key Companies
2.6. Study Period
Chapter 3. Strategic Analysis Review
3.1. Diet Soft Drinks Pricing Analysis and Forecast
3.2. Porter’s Five Forces
3.3. Market Ecosystem
3.4. SWOT Analysis
3.5. Regulatory Scenario
3.3. Effects of Inflation, Russia-Ukraine War, moderating economic growth, and other macroeconomic factors
Chapter 4. Competitive Landscape
4.1. Market Share Analysis
4.1.1. Global Diet Soft Drinks Market Share by Company, 2023
4.1.2. Product Offerings of Leading Diet Soft Drinks Companies
4.2. Market Entropy
4.2.1. New Product Launches in the Industry
4.2.2. Mergers, Acquisitions, Joint ventures, and Partnerships
4.3. Key Strategies and Best Practices
Chapter 5. Global Market Projections: Best, Reference, and Low Case Scenarios
5.1. Growth Analysis- Case Scenario Definitions
5.2. Low Growth Case Scenario Forecasts
5.3. Reference Growth Case Scenario Forecasts
5.4. High Growth Case Scenario Forecasts
Chapter 6. Market Dynamics
6.1. Diet Soft Drinks Market Drivers
6.2. Diet Soft Drinks Market Challenges
6.6. Diet Soft Drinks Market Opportunities
6.4. Diet Soft Drinks Market Trends
Chapter 7. Global Diet Soft Drinks Market Outlook Trends
7.1. Global Diet Soft Drinks Revenue (USD Million) and CAGR (%) by Type (2021-2032)
7.2. Global Diet Soft Drinks Revenue (USD Million) and CAGR (%) by Application (2021-2032)
7.3. Global Diet Soft Drinks Revenue (USD Million) and CAGR (%) by Product (2021-2032)
By Distribution Channel
Supermarkets & General Merchandise
Convenience store
Food Service & Drinking Places
Online
By Product
Zero Calorie
Low Calorie
Chapter 8. Global Diet Soft Drinks Regional Analysis and Outlook
8.1. Global Diet Soft Drinks Revenue (USD Million) By Regions (2021- 2032)
8.2. North America Diet Soft Drinks Revenue (USD Million) by Country (2021-2032)
8.2.1. United States Diet Soft Drinks Regional Analysis and Outlook
8.2.2. Canada Diet Soft Drinks Regional Analysis and Outlook
8.2.3. Mexico Diet Soft Drinks Regional Analysis and Outlook
8.3. Europe Diet Soft Drinks Revenue (USD Million), by Country (2021-2032)
8.3.1. Germany Diet Soft Drinks Regional Analysis and Outlook
8.3.2. France Diet Soft Drinks Regional Analysis and Outlook
8.3.3. United Kingdom Diet Soft Drinks Regional Analysis and Outlook
8.3.4. Spain Diet Soft Drinks Regional Analysis and Outlook
8.3.5. Italy Diet Soft Drinks Regional Analysis and Outlook
8.3.6. Russia Diet Soft Drinks Regional Analysis and Outlook
8.3.7. Rest of Europe Diet Soft Drinks Regional Analysis and Outlook
8.4. Asia Pacific Diet Soft Drinks Revenue (USD Million) by Country (2021-2032)
8.4.1. China Diet Soft Drinks Regional Analysis and Outlook
8.4.2. Japan Diet Soft Drinks Regional Analysis and Outlook
8.4.3. India Diet Soft Drinks Regional Analysis and Outlook
8.4.4. South Korea Diet Soft Drinks Regional Analysis and Outlook
8.4.5. Australia Diet Soft Drinks Regional Analysis and Outlook
8.4.6. South East Asia Diet Soft Drinks Regional Analysis and Outlook
8.4.7. Rest of Asia Pacific Diet Soft Drinks Regional Analysis and Outlook
8.5. South America Diet Soft Drinks Revenue (USD Million), by Country (2021-2032)
8.5.1. Brazil Diet Soft Drinks Regional Analysis and Outlook
8.5.2. Argentina Diet Soft Drinks Regional Analysis and Outlook
8.5.3. Rest of South America Diet Soft Drinks Regional Analysis and Outlook
8.6. Middle East and Africa Diet Soft Drinks Revenue (USD Million) by Country (2021-2032)
8.6.1. Middle East Diet Soft Drinks Regional Analysis and Outlook
8.6.2. Africa Diet Soft Drinks Regional Analysis and Outlook
Chapter 9. North America Diet Soft Drinks Analysis and Outlook
9.1. North America Diet Soft Drinks Revenue (USD Million) by Segments (2021-2032)
9.1.1. North America Diet Soft Drinks Revenue (USD Million) by Type (2021-2032)
9.1.2. North America Diet Soft Drinks Revenue (USD Million) by Application (2021-2032)
9.1.3. North America Diet Soft Drinks Revenue (USD Million) by Product (2021-2032)
By Distribution Channel
Supermarkets & General Merchandise
Convenience store
Food Service & Drinking Places
Online
By Product
Zero Calorie
Low Calorie
Chapter 10. Europe Diet Soft Drinks Analysis and Outlook
10.1. Europe Diet Soft Drinks Revenue (USD Million), by Segments (USD Million) (2021-2032)
10.1.1. Europe Diet Soft Drinks Revenue (USD Million) by Type (2021-2032)
10.1.2. Europe Diet Soft Drinks Revenue (USD Million) by Application (2021-2032)
10.1.3. Europe Diet Soft Drinks Revenue (USD Million) by Product (2021-2032)
By Distribution Channel
Supermarkets & General Merchandise
Convenience store
Food Service & Drinking Places
Online
By Product
Zero Calorie
Low Calorie
Chapter 11. Asia Pacific Diet Soft Drinks Analysis and Outlook
11.1. Asia Pacific Diet Soft Drinks Revenue (USD Million), and Revenue (USD Million) by Segments (2021-2032)
11.1.1. Asia Pacific Diet Soft Drinks Revenue (USD Million) by Type (2021-2032)
11.1.2. Asia Pacific Diet Soft Drinks Revenue (USD Million) by Application (2021-2032)
11.1.3. Asia Pacific Diet Soft Drinks Revenue (USD Million) by Product (2021-2032)
By Distribution Channel
Supermarkets & General Merchandise
Convenience store
Food Service & Drinking Places
Online
By Product
Zero Calorie
Low Calorie
Chapter 12. South America Diet Soft Drinks Analysis and Outlook
12.1. South America Diet Soft Drinks Revenue (USD Million), by Segments (2021-2032)
12.1.1. South America Diet Soft Drinks Revenue (USD Million) by Type (2021-2032)
12.1.2. South America Diet Soft Drinks Revenue (USD Million) by Application (2021-2032)
12.1.3. South America Diet Soft Drinks Revenue (USD Million) by Product (2021-2032)
By Distribution Channel
Supermarkets & General Merchandise
Convenience store
Food Service & Drinking Places
Online
By Product
Zero Calorie
Low Calorie
Chapter 13. Middle East and Africa Diet Soft Drinks Analysis and Outlook
13.1. Middle East and Africa Diet Soft Drinks Revenue (USD Million), by Segments (2021-2032)
13.1.1. Middle East and Africa Diet Soft Drinks Revenue (USD Million) by Type (2021-2032)
13.1.2. Middle East and Africa Diet Soft Drinks Revenue (USD Million) by Application (2021-2032)
13.1.3. Middle East and Africa Diet Soft Drinks Revenue (USD Million) by Product (2021-2032)
By Distribution Channel
Supermarkets & General Merchandise
Convenience store
Food Service & Drinking Places
Online
By Product
Zero Calorie
Low Calorie
Chapter 14. Diet Soft Drinks Company Profiles
14.1 Business Overview
14.2 Product Profiles
14.3 SWOT Profiles
14.5 Recent Developments
14.6 Financial Profile
List of Companies
Buffalo Rock Company
Cott Corp
Hamoud Boualem
Keurig Dr Pepper Inc
Nestle SA
PepsiCo Inc
Polar beverages
Sam’s Choice
The Coca-Cola Company
Unilever Plc
15. Methodology and Data Sources
15.1 Customization Offerings
15.2 Subscription Services
15.3 Related Reports
15.4 Publisher Expertise
LIST OF TABLES
Table 1 Market Segmentation Analysis
Table 2 Global Diet Soft Drinks Market Share of Leading Companies, 2023
Table 3 Product Offerings of Leading Companies
Table 4 Low Growth Scenario Forecasts
Table 5 Reference Case Growth Scenario
Table 6 High Growth Case Scenario
Table 7 Global Diet Soft Drinks Revenue (USD Million) And CAGR (%) By Type (2021-2032)
Table 8 Global Diet Soft Drinks Revenue (USD Million) And CAGR (%) By Application (2021-2032)
Table 9 Global Diet Soft Drinks Revenue (USD Million) And CAGR (%) By Product (2021-2032)
Table 10 Global Diet Soft Drinks Market Revenue (USD Million) By Regions (2021-2032)
Table 11 Global Diet Soft Drinks Market Share (%) By Regions (2021-2032)
Table 12 North America Diet Soft Drinks Revenue (USD Million) By Country (2021-2032)
Table 13 Europe Diet Soft Drinks Revenue (USD Million) By Country (2021-2032)
Table 14 Asia Pacific Diet Soft Drinks Revenue (USD Million) By Country (2021-2032)
Table 15 South America Diet Soft Drinks Revenue (USD Million) By Country (2021-2032)
Table 16 Middle East and Africa Diet Soft Drinks Revenue (USD Million) By Region (2021-2032)
Table 17 North America Diet Soft Drinks Revenue (USD Million) By Type (2021-2032)
Table 18 North America Diet Soft Drinks Revenue (USD Million) By Application (2021-2032)
Table 19 North America Diet Soft Drinks Revenue (USD Million) By Product (2021-2032)
Table 20 Europe Diet Soft Drinks Revenue (USD Million) By Type (2021-2032)
Table 21 Europe Diet Soft Drinks Revenue (USD Million) By Application (2021-2032)
Table 22 Europe Diet Soft Drinks Revenue (USD Million) By Product (2021-2032)
Table 23 Asia Pacific Diet Soft Drinks Revenue (USD Million) By Type (2021-2032)
Table 24 Asia Pacific Diet Soft Drinks Revenue (USD Million) By Application (2021-2032)
Table 25 Asia Pacific Diet Soft Drinks Revenue (USD Million) By Product (2021-2032)
Table 26 South America Diet Soft Drinks Revenue (USD Million) By Type (2021-2032)
Table 27 South America Diet Soft Drinks Revenue (USD Million) By Application (2021-2032)
Table 28 South America Diet Soft Drinks Revenue (USD Million) By Product (2021-2032)
Table 29 Middle East and Africa Diet Soft Drinks Revenue (USD Million) By Type (2021-2032)
Table 30 Middle East and Africa Diet Soft Drinks Revenue (USD Million) By Application (2021-2032)
Table 31 Middle East and Africa Diet Soft Drinks Revenue (USD Million) By Product (2021-2032)
LIST OF FIGURES
Figure 1. Market Scope
Figure 2. Pricing Forecasts Per Unit, 2023- 2032
Figure 3. Porter’s Five Forces
Figure 4. Global Diet Soft Drinks Market Revenue (USD Million) By Regions (2021-2032)
Figure 5. Global Diet Soft Drinks Market Share (%) By Regions (2023)
Figure 6. North America Diet Soft Drinks Revenue (USD Million) By Country (2021-2032)
Figure 7. United States Diet Soft Drinks Revenue (USD Million) By Country (2021-2032)
Figure 8. Canada Diet Soft Drinks Revenue (USD Million) By Country (2021-2032)
Figure 9. Mexico Diet Soft Drinks Revenue (USD Million) By Country (2021-2032)
Figure 10. Europe Diet Soft Drinks Revenue (USD Million) By Country (2021-2032)
Figure 11. Germany Diet Soft Drinks Revenue (USD Million) By Country (2021-2032)
Figure 12. France Diet Soft Drinks Revenue (USD Million) By Country (2021-2032)
Figure 13. United Kingdom Diet Soft Drinks Revenue (USD Million) By Country (2021-2032)
Figure 14. Spain Diet Soft Drinks Revenue (USD Million) By Country (2021-2032)
Figure 15. Italy Diet Soft Drinks Revenue (USD Million) By Country (2021-2032)
Figure 16. Russia Diet Soft Drinks Revenue (USD Million) By Country (2021-2032)
Figure 17. Rest of Europe Diet Soft Drinks Revenue (USD Million) By Country (2021-2032)
Figure 11. Asia Pacific Diet Soft Drinks Revenue (USD Million) By Country (2021-2032)
Figure 12. China Diet Soft Drinks Revenue (USD Million) By Country (2021-2032)
Figure 13. Japan Diet Soft Drinks Revenue (USD Million) By Country (2021-2032)
Figure 14. India Diet Soft Drinks Revenue (USD Million) By Country (2021-2032)
Figure 15. South Korea Diet Soft Drinks Revenue (USD Million) By Country (2021-2032)
Figure 16. Australia Diet Soft Drinks Revenue (USD Million) By Country (2021-2032)
Figure 17. South East Asia Diet Soft Drinks Revenue (USD Million) By Country (2021-2032)
Figure 18. South America Diet Soft Drinks Revenue (USD Million) By Country (2021-2032)
Figure 19. Brazil Diet Soft Drinks Revenue (USD Million) By Country (2021-2032)
Figure 20. Argentina Diet Soft Drinks Revenue (USD Million) By Country (2021-2032)
Figure 21. Rest of Asia Pacific Diet Soft Drinks Revenue (USD Million) By Country (2021-2032)
Figure 22. Middle East and Africa Diet Soft Drinks Revenue (USD Million) By Region (2021-2032)
Figure 23. Saudi Arabia Diet Soft Drinks Revenue (USD Million) By Region (2021-2032)
Figure 24. The UAE Diet Soft Drinks Revenue (USD Million) By Region (2021-2032)
Figure 25. Rest of Middle East Diet Soft Drinks Revenue (USD Million) By Region (2021-2032)
Figure 26. South Africa Diet Soft Drinks Revenue (USD Million) By Region (2021-2032)
Figure 27. Africa Diet Soft Drinks Revenue (USD Million) By Region (2021-2032)
Figure 28. North America Diet Soft Drinks Revenue (USD Million) By Type (2021-2032)
Figure 29. North America Diet Soft Drinks Revenue (USD Million) By Application (2021-2032)
Figure 30. North America Diet Soft Drinks Revenue (USD Million) By Product (2021-2032)
Figure 31. Europe Diet Soft Drinks Revenue (USD Million) By Type (2021-2032)
Figure 32. Europe Diet Soft Drinks Revenue (USD Million) By Application (2021-2032)
Figure 33. Europe Diet Soft Drinks Revenue (USD Million) By Product (2021-2032)
Figure 34. Asia Pacific Diet Soft Drinks Revenue (USD Million) By Type (2021-2032)
Figure 35. Asia Pacific Diet Soft Drinks Revenue (USD Million) By Application (2021-2032)
Figure 36. Asia Pacific Diet Soft Drinks Revenue (USD Million) By Product (2021-2032)
Figure 37. South America Diet Soft Drinks Revenue (USD Million) By Type (2021-2032)
Figure 38. South America Diet Soft Drinks Revenue (USD Million) By Application (2021-2032)
Figure 39. South America Diet Soft Drinks Revenue (USD Million) By Product (2021-2032)
Figure 40. Middle East and Africa Diet Soft Drinks Revenue (USD Million) By Type (2021-2032)
Figure 41. Middle East and Africa Diet Soft Drinks Revenue (USD Million) By Application (2021-2032)
Figure 42. Middle East and Africa Diet Soft Drinks Revenue (USD Million) By Product (2021-2032)
By Distribution Channel
Supermarkets & General Merchandise
Convenience store
Food Service & Drinking Places
Online
By Product
Zero Calorie
Low Calorie
Countries Analyzed
North America (US, Canada, Mexico)
Europe (Germany, UK, France, Spain, Italy, Russia, Rest of Europe)
Asia Pacific (China, India, Japan, South Korea, Australia, South East Asia, Rest of Asia)
South America (Brazil, Argentina, Rest of South America)
Middle East and Africa (Saudi Arabia, UAE, Rest of Middle East, South Africa, Egypt, Rest of Africa)
