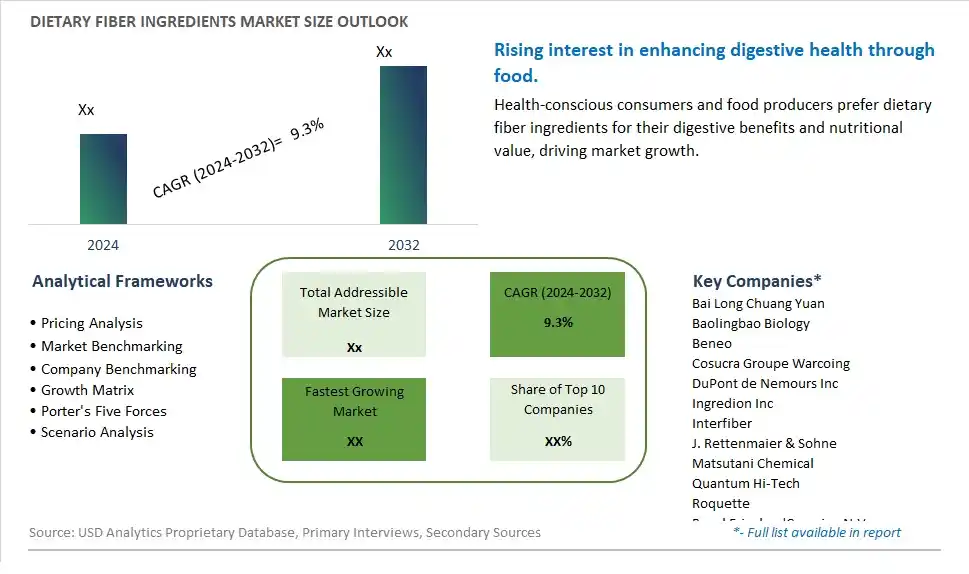
Global Dietary Fiber Ingredients Market Size is valued at $XX Million in 2024 and is forecast to register a growth rate (CAGR) of 9.3% to reach $XX Million by 2032.
The global Dietary Fiber Ingredients Market Comprehensive Study analyzes and forecasts the market size across 6 regions and 24 countries for diverse segments -By Type (Insoluble, -Cellulose, -Hemicelluloses, -Chitin & Chitosan, -Lignin, -Oat Bran, -Wheat Fiber, -Others, Soluble, -Inulin, -Pectin, -Beta-Glucan, -Corn Fibers, -Others), By Application (Processed Meat Food, Baked Foods, Dairy Products, Beverages, Health Products, Others)
An Introduction to Dietary Fiber Ingredients Market
In 2024, the Dietary Fiber Ingredients market is witnessing robust growth, driven by the increasing demand for functional and health-promoting ingredients in the food and beverage industry. Dietary fiber ingredients, sourced from fruits, vegetables, grains, and legumes, are valued for their role in supporting digestive health, weight management, and cardiovascular health. The market is supported by the growing trend towards clean-label and functional foods. Advances in extraction and processing technologies are enhancing the quality, solubility, and application versatility of dietary fiber ingredients. The market is also benefiting from the trend towards natural and minimally processed ingredients, appealing to health-conscious consumers seeking high-quality and effective fiber solutions.
Dietary Fiber Ingredients Competitive Landscape
The market report analyses the leading companies in the industry including Bai Long Chuang Yuan, Baolingbao Biology, Beneo, Cosucra Groupe Warcoing, DuPont de Nemours Inc, Ingredion Inc, Interfiber, J. Rettenmaier & Sohne, Matsutani Chemical, Quantum Hi-Tech, Roquette, Royal FrieslandCampina N.V., Sensus, Tate & Lyle PLC, and Others.
Dietary Fiber Ingredients Market Dynamics
Dietary Fiber Ingredients Market Trend: Increasing Awareness of Health Benefits and Dietary Recommendations
A prominent trend in the dietary fiber ingredients market is the increasing awareness of the health benefits of dietary fiber and dietary recommendations promoting its consumption. Consumers are becoming more educated about the importance of dietary fiber in supporting digestive health, weight management, blood sugar control, and overall well-being. This trend is driven by health-conscious lifestyles and a growing emphasis on preventive healthcare, leading consumers to seek foods and supplements enriched with dietary fiber ingredients to meet their nutritional needs and support a healthy lifestyle.
Dietary Fiber Ingredients Market Driver: Demand for Functional and Clean-Label Ingredients in Food and Beverage Industry
A key driver influencing the dietary fiber ingredients market is the demand for functional and clean-label ingredients in the food and beverage industry. Food manufacturers and product developers are seeking natural, plant-based ingredients like dietary fibers to enhance the nutritional profile of their products, improve texture, increase satiety, and meet consumer preferences for clean-label and health-conscious options. The driver is fueled by consumer demand for foods and beverages that are not only tasty but also offer functional benefits and contribute to overall wellness.
Dietary Fiber Ingredients Market Opportunity: Innovation in Fiber-Rich Products and Targeted Formulations
An exciting opportunity in the dietary fiber ingredients market lies in innovation in fiber-rich products and targeted formulations. There is potential to develop a wide range of fiber-rich foods and beverages, including cereals, snacks, baked goods, beverages, and dietary supplements, that provide consumers with convenient and enjoyable ways to increase their dietary fiber intake. Additionally, there is an opportunity to create targeted formulations for specific health concerns, such as digestive health, weight management, blood sugar control, and heart health, by combining dietary fiber ingredients with other functional ingredients like probiotics, vitamins, minerals, and antioxidants. This opportunity allows companies to differentiate their products, meet consumer demands for healthier options, and contribute to the growing market for functional and fiber-rich foods and beverages.
Dietary Fiber Ingredients Market Share Analysis: Soluble Dietary Fiber Ingredients segment generated the highest revenue share in the industry
The Soluble Dietary Fiber Ingredients segment emerges as the largest category in the Dietary Fiber Ingredients Market, showcasing rapid growth driven by its recognized health benefits and versatile applications in various industries. Soluble dietary fibers, such as inulin, pectin, beta-glucan, and corn fibers, are known for their ability to dissolve in water and form a gel-like consistency in the digestive tract. This property allows them to bind with cholesterol, slow down digestion, regulate blood sugar levels, and promote gut health. Additionally, soluble fibers contribute to satiety, aiding in weight management and promoting overall well-being. These attributes make soluble dietary fiber ingredients highly sought-after by food and beverage manufacturers for enhancing the nutritional value of their products. Soluble fibers are commonly used in functional foods, beverages, dietary supplements, and pharmaceuticals to address various health concerns, including cardiovascular health, digestive disorders, and weight management. As consumers become increasingly health-conscious and demand products with added nutritional benefits, the Soluble Dietary Fiber Ingredients segment continues to lead the market and drive innovation in the dietary fiber industry.
Dietary Fiber Ingredients Market Share Analysis: Health Products Application is the fastest growing segment over the forecast period to 2032
The Health Products Application segment within the Dietary Fiber Ingredients Market emerges as the fastest-growing category projected to experience substantial growth by 2032. This surge is driven by several key factors. Firstly, the increasing focus on health and wellness among consumers worldwide has led to a growing demand for functional ingredients in health products. Dietary fiber ingredients, known for their beneficial effects on digestive health, weight management, and overall well-being, are integral components of a wide range of health products, including dietary supplements, nutritional bars, and meal replacements. Additionally, the rising prevalence of lifestyle-related health concerns such as obesity, diabetes, and digestive disorders has spurred the adoption of dietary fiber ingredients in health products aimed at addressing these issues. Further, advancements in food science and technology have enabled the incorporation of dietary fibers into a variety of formulations, making them more palatable and appealing to consumers. As consumers continue to prioritize preventive healthcare and seek out products that offer added nutritional benefits, the Health Products Application of dietary fiber ingredients emerges as a pivotal segment driving market growth and innovation in the dietary fiber industry.
Dietary Fiber Ingredients Market Segmentation
By Type
Insoluble
-Cellulose
-Hemicelluloses
-Chitin & Chitosan
-Lignin
-Oat Bran
-Wheat Fiber
-Others
Soluble
-Inulin
-Pectin
-Beta-Glucan
-Corn Fibers
-Others
By Application
Processed Meat Food
Baked Foods
Dairy Products
Beverages
Health Products
Others
Countries Analyzed
North America (US, Canada, Mexico)
Europe (Germany, UK, France, Spain, Italy, Russia, Rest of Europe)
Asia Pacific (China, India, Japan, South Korea, Australia, South East Asia, Rest of Asia)
South America (Brazil, Argentina, Rest of South America)
Middle East and Africa (Saudi Arabia, UAE, Rest of Middle East, South Africa, Egypt, Rest of Africa)
Dietary Fiber Ingredients Companies Profiled in the Study
Bai Long Chuang Yuan
Baolingbao Biology
Beneo
Cosucra Groupe Warcoing
DuPont de Nemours Inc
Ingredion Inc
Interfiber
J. Rettenmaier & Sohne
Matsutani Chemical
Quantum Hi-Tech
Roquette
Royal FrieslandCampina N.V.
Sensus
Tate & Lyle PLC
*- List Not Exhaustive
Chapter 1. TABLE OF CONTENTS
Chapter 2. Introduction to Dietary Fiber Ingredients Market
2.1. Market Overview
2.2. Key Statistics and Report Highlights
2.3. Scope of the Comprehensive Study
2.3.1. Market Definition
2.3.2 Countries and Regions Covered
2.3.3 Research Objective
2.3.4 Units, Currency, and Conversions
2.3.5 Industry Value Chain
2.4. Key Market Segments
2.5. Key Companies
2.6. Study Period
Chapter 3. Strategic Analysis Review
3.1. Dietary Fiber Ingredients Pricing Analysis and Forecast
3.2. Porter’s Five Forces
3.3. Market Ecosystem
3.4. SWOT Analysis
3.5. Regulatory Scenario
3.3. Effects of Inflation, Russia-Ukraine War, moderating economic growth, and other macroeconomic factors
Chapter 4. Competitive Landscape
4.1. Market Share Analysis
4.1.1. Global Dietary Fiber Ingredients Market Share by Company, 2023
4.1.2. Product Offerings of Leading Dietary Fiber Ingredients Companies
4.2. Market Entropy
4.2.1. New Product Launches in the Industry
4.2.2. Mergers, Acquisitions, Joint ventures, and Partnerships
4.3. Key Strategies and Best Practices
Chapter 5. Global Market Projections: Best, Reference, and Low Case Scenarios
5.1. Growth Analysis- Case Scenario Definitions
5.2. Low Growth Case Scenario Forecasts
5.3. Reference Growth Case Scenario Forecasts
5.4. High Growth Case Scenario Forecasts
Chapter 6. Market Dynamics
6.1. Dietary Fiber Ingredients Market Drivers
6.2. Dietary Fiber Ingredients Market Challenges
6.6. Dietary Fiber Ingredients Market Opportunities
6.4. Dietary Fiber Ingredients Market Trends
Chapter 7. Global Dietary Fiber Ingredients Market Outlook Trends
7.1. Global Dietary Fiber Ingredients Revenue (USD Million) and CAGR (%) by Type (2021-2032)
7.2. Global Dietary Fiber Ingredients Revenue (USD Million) and CAGR (%) by Application (2021-2032)
7.3. Global Dietary Fiber Ingredients Revenue (USD Million) and CAGR (%) by Product (2021-2032)
By Type
Insoluble
-Cellulose
-Hemicelluloses
-Chitin & Chitosan
-Lignin
-Oat Bran
-Wheat Fiber
-Others
Soluble
-Inulin
-Pectin
-Beta-Glucan
-Corn Fibers
-Others
By Application
Processed Meat Food
Baked Foods
Dairy Products
Beverages
Health Products
Others
Chapter 8. Global Dietary Fiber Ingredients Regional Analysis and Outlook
8.1. Global Dietary Fiber Ingredients Revenue (USD Million) By Regions (2021- 2032)
8.2. North America Dietary Fiber Ingredients Revenue (USD Million) by Country (2021-2032)
8.2.1. United States Dietary Fiber Ingredients Regional Analysis and Outlook
8.2.2. Canada Dietary Fiber Ingredients Regional Analysis and Outlook
8.2.3. Mexico Dietary Fiber Ingredients Regional Analysis and Outlook
8.3. Europe Dietary Fiber Ingredients Revenue (USD Million), by Country (2021-2032)
8.3.1. Germany Dietary Fiber Ingredients Regional Analysis and Outlook
8.3.2. France Dietary Fiber Ingredients Regional Analysis and Outlook
8.3.3. United Kingdom Dietary Fiber Ingredients Regional Analysis and Outlook
8.3.4. Spain Dietary Fiber Ingredients Regional Analysis and Outlook
8.3.5. Italy Dietary Fiber Ingredients Regional Analysis and Outlook
8.3.6. Russia Dietary Fiber Ingredients Regional Analysis and Outlook
8.3.7. Rest of Europe Dietary Fiber Ingredients Regional Analysis and Outlook
8.4. Asia Pacific Dietary Fiber Ingredients Revenue (USD Million) by Country (2021-2032)
8.4.1. China Dietary Fiber Ingredients Regional Analysis and Outlook
8.4.2. Japan Dietary Fiber Ingredients Regional Analysis and Outlook
8.4.3. India Dietary Fiber Ingredients Regional Analysis and Outlook
8.4.4. South Korea Dietary Fiber Ingredients Regional Analysis and Outlook
8.4.5. Australia Dietary Fiber Ingredients Regional Analysis and Outlook
8.4.6. South East Asia Dietary Fiber Ingredients Regional Analysis and Outlook
8.4.7. Rest of Asia Pacific Dietary Fiber Ingredients Regional Analysis and Outlook
8.5. South America Dietary Fiber Ingredients Revenue (USD Million), by Country (2021-2032)
8.5.1. Brazil Dietary Fiber Ingredients Regional Analysis and Outlook
8.5.2. Argentina Dietary Fiber Ingredients Regional Analysis and Outlook
8.5.3. Rest of South America Dietary Fiber Ingredients Regional Analysis and Outlook
8.6. Middle East and Africa Dietary Fiber Ingredients Revenue (USD Million) by Country (2021-2032)
8.6.1. Middle East Dietary Fiber Ingredients Regional Analysis and Outlook
8.6.2. Africa Dietary Fiber Ingredients Regional Analysis and Outlook
Chapter 9. North America Dietary Fiber Ingredients Analysis and Outlook
9.1. North America Dietary Fiber Ingredients Revenue (USD Million) by Segments (2021-2032)
9.1.1. North America Dietary Fiber Ingredients Revenue (USD Million) by Type (2021-2032)
9.1.2. North America Dietary Fiber Ingredients Revenue (USD Million) by Application (2021-2032)
9.1.3. North America Dietary Fiber Ingredients Revenue (USD Million) by Product (2021-2032)
By Type
Insoluble
-Cellulose
-Hemicelluloses
-Chitin & Chitosan
-Lignin
-Oat Bran
-Wheat Fiber
-Others
Soluble
-Inulin
-Pectin
-Beta-Glucan
-Corn Fibers
-Others
By Application
Processed Meat Food
Baked Foods
Dairy Products
Beverages
Health Products
Others
Chapter 10. Europe Dietary Fiber Ingredients Analysis and Outlook
10.1. Europe Dietary Fiber Ingredients Revenue (USD Million), by Segments (USD Million) (2021-2032)
10.1.1. Europe Dietary Fiber Ingredients Revenue (USD Million) by Type (2021-2032)
10.1.2. Europe Dietary Fiber Ingredients Revenue (USD Million) by Application (2021-2032)
10.1.3. Europe Dietary Fiber Ingredients Revenue (USD Million) by Product (2021-2032)
By Type
Insoluble
-Cellulose
-Hemicelluloses
-Chitin & Chitosan
-Lignin
-Oat Bran
-Wheat Fiber
-Others
Soluble
-Inulin
-Pectin
-Beta-Glucan
-Corn Fibers
-Others
By Application
Processed Meat Food
Baked Foods
Dairy Products
Beverages
Health Products
Others
Chapter 11. Asia Pacific Dietary Fiber Ingredients Analysis and Outlook
11.1. Asia Pacific Dietary Fiber Ingredients Revenue (USD Million), and Revenue (USD Million) by Segments (2021-2032)
11.1.1. Asia Pacific Dietary Fiber Ingredients Revenue (USD Million) by Type (2021-2032)
11.1.2. Asia Pacific Dietary Fiber Ingredients Revenue (USD Million) by Application (2021-2032)
11.1.3. Asia Pacific Dietary Fiber Ingredients Revenue (USD Million) by Product (2021-2032)
By Type
Insoluble
-Cellulose
-Hemicelluloses
-Chitin & Chitosan
-Lignin
-Oat Bran
-Wheat Fiber
-Others
Soluble
-Inulin
-Pectin
-Beta-Glucan
-Corn Fibers
-Others
By Application
Processed Meat Food
Baked Foods
Dairy Products
Beverages
Health Products
Others
Chapter 12. South America Dietary Fiber Ingredients Analysis and Outlook
12.1. South America Dietary Fiber Ingredients Revenue (USD Million), by Segments (2021-2032)
12.1.1. South America Dietary Fiber Ingredients Revenue (USD Million) by Type (2021-2032)
12.1.2. South America Dietary Fiber Ingredients Revenue (USD Million) by Application (2021-2032)
12.1.3. South America Dietary Fiber Ingredients Revenue (USD Million) by Product (2021-2032)
By Type
Insoluble
-Cellulose
-Hemicelluloses
-Chitin & Chitosan
-Lignin
-Oat Bran
-Wheat Fiber
-Others
Soluble
-Inulin
-Pectin
-Beta-Glucan
-Corn Fibers
-Others
By Application
Processed Meat Food
Baked Foods
Dairy Products
Beverages
Health Products
Others
Chapter 13. Middle East and Africa Dietary Fiber Ingredients Analysis and Outlook
13.1. Middle East and Africa Dietary Fiber Ingredients Revenue (USD Million), by Segments (2021-2032)
13.1.1. Middle East and Africa Dietary Fiber Ingredients Revenue (USD Million) by Type (2021-2032)
13.1.2. Middle East and Africa Dietary Fiber Ingredients Revenue (USD Million) by Application (2021-2032)
13.1.3. Middle East and Africa Dietary Fiber Ingredients Revenue (USD Million) by Product (2021-2032)
By Type
Insoluble
-Cellulose
-Hemicelluloses
-Chitin & Chitosan
-Lignin
-Oat Bran
-Wheat Fiber
-Others
Soluble
-Inulin
-Pectin
-Beta-Glucan
-Corn Fibers
-Others
By Application
Processed Meat Food
Baked Foods
Dairy Products
Beverages
Health Products
Others
Chapter 14. Dietary Fiber Ingredients Company Profiles
14.1 Business Overview
14.2 Product Profiles
14.3 SWOT Profiles
14.5 Recent Developments
14.6 Financial Profile
List of Companies
Bai Long Chuang Yuan
Baolingbao Biology
Beneo
Cosucra Groupe Warcoing
DuPont de Nemours Inc
Ingredion Inc
Interfiber
J. Rettenmaier & Sohne
Matsutani Chemical
Quantum Hi-Tech
Roquette
Royal FrieslandCampina N.V.
Sensus
Tate & Lyle PLC
15. Methodology and Data Sources
15.1 Customization Offerings
15.2 Subscription Services
15.3 Related Reports
15.4 Publisher Expertise
LIST OF TABLES
Table 1 Market Segmentation Analysis
Table 2 Global Dietary Fiber Ingredients Market Share of Leading Companies, 2023
Table 3 Product Offerings of Leading Companies
Table 4 Low Growth Scenario Forecasts
Table 5 Reference Case Growth Scenario
Table 6 High Growth Case Scenario
Table 7 Global Dietary Fiber Ingredients Revenue (USD Million) And CAGR (%) By Type (2021-2032)
Table 8 Global Dietary Fiber Ingredients Revenue (USD Million) And CAGR (%) By Application (2021-2032)
Table 9 Global Dietary Fiber Ingredients Revenue (USD Million) And CAGR (%) By Product (2021-2032)
Table 10 Global Dietary Fiber Ingredients Market Revenue (USD Million) By Regions (2021-2032)
Table 11 Global Dietary Fiber Ingredients Market Share (%) By Regions (2021-2032)
Table 12 North America Dietary Fiber Ingredients Revenue (USD Million) By Country (2021-2032)
Table 13 Europe Dietary Fiber Ingredients Revenue (USD Million) By Country (2021-2032)
Table 14 Asia Pacific Dietary Fiber Ingredients Revenue (USD Million) By Country (2021-2032)
Table 15 South America Dietary Fiber Ingredients Revenue (USD Million) By Country (2021-2032)
Table 16 Middle East and Africa Dietary Fiber Ingredients Revenue (USD Million) By Region (2021-2032)
Table 17 North America Dietary Fiber Ingredients Revenue (USD Million) By Type (2021-2032)
Table 18 North America Dietary Fiber Ingredients Revenue (USD Million) By Application (2021-2032)
Table 19 North America Dietary Fiber Ingredients Revenue (USD Million) By Product (2021-2032)
Table 20 Europe Dietary Fiber Ingredients Revenue (USD Million) By Type (2021-2032)
Table 21 Europe Dietary Fiber Ingredients Revenue (USD Million) By Application (2021-2032)
Table 22 Europe Dietary Fiber Ingredients Revenue (USD Million) By Product (2021-2032)
Table 23 Asia Pacific Dietary Fiber Ingredients Revenue (USD Million) By Type (2021-2032)
Table 24 Asia Pacific Dietary Fiber Ingredients Revenue (USD Million) By Application (2021-2032)
Table 25 Asia Pacific Dietary Fiber Ingredients Revenue (USD Million) By Product (2021-2032)
Table 26 South America Dietary Fiber Ingredients Revenue (USD Million) By Type (2021-2032)
Table 27 South America Dietary Fiber Ingredients Revenue (USD Million) By Application (2021-2032)
Table 28 South America Dietary Fiber Ingredients Revenue (USD Million) By Product (2021-2032)
Table 29 Middle East and Africa Dietary Fiber Ingredients Revenue (USD Million) By Type (2021-2032)
Table 30 Middle East and Africa Dietary Fiber Ingredients Revenue (USD Million) By Application (2021-2032)
Table 31 Middle East and Africa Dietary Fiber Ingredients Revenue (USD Million) By Product (2021-2032)
LIST OF FIGURES
Figure 1. Market Scope
Figure 2. Pricing Forecasts Per Unit, 2023- 2032
Figure 3. Porter’s Five Forces
Figure 4. Global Dietary Fiber Ingredients Market Revenue (USD Million) By Regions (2021-2032)
Figure 5. Global Dietary Fiber Ingredients Market Share (%) By Regions (2023)
Figure 6. North America Dietary Fiber Ingredients Revenue (USD Million) By Country (2021-2032)
Figure 7. United States Dietary Fiber Ingredients Revenue (USD Million) By Country (2021-2032)
Figure 8. Canada Dietary Fiber Ingredients Revenue (USD Million) By Country (2021-2032)
Figure 9. Mexico Dietary Fiber Ingredients Revenue (USD Million) By Country (2021-2032)
Figure 10. Europe Dietary Fiber Ingredients Revenue (USD Million) By Country (2021-2032)
Figure 11. Germany Dietary Fiber Ingredients Revenue (USD Million) By Country (2021-2032)
Figure 12. France Dietary Fiber Ingredients Revenue (USD Million) By Country (2021-2032)
Figure 13. United Kingdom Dietary Fiber Ingredients Revenue (USD Million) By Country (2021-2032)
Figure 14. Spain Dietary Fiber Ingredients Revenue (USD Million) By Country (2021-2032)
Figure 15. Italy Dietary Fiber Ingredients Revenue (USD Million) By Country (2021-2032)
Figure 16. Russia Dietary Fiber Ingredients Revenue (USD Million) By Country (2021-2032)
Figure 17. Rest of Europe Dietary Fiber Ingredients Revenue (USD Million) By Country (2021-2032)
Figure 11. Asia Pacific Dietary Fiber Ingredients Revenue (USD Million) By Country (2021-2032)
Figure 12. China Dietary Fiber Ingredients Revenue (USD Million) By Country (2021-2032)
Figure 13. Japan Dietary Fiber Ingredients Revenue (USD Million) By Country (2021-2032)
Figure 14. India Dietary Fiber Ingredients Revenue (USD Million) By Country (2021-2032)
Figure 15. South Korea Dietary Fiber Ingredients Revenue (USD Million) By Country (2021-2032)
Figure 16. Australia Dietary Fiber Ingredients Revenue (USD Million) By Country (2021-2032)
Figure 17. South East Asia Dietary Fiber Ingredients Revenue (USD Million) By Country (2021-2032)
Figure 18. South America Dietary Fiber Ingredients Revenue (USD Million) By Country (2021-2032)
Figure 19. Brazil Dietary Fiber Ingredients Revenue (USD Million) By Country (2021-2032)
Figure 20. Argentina Dietary Fiber Ingredients Revenue (USD Million) By Country (2021-2032)
Figure 21. Rest of Asia Pacific Dietary Fiber Ingredients Revenue (USD Million) By Country (2021-2032)
Figure 22. Middle East and Africa Dietary Fiber Ingredients Revenue (USD Million) By Region (2021-2032)
Figure 23. Saudi Arabia Dietary Fiber Ingredients Revenue (USD Million) By Region (2021-2032)
Figure 24. The UAE Dietary Fiber Ingredients Revenue (USD Million) By Region (2021-2032)
Figure 25. Rest of Middle East Dietary Fiber Ingredients Revenue (USD Million) By Region (2021-2032)
Figure 26. South Africa Dietary Fiber Ingredients Revenue (USD Million) By Region (2021-2032)
Figure 27. Africa Dietary Fiber Ingredients Revenue (USD Million) By Region (2021-2032)
Figure 28. North America Dietary Fiber Ingredients Revenue (USD Million) By Type (2021-2032)
Figure 29. North America Dietary Fiber Ingredients Revenue (USD Million) By Application (2021-2032)
Figure 30. North America Dietary Fiber Ingredients Revenue (USD Million) By Product (2021-2032)
Figure 31. Europe Dietary Fiber Ingredients Revenue (USD Million) By Type (2021-2032)
Figure 32. Europe Dietary Fiber Ingredients Revenue (USD Million) By Application (2021-2032)
Figure 33. Europe Dietary Fiber Ingredients Revenue (USD Million) By Product (2021-2032)
Figure 34. Asia Pacific Dietary Fiber Ingredients Revenue (USD Million) By Type (2021-2032)
Figure 35. Asia Pacific Dietary Fiber Ingredients Revenue (USD Million) By Application (2021-2032)
Figure 36. Asia Pacific Dietary Fiber Ingredients Revenue (USD Million) By Product (2021-2032)
Figure 37. South America Dietary Fiber Ingredients Revenue (USD Million) By Type (2021-2032)
Figure 38. South America Dietary Fiber Ingredients Revenue (USD Million) By Application (2021-2032)
Figure 39. South America Dietary Fiber Ingredients Revenue (USD Million) By Product (2021-2032)
Figure 40. Middle East and Africa Dietary Fiber Ingredients Revenue (USD Million) By Type (2021-2032)
Figure 41. Middle East and Africa Dietary Fiber Ingredients Revenue (USD Million) By Application (2021-2032)
Figure 42. Middle East and Africa Dietary Fiber Ingredients Revenue (USD Million) By Product (2021-2032)
By Type
Insoluble
-Cellulose
-Hemicelluloses
-Chitin & Chitosan
-Lignin
-Oat Bran
-Wheat Fiber
-Others
Soluble
-Inulin
-Pectin
-Beta-Glucan
-Corn Fibers
-Others
By Application
Processed Meat Food
Baked Foods
Dairy Products
Beverages
Health Products
Others
Countries Analyzed
North America (US, Canada, Mexico)
Europe (Germany, UK, France, Spain, Italy, Russia, Rest of Europe)
Asia Pacific (China, India, Japan, South Korea, Australia, South East Asia, Rest of Asia)
South America (Brazil, Argentina, Rest of South America)
Middle East and Africa (Saudi Arabia, UAE, Rest of Middle East, South Africa, Egypt, Rest of Africa)
