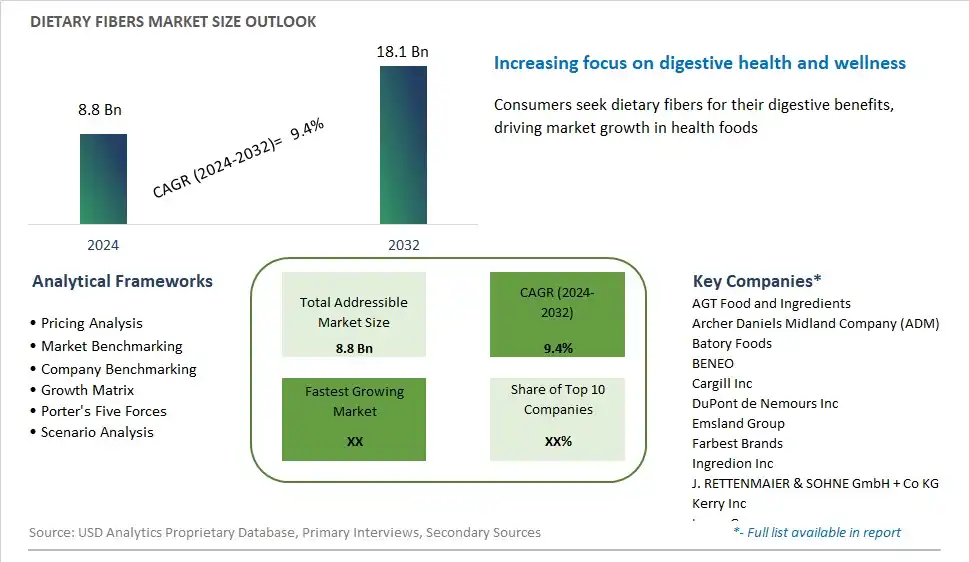
Global Dietary Fibers Market Size is valued at $8.8 Billion in 2024 and is forecast to register a growth rate (CAGR) of 9.4% to reach $18.1 Billion by 2032.
The global Dietary Fibers Market Comprehensive Study analyzes and forecasts the market size across 6 regions and 24 countries for diverse segments -By Raw Material (Fruits & Vegetables, Cereals & Grains, Nuts & Seeds, Legumes), By Type (Insoluble, Soluble), By Application (Food and Beverages, Pharmaceuticals, Animal Feed, Others)
An Introduction to Dietary Fibers Market
In 2024, the dietary fibers market continues to gain prominence as consumers prioritize digestive health and seek functional ingredients to support overall well-being. Dietary fibers, essential components of plant-based foods, play a crucial role in regulating bowel function, promoting satiety, and maintaining a healthy gut microbiota. With the prevalence of digestive disorders and lifestyle-related health concerns on the rise, there is growing demand for fiber-rich foods and supplements. Manufacturers are innovating with novel fiber sources such as chicory root, psyllium husk, and resistant starch, formulating products that cater to diverse dietary preferences and restrictions. Moreover, fortified beverages, snacks, and baked goods are emerging as convenient vehicles for delivering fiber, appealing to busy consumers looking for on-the-go solutions. Additionally, heightened awareness of the link between fiber intake and chronic diseases like diabetes and cardiovascular conditions is driving market growth, with consumers proactively incorporating fiber-rich foods into their diets. Furthermore, regulatory support for health claims related to dietary fibers and initiatives promoting nutritional education are shaping consumer perceptions and driving market expansion globally.
Dietary Fibers Competitive Landscape
The market report analyses the leading companies in the industry including AGT Food and Ingredients, Archer Daniels Midland Company (ADM), Batory Foods, BENEO, Cargill Inc, DuPont de Nemours Inc, Emsland Group, Farbest Brands, Ingredion Inc, J. RETTENMAIER & SOHNE GmbH + Co KG, Kerry Inc, Lonza Group, Nexira, PURIS, Roquette Freres, Taiyo International, Tate & Lyle Plc, The Green Labs LLC, and Others.
Dietary Fibers Market Dynamics
Dietary Fibers Market Trend: Increasing Emphasis on Digestive Health and Gut Wellness
A significant trend in the dietary fibers market is the increasing emphasis on digestive health and gut wellness among consumers. As awareness grows about the importance of maintaining a healthy gut microbiome for overall well-being, there is a rising demand for dietary fibers that support digestive function and promote gut health. Consumers are seeking fiber-rich foods and supplements to improve digestion, regulate bowel movements, and support the growth of beneficial gut bacteria. This trend is driven by factors such as changing dietary patterns, sedentary lifestyles, and the prevalence of digestive disorders such as constipation, irritable bowel syndrome (IBS), and inflammatory bowel disease (IBD). Manufacturers in the dietary fibers market are responding to this trend by introducing a variety of fiber-rich products and formulations, including soluble and insoluble fibers sourced from natural ingredients such as fruits, vegetables, grains, and legumes, to meet the diverse needs and preferences of health-conscious consumers seeking to optimize their digestive health.
Market Driver: Growing Awareness of Weight Management and Blood Sugar Control
A key driver behind the demand for dietary fibers is the growing awareness of their role in weight management and blood sugar control. Dietary fibers are known to contribute to satiety, promote feelings of fullness, and aid in weight loss or weight maintenance by slowing down digestion and regulating appetite. Additionally, soluble fibers such as beta-glucan, pectin, and psyllium have been shown to help stabilize blood sugar levels by slowing the absorption of carbohydrates and improving insulin sensitivity. With the increasing prevalence of obesity, diabetes, and metabolic syndrome worldwide, there is heightened interest in dietary strategies that support healthy weight management and blood glucose control. This drives demand for fiber-rich foods, beverages, and supplements as part of balanced diets and diabetes management plans. As a result, manufacturers are innovating and marketing fiber-rich products with claims related to weight loss, blood sugar management, and overall metabolic health, catering to the needs of consumers seeking effective and natural solutions to support their health goals.
Market Opportunity: Expansion into Functional Foods and Personalized Nutrition
An opportunity for the dietary fibers market lies in the expansion into functional foods and personalized nutrition solutions that incorporate fiber-rich ingredients to address specific health concerns and dietary preferences. Manufacturers can explore opportunities to develop functional food products fortified with dietary fibers, such as breakfast cereals, granola bars, yogurt, and baked goods, to provide convenient and tasty options for consumers looking to increase their fiber intake. Additionally, offering personalized nutrition solutions, such as customized meal plans, dietary supplements, or prebiotic fiber blends tailored to individual health goals and nutritional needs, can help differentiate brands and attract health-conscious consumers seeking personalized approaches to optimizing their health and well-being. By leveraging the versatility and health benefits of dietary fibers in innovative product formulations and personalized nutrition offerings, manufacturers can capitalize on opportunities for growth in the dynamic and evolving dietary fibers market.
Dietary Fibers Market Share Analysis: Cereals & Grains held the dominant market share in 2024
In the Dietary Fibers Market segmented by raw material, cereals & grains emerge as the largest segment, commanding a substantial share of the market. This dominance can be attributed to several key factors. Firstly, cereals and grains are widely recognized for their high fiber content, making them a popular choice among health-conscious consumers seeking to increase their dietary fiber intake. Additionally, cereals and grains are staples in many traditional diets worldwide, further bolstering their widespread consumption and market presence. Further, the versatility of cereals and grains allows them to be incorporated into a wide range of food products, including breakfast cereals, bread, pasta, and snacks, catering to diverse consumer preferences and dietary needs. Furthermore, the growing prevalence of lifestyle-related diseases such as obesity, diabetes, and cardiovascular disorders has spurred demand for fiber-rich foods, driving the popularity of cereals and grains as a convenient and effective source of dietary fiber. As a result, the cereals & grains segment maintains its position as the largest in the dietary fibers market, poised for continued growth as consumers increasingly prioritize health and wellness.
Dietary Fibers Market Share Analysis: Soluble Fibers market is poised to register the fastest growth rae over the forecast period to 2032
Within the Dietary Fibers Market segmented by type, soluble fibers emerge as the fastest-growing segment, experiencing notable expansion driven by several key factors. Soluble fibers, such as inulin, pectin, and beta-glucan, dissolve in water to form a gel-like substance in the digestive tract, contributing to various health benefits, including improved digestion, blood sugar regulation, and cholesterol reduction. This inherent functionality has garnered increasing attention from health-conscious consumers seeking to address prevalent lifestyle-related conditions such as obesity, diabetes, and cardiovascular diseases. Additionally, soluble fibers are widely used as functional ingredients in a diverse range of food and beverage products, including dietary supplements, snacks, and beverages, to enhance nutritional value and promote satiety. Further, ongoing research and development efforts focused on innovative formulations and applications of soluble fibers further drive market growth and consumer adoption. Furthermore, the rising prevalence of digestive health issues and growing consumer awareness of the importance of dietary fiber in overall wellness continue to fuel demand for soluble fiber-rich products. As a result, the soluble fibers segment stands out as the fastest-growing in the dietary fibers market, poised for sustained expansion as functional food trends and health-conscious consumer preferences continue to evolve.
Dietary Fibers Market Share Analysis: Food and Beverages held the dominant market share in 2024
In the Dietary Fibers Market segmented by application, the food and beverages segment is the largest, commanding a significant share of the market. This dominance can be attributed to several key factors. Firstly, dietary fibers play a crucial role in enhancing the nutritional profile and functional properties of food and beverage products, including bakery goods, cereals, dairy products, and functional beverages, among others. Additionally, growing consumer awareness of the health benefits associated with dietary fiber consumption, such as improved digestion, weight management, and reduced risk of chronic diseases, has driven demand for fiber-enriched food and beverage options. Further, regulatory initiatives and dietary guidelines advocating for increased fiber intake further incentivize food and beverage manufacturers to incorporate dietary fibers into their product formulations. Furthermore, ongoing innovations in fiber ingredients, including soluble and insoluble fibers sourced from various raw materials, cater to diverse consumer preferences and dietary needs, further fueling market growth within the food and beverages segment. As a result, the food and beverages segment maintains its position as the largest in the dietary fibers market, poised for continued expansion driven by evolving consumer trends and the growing emphasis on health and wellness.
Dietary Fibers Market Segmentation
By Raw Material
Fruits & Vegetables
Cereals & Grains
Nuts & Seeds
Legumes
By Type
Insoluble
-Cellulose
-Hemicelluloses
-Chitin & Chitosan
-Lignin
-Oat Bran
-Wheat Fiber
-Others
Soluble
-Inulin
-Pectin
-Beta-Glucan
-Corn Fibers
-Others
By Application
Food and Beverages
Pharmaceuticals
Animal Feed
Others
Countries Analyzed
North America (US, Canada, Mexico)
Europe (Germany, UK, France, Spain, Italy, Russia, Rest of Europe)
Asia Pacific (China, India, Japan, South Korea, Australia, South East Asia, Rest of Asia)
South America (Brazil, Argentina, Rest of South America)
Middle East and Africa (Saudi Arabia, UAE, Rest of Middle East, South Africa, Egypt, Rest of Africa)
Dietary Fibers Companies Profiled in the Study
AGT Food and Ingredients
Archer Daniels Midland Company (ADM)
Batory Foods
BENEO
Cargill Inc
DuPont de Nemours Inc
Emsland Group
Farbest Brands
Ingredion Inc
J. RETTENMAIER & SOHNE GmbH + Co KG
Kerry Inc
Lonza Group
Nexira
PURIS
Roquette Freres
Taiyo International
Tate & Lyle Plc
The Green Labs LLC
*- List Not Exhaustive
Chapter 1. TABLE OF CONTENTS
Chapter 2. Introduction to Dietary Fibers Market
2.1. Market Overview
2.2. Key Statistics and Report Highlights
2.3. Scope of the Comprehensive Study
2.3.1. Market Definition
2.3.2 Countries and Regions Covered
2.3.3 Research Objective
2.3.4 Units, Currency, and Conversions
2.3.5 Industry Value Chain
2.4. Key Market Segments
2.5. Key Companies
2.6. Study Period
Chapter 3. Strategic Analysis Review
3.1. Dietary Fibers Pricing Analysis and Forecast
3.2. Porter’s Five Forces
3.3. Market Ecosystem
3.4. SWOT Analysis
3.5. Regulatory Scenario
3.3. Effects of Inflation, Russia-Ukraine War, moderating economic growth, and other macroeconomic factors
Chapter 4. Competitive Landscape
4.1. Market Share Analysis
4.1.1. Global Dietary Fibers Market Share by Company, 2023
4.1.2. Product Offerings of Leading Dietary Fibers Companies
4.2. Market Entropy
4.2.1. New Product Launches in the Industry
4.2.2. Mergers, Acquisitions, Joint ventures, and Partnerships
4.3. Key Strategies and Best Practices
Chapter 5. Global Market Projections: Best, Reference, and Low Case Scenarios
5.1. Growth Analysis- Case Scenario Definitions
5.2. Low Growth Case Scenario Forecasts
5.3. Reference Growth Case Scenario Forecasts
5.4. High Growth Case Scenario Forecasts
Chapter 6. Market Dynamics
6.1. Dietary Fibers Market Drivers
6.2. Dietary Fibers Market Challenges
6.6. Dietary Fibers Market Opportunities
6.4. Dietary Fibers Market Trends
Chapter 7. Global Dietary Fibers Market Outlook Trends
7.1. Global Dietary Fibers Revenue (USD Million) and CAGR (%) by Type (2021-2032)
7.2. Global Dietary Fibers Revenue (USD Million) and CAGR (%) by Application (2021-2032)
7.3. Global Dietary Fibers Revenue (USD Million) and CAGR (%) by Product (2021-2032)
By Raw Material
Fruits & Vegetables
Cereals & Grains
Nuts & Seeds
Legumes
By Type
Insoluble
-Cellulose
-Hemicelluloses
-Chitin & Chitosan
-Lignin
-Oat Bran
-Wheat Fiber
-Others
Soluble
-Inulin
-Pectin
-Beta-Glucan
-Corn Fibers
-Others
By Application
Food and Beverages
Pharmaceuticals
Animal Feed
Others
Chapter 8. Global Dietary Fibers Regional Analysis and Outlook
8.1. Global Dietary Fibers Revenue (USD Million) By Regions (2021- 2032)
8.2. North America Dietary Fibers Revenue (USD Million) by Country (2021-2032)
8.2.1. United States Dietary Fibers Regional Analysis and Outlook
8.2.2. Canada Dietary Fibers Regional Analysis and Outlook
8.2.3. Mexico Dietary Fibers Regional Analysis and Outlook
8.3. Europe Dietary Fibers Revenue (USD Million), by Country (2021-2032)
8.3.1. Germany Dietary Fibers Regional Analysis and Outlook
8.3.2. France Dietary Fibers Regional Analysis and Outlook
8.3.3. United Kingdom Dietary Fibers Regional Analysis and Outlook
8.3.4. Spain Dietary Fibers Regional Analysis and Outlook
8.3.5. Italy Dietary Fibers Regional Analysis and Outlook
8.3.6. Russia Dietary Fibers Regional Analysis and Outlook
8.3.7. Rest of Europe Dietary Fibers Regional Analysis and Outlook
8.4. Asia Pacific Dietary Fibers Revenue (USD Million) by Country (2021-2032)
8.4.1. China Dietary Fibers Regional Analysis and Outlook
8.4.2. Japan Dietary Fibers Regional Analysis and Outlook
8.4.3. India Dietary Fibers Regional Analysis and Outlook
8.4.4. South Korea Dietary Fibers Regional Analysis and Outlook
8.4.5. Australia Dietary Fibers Regional Analysis and Outlook
8.4.6. South East Asia Dietary Fibers Regional Analysis and Outlook
8.4.7. Rest of Asia Pacific Dietary Fibers Regional Analysis and Outlook
8.5. South America Dietary Fibers Revenue (USD Million), by Country (2021-2032)
8.5.1. Brazil Dietary Fibers Regional Analysis and Outlook
8.5.2. Argentina Dietary Fibers Regional Analysis and Outlook
8.5.3. Rest of South America Dietary Fibers Regional Analysis and Outlook
8.6. Middle East and Africa Dietary Fibers Revenue (USD Million) by Country (2021-2032)
8.6.1. Middle East Dietary Fibers Regional Analysis and Outlook
8.6.2. Africa Dietary Fibers Regional Analysis and Outlook
Chapter 9. North America Dietary Fibers Analysis and Outlook
9.1. North America Dietary Fibers Revenue (USD Million) by Segments (2021-2032)
9.1.1. North America Dietary Fibers Revenue (USD Million) by Type (2021-2032)
9.1.2. North America Dietary Fibers Revenue (USD Million) by Application (2021-2032)
9.1.3. North America Dietary Fibers Revenue (USD Million) by Product (2021-2032)
By Raw Material
Fruits & Vegetables
Cereals & Grains
Nuts & Seeds
Legumes
By Type
Insoluble
-Cellulose
-Hemicelluloses
-Chitin & Chitosan
-Lignin
-Oat Bran
-Wheat Fiber
-Others
Soluble
-Inulin
-Pectin
-Beta-Glucan
-Corn Fibers
-Others
By Application
Food and Beverages
Pharmaceuticals
Animal Feed
Others
Chapter 10. Europe Dietary Fibers Analysis and Outlook
10.1. Europe Dietary Fibers Revenue (USD Million), by Segments (USD Million) (2021-2032)
10.1.1. Europe Dietary Fibers Revenue (USD Million) by Type (2021-2032)
10.1.2. Europe Dietary Fibers Revenue (USD Million) by Application (2021-2032)
10.1.3. Europe Dietary Fibers Revenue (USD Million) by Product (2021-2032)
By Raw Material
Fruits & Vegetables
Cereals & Grains
Nuts & Seeds
Legumes
By Type
Insoluble
-Cellulose
-Hemicelluloses
-Chitin & Chitosan
-Lignin
-Oat Bran
-Wheat Fiber
-Others
Soluble
-Inulin
-Pectin
-Beta-Glucan
-Corn Fibers
-Others
By Application
Food and Beverages
Pharmaceuticals
Animal Feed
Others
Chapter 11. Asia Pacific Dietary Fibers Analysis and Outlook
11.1. Asia Pacific Dietary Fibers Revenue (USD Million), and Revenue (USD Million) by Segments (2021-2032)
11.1.1. Asia Pacific Dietary Fibers Revenue (USD Million) by Type (2021-2032)
11.1.2. Asia Pacific Dietary Fibers Revenue (USD Million) by Application (2021-2032)
11.1.3. Asia Pacific Dietary Fibers Revenue (USD Million) by Product (2021-2032)
By Raw Material
Fruits & Vegetables
Cereals & Grains
Nuts & Seeds
Legumes
By Type
Insoluble
-Cellulose
-Hemicelluloses
-Chitin & Chitosan
-Lignin
-Oat Bran
-Wheat Fiber
-Others
Soluble
-Inulin
-Pectin
-Beta-Glucan
-Corn Fibers
-Others
By Application
Food and Beverages
Pharmaceuticals
Animal Feed
Others
Chapter 12. South America Dietary Fibers Analysis and Outlook
12.1. South America Dietary Fibers Revenue (USD Million), by Segments (2021-2032)
12.1.1. South America Dietary Fibers Revenue (USD Million) by Type (2021-2032)
12.1.2. South America Dietary Fibers Revenue (USD Million) by Application (2021-2032)
12.1.3. South America Dietary Fibers Revenue (USD Million) by Product (2021-2032)
By Raw Material
Fruits & Vegetables
Cereals & Grains
Nuts & Seeds
Legumes
By Type
Insoluble
-Cellulose
-Hemicelluloses
-Chitin & Chitosan
-Lignin
-Oat Bran
-Wheat Fiber
-Others
Soluble
-Inulin
-Pectin
-Beta-Glucan
-Corn Fibers
-Others
By Application
Food and Beverages
Pharmaceuticals
Animal Feed
Others
Chapter 13. Middle East and Africa Dietary Fibers Analysis and Outlook
13.1. Middle East and Africa Dietary Fibers Revenue (USD Million), by Segments (2021-2032)
13.1.1. Middle East and Africa Dietary Fibers Revenue (USD Million) by Type (2021-2032)
13.1.2. Middle East and Africa Dietary Fibers Revenue (USD Million) by Application (2021-2032)
13.1.3. Middle East and Africa Dietary Fibers Revenue (USD Million) by Product (2021-2032)
By Raw Material
Fruits & Vegetables
Cereals & Grains
Nuts & Seeds
Legumes
By Type
Insoluble
-Cellulose
-Hemicelluloses
-Chitin & Chitosan
-Lignin
-Oat Bran
-Wheat Fiber
-Others
Soluble
-Inulin
-Pectin
-Beta-Glucan
-Corn Fibers
-Others
By Application
Food and Beverages
Pharmaceuticals
Animal Feed
Others
Chapter 14. Dietary Fibers Company Profiles
14.1 Business Overview
14.2 Product Profiles
14.3 SWOT Profiles
14.5 Recent Developments
14.6 Financial Profile
List of Companies
AGT Food and Ingredients
Archer Daniels Midland Company (ADM)
Batory Foods
BENEO
Cargill Inc
DuPont de Nemours Inc
Emsland Group
Farbest Brands
Ingredion Inc
J. RETTENMAIER & SOHNE GmbH + Co KG
Kerry Inc
Lonza Group
Nexira
PURIS
Roquette Freres
Taiyo International
Tate & Lyle Plc
The Green Labs LLC
15. Methodology and Data Sources
15.1 Customization Offerings
15.2 Subscription Services
15.3 Related Reports
15.4 Publisher Expertise
LIST OF TABLES
Table 1 Market Segmentation Analysis
Table 2 Global Dietary Fibers Market Share of Leading Companies, 2023
Table 3 Product Offerings of Leading Companies
Table 4 Low Growth Scenario Forecasts
Table 5 Reference Case Growth Scenario
Table 6 High Growth Case Scenario
Table 7 Global Dietary Fibers Revenue (USD Million) And CAGR (%) By Type (2021-2032)
Table 8 Global Dietary Fibers Revenue (USD Million) And CAGR (%) By Application (2021-2032)
Table 9 Global Dietary Fibers Revenue (USD Million) And CAGR (%) By Product (2021-2032)
Table 10 Global Dietary Fibers Market Revenue (USD Million) By Regions (2021-2032)
Table 11 Global Dietary Fibers Market Share (%) By Regions (2021-2032)
Table 12 North America Dietary Fibers Revenue (USD Million) By Country (2021-2032)
Table 13 Europe Dietary Fibers Revenue (USD Million) By Country (2021-2032)
Table 14 Asia Pacific Dietary Fibers Revenue (USD Million) By Country (2021-2032)
Table 15 South America Dietary Fibers Revenue (USD Million) By Country (2021-2032)
Table 16 Middle East and Africa Dietary Fibers Revenue (USD Million) By Region (2021-2032)
Table 17 North America Dietary Fibers Revenue (USD Million) By Type (2021-2032)
Table 18 North America Dietary Fibers Revenue (USD Million) By Application (2021-2032)
Table 19 North America Dietary Fibers Revenue (USD Million) By Product (2021-2032)
Table 20 Europe Dietary Fibers Revenue (USD Million) By Type (2021-2032)
Table 21 Europe Dietary Fibers Revenue (USD Million) By Application (2021-2032)
Table 22 Europe Dietary Fibers Revenue (USD Million) By Product (2021-2032)
Table 23 Asia Pacific Dietary Fibers Revenue (USD Million) By Type (2021-2032)
Table 24 Asia Pacific Dietary Fibers Revenue (USD Million) By Application (2021-2032)
Table 25 Asia Pacific Dietary Fibers Revenue (USD Million) By Product (2021-2032)
Table 26 South America Dietary Fibers Revenue (USD Million) By Type (2021-2032)
Table 27 South America Dietary Fibers Revenue (USD Million) By Application (2021-2032)
Table 28 South America Dietary Fibers Revenue (USD Million) By Product (2021-2032)
Table 29 Middle East and Africa Dietary Fibers Revenue (USD Million) By Type (2021-2032)
Table 30 Middle East and Africa Dietary Fibers Revenue (USD Million) By Application (2021-2032)
Table 31 Middle East and Africa Dietary Fibers Revenue (USD Million) By Product (2021-2032)
LIST OF FIGURES
Figure 1. Market Scope
Figure 2. Pricing Forecasts Per Unit, 2023- 2032
Figure 3. Porter’s Five Forces
Figure 4. Global Dietary Fibers Market Revenue (USD Million) By Regions (2021-2032)
Figure 5. Global Dietary Fibers Market Share (%) By Regions (2023)
Figure 6. North America Dietary Fibers Revenue (USD Million) By Country (2021-2032)
Figure 7. United States Dietary Fibers Revenue (USD Million) By Country (2021-2032)
Figure 8. Canada Dietary Fibers Revenue (USD Million) By Country (2021-2032)
Figure 9. Mexico Dietary Fibers Revenue (USD Million) By Country (2021-2032)
Figure 10. Europe Dietary Fibers Revenue (USD Million) By Country (2021-2032)
Figure 11. Germany Dietary Fibers Revenue (USD Million) By Country (2021-2032)
Figure 12. France Dietary Fibers Revenue (USD Million) By Country (2021-2032)
Figure 13. United Kingdom Dietary Fibers Revenue (USD Million) By Country (2021-2032)
Figure 14. Spain Dietary Fibers Revenue (USD Million) By Country (2021-2032)
Figure 15. Italy Dietary Fibers Revenue (USD Million) By Country (2021-2032)
Figure 16. Russia Dietary Fibers Revenue (USD Million) By Country (2021-2032)
Figure 17. Rest of Europe Dietary Fibers Revenue (USD Million) By Country (2021-2032)
Figure 11. Asia Pacific Dietary Fibers Revenue (USD Million) By Country (2021-2032)
Figure 12. China Dietary Fibers Revenue (USD Million) By Country (2021-2032)
Figure 13. Japan Dietary Fibers Revenue (USD Million) By Country (2021-2032)
Figure 14. India Dietary Fibers Revenue (USD Million) By Country (2021-2032)
Figure 15. South Korea Dietary Fibers Revenue (USD Million) By Country (2021-2032)
Figure 16. Australia Dietary Fibers Revenue (USD Million) By Country (2021-2032)
Figure 17. South East Asia Dietary Fibers Revenue (USD Million) By Country (2021-2032)
Figure 18. South America Dietary Fibers Revenue (USD Million) By Country (2021-2032)
Figure 19. Brazil Dietary Fibers Revenue (USD Million) By Country (2021-2032)
Figure 20. Argentina Dietary Fibers Revenue (USD Million) By Country (2021-2032)
Figure 21. Rest of Asia Pacific Dietary Fibers Revenue (USD Million) By Country (2021-2032)
Figure 22. Middle East and Africa Dietary Fibers Revenue (USD Million) By Region (2021-2032)
Figure 23. Saudi Arabia Dietary Fibers Revenue (USD Million) By Region (2021-2032)
Figure 24. The UAE Dietary Fibers Revenue (USD Million) By Region (2021-2032)
Figure 25. Rest of Middle East Dietary Fibers Revenue (USD Million) By Region (2021-2032)
Figure 26. South Africa Dietary Fibers Revenue (USD Million) By Region (2021-2032)
Figure 27. Africa Dietary Fibers Revenue (USD Million) By Region (2021-2032)
Figure 28. North America Dietary Fibers Revenue (USD Million) By Type (2021-2032)
Figure 29. North America Dietary Fibers Revenue (USD Million) By Application (2021-2032)
Figure 30. North America Dietary Fibers Revenue (USD Million) By Product (2021-2032)
Figure 31. Europe Dietary Fibers Revenue (USD Million) By Type (2021-2032)
Figure 32. Europe Dietary Fibers Revenue (USD Million) By Application (2021-2032)
Figure 33. Europe Dietary Fibers Revenue (USD Million) By Product (2021-2032)
Figure 34. Asia Pacific Dietary Fibers Revenue (USD Million) By Type (2021-2032)
Figure 35. Asia Pacific Dietary Fibers Revenue (USD Million) By Application (2021-2032)
Figure 36. Asia Pacific Dietary Fibers Revenue (USD Million) By Product (2021-2032)
Figure 37. South America Dietary Fibers Revenue (USD Million) By Type (2021-2032)
Figure 38. South America Dietary Fibers Revenue (USD Million) By Application (2021-2032)
Figure 39. South America Dietary Fibers Revenue (USD Million) By Product (2021-2032)
Figure 40. Middle East and Africa Dietary Fibers Revenue (USD Million) By Type (2021-2032)
Figure 41. Middle East and Africa Dietary Fibers Revenue (USD Million) By Application (2021-2032)
Figure 42. Middle East and Africa Dietary Fibers Revenue (USD Million) By Product (2021-2032)
By Raw Material
Fruits & Vegetables
Cereals & Grains
Nuts & Seeds
Legumes
By Type
Insoluble
-Cellulose
-Hemicelluloses
-Chitin & Chitosan
-Lignin
-Oat Bran
-Wheat Fiber
-Others
Soluble
-Inulin
-Pectin
-Beta-Glucan
-Corn Fibers
-Others
By Application
Food and Beverages
Pharmaceuticals
Animal Feed
Others
Countries Analyzed
North America (US, Canada, Mexico)
Europe (Germany, UK, France, Spain, Italy, Russia, Rest of Europe)
Asia Pacific (China, India, Japan, South Korea, Australia, South East Asia, Rest of Asia)
South America (Brazil, Argentina, Rest of South America)
Middle East and Africa (Saudi Arabia, UAE, Rest of Middle East, South Africa, Egypt, Rest of Africa)
