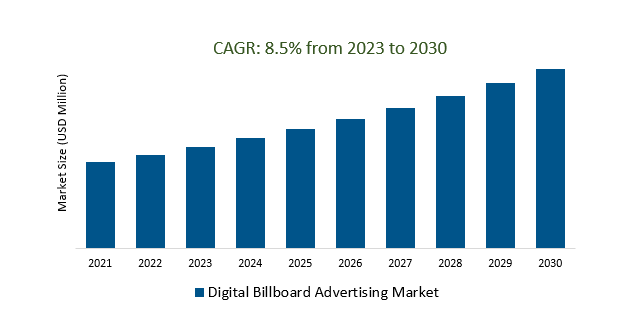
The Digital Billboard Advertising Market Size is estimated to register 8.5% growth over the forecast period from 2024 to 2030.
Digital Billboard Advertising Market Overview
The flexibility and interactivity offered by digital billboards, allowing real-time content updates, targeted advertising, and enhanced engagement with consumers are serving as a major driver. Technological advancements and the transition from traditional static billboards to dynamic, digital formats are significantly contributing to market expansion. Advertisers are leveraging features like real-time updates, augmented reality (AR), and interactive elements to enhance consumer engagement and create more memorable and impactful advertising experiences. Additionally, Digital billboards are increasingly integrating data analytics to tailor content based on audience demographics, behaviors, and location, enabling more personalized and relevant advertising content. Further, the increasing adoption of programmatic advertising and data-driven approaches for personalized content delivery are fueling the market growth.
Digital Billboard Advertising Market Dynamics
Market Trends- Digital Billboard Advertising emphasizes dynamic content for immersive brand engagement.
Focusing on deploying real-time, interactive, and captivating content on digital billboards, aiming to capture audience attention and foster deeper engagement are propelling the market.
Advertisers are increasingly leveraging dynamic elements such as live updates, augmented reality (AR), and interactive features to create immersive brand experiences.
Additionally, the utilization of data-driven strategies is enabling personalized content delivery based on location, time of day, or even audience demographics, elevating the relevance and effectiveness of advertising messages.
Market Driver- In the Digital Billboard Advertising Market, programmatic buying and measurement drive targeted ad placements and campaign optimization
Automation and data-driven insights are streamlining the ad purchasing process, offering advertisers enhanced targeting precision, real-time optimizations, and efficient campaign management, thereby driving the market.
Additionally, the integration of robust measurement tools, facilitating the evaluation of campaign performance, providing actionable insights for refining strategies are fueling the market growth.
Further, providing valuable insights into audience engagement, ad visibility, and conversion rates, facilitating data-driven decisions and optimizations for future campaigns are driving the expansion.
Market Opportunity- Sustainability and Energy Efficiency propels Digital Billboard Advertising Market.
The growing emphasis on eco-friendly practices, materials, and energy-efficient technologies in digital billboard installations are propelling the market.
Advertisers and billboard operators are increasingly opting for sustainable materials, such as recycled or recyclable components, to reduce environmental impact.
Additionally, advancements in energy-efficient technologies, such as LED displays and solar-powered systems are contributing to lowering operational energy consumption leading to market growth.
Market Share Analysis- Two-Sided Digital Billboard will register the fastest growth
The Digital Billboard Advertising Market is analyzed across One-Sided Digital Billboard and Two-Sided Digital Billboard. Two-Sided Digital Billboard is poised to register the fastest growth. Positioned strategically in high-traffic areas, intersections, or locations with multiple viewing angles, these billboards maximize visibility by displaying content on both sides. Their dual-sided nature allows advertisers to capture attention from audiences traveling in different directions, ensuring broader exposure and higher impressions. These billboards are particularly effective in urban environments, highways, or areas with heavy foot or vehicular traffic, leveraging their 180-degree visibility to engage viewers from various perspectives. The flexibility of two-sided digital billboards enables advertisers to showcase multiple campaigns or tailor content to suit different audiences within the same location. Furthermore, the technological advancements in these billboards facilitate dynamic content delivery, allowing real-time updates, creative flexibility, and interactive elements.
Market Share Analysis- Food and Beverages held a significant market share in 2023
The Digital Billboard Advertising Market is analyzed across various applications including Food and Beverages, Real Estate, Textile, Cosmetics, Automobile and Others. Of these, Food and Beverages held a significant market share in 2023. Digital billboards offer food and beverage brands a platform to showcase appetizing imagery, compelling messages, and time-sensitive promotions to captivate audiences in high-traffic locations. For restaurants, fast-food chains, or beverage companies, these billboards serve as a powerful tool to showcase menu items, new product launches, limited-time offers, or enticing visuals of delicious dishes and refreshing drinks. Deployed strategically in areas with high footfall or near dining establishments, digital billboards attract hungry or thirsty passersby, influencing their purchasing decisions in real-time. The dynamic nature of digital billboards allows food and beverage advertisers to customize content, schedule promotions based on peak hours, and create eye-catching campaigns.
Digital Billboard Advertising Market News
Lamar Advertising Unveils Innovative Vehicle Recognition Campaign for Paramount Pictures' Transformers: The Last Knight.
BIG Outdoor introduces Programmatic Capabilities through Collaborative Effort with Vistar Media.
Digital Billboard Advertising Market Segmentation
By Type
- One-Sided Digital Billboard
- Two-Sided Digital Billboard
By Application
- Food and Beverages
- Real Estate
- Textile
- Cosmetics
- Automobile
- Others
By Module
- SMD (Surface-Mount Device Light-Emitting Diode Module)
- DIP (Dual In-Line Package)
By Size
- 6m2
- 7.5m2
- 11m2
- 16.5m2
- 18m2
- Others
By Region
- North America (United States, Canada, Mexico)
- Europe (Germany, France, United Kingdom, Spain, Italy, Others)
- Asia Pacific (China, India, Japan, South Korea, Australia, Others)
- Latin America (Brazil, Argentina, Others)
- Middle East and Africa (Saudi Arabia, UAE, Kuwait, Other Middle East, South Africa, Nigeria, Other Africa)
Digital Billboard Advertising Market Companies
- Broadsign International LLC (Canada)
- Clear Channel Outdoor Holdings Inc (United States)
- Daktronics (United States)
- Formetco (United States)
- JCDecaux (France)
- Lamar Advertising Company (United States)
- Outfront Media Inc (United States)
- Prismview (United States)
- Watchfire Signs (United States)
*List not exhaustive
Digital Billboard Advertising Market Outlook 2023
1 Market Overview
1.1 Introduction to the Digital Billboard Advertising Market
1.2 Scope of the Study
1.3 Research Objective
1.3.1 Key Market Scope and Segments
1.3.2 Players Covered
1.3.3 Years Considered
2 Executive Summary
2.1 2023 Digital Billboard Advertising Industry- Market Statistics
3 Market Dynamics
3.1 Market Drivers
3.2 Market Challenges
3.3 Market Opportunities
3.4 Market Trends
4 Market Factor Analysis
4.1 Porter’s Five Forces
4.2 Market Entropy
4.2.1 Global Digital Billboard Advertising Market Companies with Area Served
4.2.2 Products Offerings Global Digital Billboard Advertising Market
5 COVID-19 Impact Analysis and Outlook Scenarios
5.1.1 Covid-19 Impact Analysis
5.1.2 post-COVID-19 Scenario- Low Growth Case
5.1.3 Post-COVID-19 Scenario- Reference Growth Case
5.1.4 Post-COVID-19 Scenario- Low Growth Case
6 Global Digital Billboard Advertising Market Trends
6.1 Global Digital Billboard Advertising Revenue (USD Million) and CAGR (%) by Type (2018-2030)
6.2 Global Digital Billboard Advertising Revenue (USD Million) and CAGR (%) by Applications (2018-2030)
6.3 Global Digital Billboard Advertising Revenue (USD Million) and CAGR (%) by Regions (2018-2030)
7 Global Digital Billboard Advertising Market Revenue (USD Million) by Type, and Applications (2018-2022)
7.1 Global Digital Billboard Advertising Revenue (USD Million) by Type (2018-2022)
7.1.1 Global Digital Billboard Advertising Revenue (USD Million), Market Share (%) by Type (2018-2022)
7.2 Global Digital Billboard Advertising Revenue (USD Million) by Applications (2018-2022)
7.2.1 Global Digital Billboard Advertising Revenue (USD Million), Market Share (%) by Applications (2018-2022)
8 Global Digital Billboard Advertising Development Regional Status and Outlook
8.1 Global Digital Billboard Advertising Revenue (USD Million) By Regions (2018-2022)
8.2 North America Digital Billboard Advertising Revenue (USD Million) by Type, and Application (2018-2022)
8.2.1 North America Digital Billboard Advertising Revenue (USD Million) by Country (2018-2022)
8.2.2 North America Digital Billboard Advertising Revenue (USD Million) by Type (2018-2022)
8.2.3 North America Digital Billboard Advertising Revenue (USD Million) by Applications (2018-2022)
8.3 Europe Digital Billboard Advertising Revenue (USD Million), by Type, and Applications (USD Million) (2018-2022)
8.3.1 Europe Digital Billboard Advertising Revenue (USD Million), by Country (2018-2022)
8.3.2 Europe Digital Billboard Advertising Revenue (USD Million) by Type (2018-2022)
8.3.3 Europe Digital Billboard Advertising Revenue (USD Million) by Applications (2018-2022)
8.4 Asia Pacific Digital Billboard Advertising Revenue (USD Million), and Revenue (USD Million) by Type, and Applications (2018-2022)
8.4.1 Asia Pacific Digital Billboard Advertising Revenue (USD Million) by Country (2018-2022)
8.4.2 Asia Pacific Digital Billboard Advertising Revenue (USD Million) by Type (2018-2022)
8.4.3 Asia Pacific Digital Billboard Advertising Revenue (USD Million) by Applications (2018-2022)
8.5 South America Digital Billboard Advertising Revenue (USD Million), by Type, and Applications (2018-2022)
8.5.1 South America Digital Billboard Advertising Revenue (USD Million), by Country (2018-2022)
8.5.2 South America Digital Billboard Advertising Revenue (USD Million) by Type (2018-2022)
8.5.3 South America Digital Billboard Advertising Revenue (USD Million) by Applications (2018-2022)
8.6 Middle East and Africa Digital Billboard Advertising Revenue (USD Million), by Type, Technology, Application, Thickness (2018-2022)
8.6.1 Middle East and Africa Digital Billboard Advertising Revenue (USD Million) by Country (2018-2022)
8.6.2 Middle East and Africa Digital Billboard Advertising Revenue (USD Million) by Type (2018-2022)
8.6.3 Middle East and Africa Digital Billboard Advertising Revenue (USD Million) by Applications (2018-2022)
9 Company Profiles
10 Global Digital Billboard Advertising Market Revenue (USD Million), by Type, and Applications (2023-2030)
10.1 Global Digital Billboard Advertising Revenue (USD Million) and Market Share (%) by Type (2023-2030)
10.1.1 Global Digital Billboard Advertising Revenue (USD Million), and Market Share (%) by Type (2023-2030)
10.2 Global Digital Billboard Advertising Revenue (USD Million) and Market Share (%) by Applications (2023-2030)
10.2.1 Global Digital Billboard Advertising Revenue (USD Million), and Market Share (%) by Applications (2023-2030)
11 Global Digital Billboard Advertising Development Regional Status and Outlook Forecast
11.1 Global Digital Billboard Advertising Revenue (USD Million) By Regions (2023-2030)
11.2 North America Digital Billboard Advertising Revenue (USD Million) by Type, and Applications (2023-2030)
11.2.1 North America Digital Billboard Advertising Revenue (USD) Million by Country (2023-2030)
11.2.2 North America Digital Billboard Advertising Revenue (USD Million), by Type (2023-2030)
11.2.3 North America Digital Billboard Advertising Revenue (USD Million), Market Share (%) by Applications (2023-2030)
11.3 Europe Digital Billboard Advertising Revenue (USD Million), by Type, and Applications (2023-2030)
11.3.1 Europe Digital Billboard Advertising Revenue (USD Million), by Country (2023-2030)
11.3.2 Europe Digital Billboard Advertising Revenue (USD Million), by Type (2023-2030)
11.3.3 Europe Digital Billboard Advertising Revenue (USD Million), by Applications (2023-2030)
11.4 Asia Pacific Digital Billboard Advertising Revenue (USD Million) by Type, and Applications (2023-2030)
11.4.1 Asia Pacific Digital Billboard Advertising Revenue (USD Million), by Country (2023-2030)
11.4.2 Asia Pacific Digital Billboard Advertising Revenue (USD Million), by Type (2023-2030)
11.4.3 Asia Pacific Digital Billboard Advertising Revenue (USD Million), by Applications (2023-2030)
11.5 South America Digital Billboard Advertising Revenue (USD Million), by Type, and Applications (2023-2030)
11.5.1 South America Digital Billboard Advertising Revenue (USD Million), by Country (2023-2030)
11.5.2 South America Digital Billboard Advertising Revenue (USD Million), by Type (2023-2030)
11.5.3 South America Digital Billboard Advertising Revenue (USD Million), by Applications (2023-2030)
11.6 Middle East and Africa Digital Billboard Advertising Revenue (USD Million), by Type, and Applications (2023-2030)
11.6.1 Middle East and Africa Digital Billboard Advertising Revenue (USD Million), by Region (2023-2030)
11.6.2 Middle East and Africa Digital Billboard Advertising Revenue (USD Million), by Type (2023-2030)
11.6.3 Middle East and Africa Digital Billboard Advertising Revenue (USD Million), by Applications (2023-2030)
12 Methodology and Data Sources
12.1 Methodology/Research Approach
12.1.1 Research Programs/Design
12.1.2 Market Size Estimation
12.1.3 Market Breakdown and Data Triangulation
12.2 Data Sources
12.2.1 Secondary Sources
12.2.2 Primary Sources
12.3 Disclaimer
List of Tables
Table 1 Market Segmentation Analysis
Table 2 Global Digital Billboard Advertising Market Companies with Areas Served
Table 3 Products Offerings Global Digital Billboard Advertising Market
Table 4 Low Growth Scenario Forecasts
Table 5 Reference Case Growth Scenario
Table 6 High Growth Case Scenario
Table 7 Global Digital Billboard Advertising Revenue (USD Million) And CAGR (%) By Type (2018-2030)
Table 8 Global Digital Billboard Advertising Revenue (USD Million) And CAGR (%) By Applications (2018-2030)
Table 9 Global Digital Billboard Advertising Revenue (USD Million) And CAGR (%) By Regions (2018-2030)
Table 10 Global Digital Billboard Advertising Revenue (USD Million) By Type (2018-2022)
Table 11 Global Digital Billboard Advertising Revenue Market Share (%) By Type (2018-2022)
Table 12 Global Digital Billboard Advertising Revenue (USD Million) By Applications (2018-2022)
Table 13 Global Digital Billboard Advertising Revenue Market Share (%) By Applications (2018-2022)
Table 14 Global Digital Billboard Advertising Market Revenue (USD Million) By Regions (2018-2022)
Table 15 Global Digital Billboard Advertising Market Share (%) By Regions (2018-2022)
Table 16 North America Digital Billboard Advertising Revenue (USD Million) By Country (2018-2022)
Table 17 North America Digital Billboard Advertising Revenue (USD Million) By Type (2018-2022)
Table 18 North America Digital Billboard Advertising Revenue (USD Million) By Applications (2018-2022)
Table 19 Europe Digital Billboard Advertising Revenue (USD Million) By Country (2018-2022)
Table 20 Europe Digital Billboard Advertising Revenue (USD Million) By Type (2018-2022)
Table 21 Europe Digital Billboard Advertising Revenue (USD Million) By Applications (2018-2022)
Table 22 Asia Pacific Digital Billboard Advertising Revenue (USD Million) By Country (2018-2022)
Table 23 Asia Pacific Digital Billboard Advertising Revenue (USD Million) By Type (2018-2022)
Table 24 Asia Pacific Digital Billboard Advertising Revenue (USD Million) By Applications (2018-2022)
Table 25 South America Digital Billboard Advertising Revenue (USD Million) By Country (2018-2022)
Table 26 South America Digital Billboard Advertising Revenue (USD Million) By Type (2018-2022)
Table 27 South America Digital Billboard Advertising Revenue (USD Million) By Applications (2018-2022)
Table 28 Middle East and Africa Digital Billboard Advertising Revenue (USD Million) By Region (2018-2022)
Table 29 Middle East and Africa Digital Billboard Advertising Revenue (USD Million) By Type (2018-2022)
Table 30 Middle East and Africa Digital Billboard Advertising Revenue (USD Million) By Applications (2018-2022)
Table 31 Financial Analysis
Table 32 Global Digital Billboard Advertising Revenue (USD Million) By Type (2023-2030)
Table 33 Global Digital Billboard Advertising Revenue Market Share (%) By Type (2023-2030)
Table 34 Global Digital Billboard Advertising Revenue (USD Million) By Applications (2023-2030)
Table 35 Global Digital Billboard Advertising Revenue Market Share (%) By Applications (2023-2030)
Table 36 Global Digital Billboard Advertising Market Revenue (USD Million), And Revenue (USD Million) By Regions (2023-2030)
Table 37 North America Digital Billboard Advertising Revenue (USD)By Country (2023-2030)
Table 38 North America Digital Billboard Advertising Revenue (USD Million) By Type (2023-2030)
Table 39 North America Digital Billboard Advertising Revenue (USD Million) By Applications (2023-2030)
Table 40 Europe Digital Billboard Advertising Revenue (USD Million) By Country (2023-2030)
Table 41 Europe Digital Billboard Advertising Revenue (USD Million) By Type (2023-2030)
Table 42 Europe Digital Billboard Advertising Revenue (USD Million) By Applications (2023-2030)
Table 43 Asia Pacific Digital Billboard Advertising Revenue (USD Million) By Country (2023-2030)
Table 44 Asia Pacific Digital Billboard Advertising Revenue (USD Million) By Type (2023-2030)
Table 45 Asia Pacific Digital Billboard Advertising Revenue (USD Million) By Applications (2023-2030)
Table 46 South America Digital Billboard Advertising Revenue (USD Million) By Country (2023-2030)
Table 47 South America Digital Billboard Advertising Revenue (USD Million) By Type (2023-2030)
Table 48 South America Digital Billboard Advertising Revenue (USD Million) By Applications (2023-2030)
Table 49 Middle East and Africa Digital Billboard Advertising Revenue (USD Million) By Region (2023-2030)
Table 50 Middle East and Africa Digital Billboard Advertising Revenue (USD Million) By Region (2023-2030)
Table 51 Middle East and Africa Digital Billboard Advertising Revenue (USD Million) By Type (2023-2030)
Table 52 Middle East and Africa Digital Billboard Advertising Revenue (USD Million) By Applications (2023-2030)
Table 53 Research Programs/Design for This Report
Table 54 Key Data Information from Secondary Sources
Table 55 Key Data Information from Primary Sources
List of Figures
Figure 1 Market Scope
Figure 2 Porter’s Five Forces
Figure 3 Global Digital Billboard Advertising Revenue (USD Million) By Type (2018-2022)
Figure 4 Global Digital Billboard Advertising Revenue Market Share (%) By Type (2022)
Figure 5 Global Digital Billboard Advertising Revenue (USD Million) By Applications (2018-2022)
Figure 6 Global Digital Billboard Advertising Revenue Market Share (%) By Applications (2022)
Figure 7 Global Digital Billboard Advertising Market Revenue (USD Million) By Regions (2018-2022)
Figure 8 Global Digital Billboard Advertising Market Share (%) By Regions (2022)
Figure 9 North America Digital Billboard Advertising Revenue (USD Million) By Country (2018-2022)
Figure 10 North America Digital Billboard Advertising Revenue (USD Million) By Type (2018-2022)
Figure 11 North America Digital Billboard Advertising Revenue (USD Million) By Applications (2018-2022)
Figure 12 Europe Digital Billboard Advertising Revenue (USD Million) By Country (2018-2022)
Figure 13 Europe Digital Billboard Advertising Revenue (USD Million) By Type (2018-2022)
Figure 14 Europe Digital Billboard Advertising Revenue (USD Million) By Applications (2018-2022)
Figure 15 Asia Pacific Digital Billboard Advertising Revenue (USD Million) By Country (2018-2022)
Figure 16 Asia Pacific Digital Billboard Advertising Revenue (USD Million) By Type (2018-2022)
Figure 17 Asia Pacific Digital Billboard Advertising Revenue (USD Million) By Applications (2018-2022)
Figure 18 South America Digital Billboard Advertising Revenue (USD Million) By Country (2018-2022)
Figure 19 South America Digital Billboard Advertising Revenue (USD Million) By Type (2018-2022)
Figure 20 South America Digital Billboard Advertising Revenue (USD Million) By Applications (2018-2022)
Figure 21 Middle East and Africa Digital Billboard Advertising Revenue (USD Million) By Region (2018-2022)
Figure 22 Middle East and Africa Digital Billboard Advertising Revenue (USD Million) By Type (2018-2022)
Figure 23 Middle East and Africa Digital Billboard Advertising Revenue (USD Million) By Applications (2018-2022)
Figure 24 Global Digital Billboard Advertising Revenue (USD Million) By Type (2023-2030)
Figure 25 Global Digital Billboard Advertising Revenue Market Share (%) By Type (2030)
Figure 26 Global Digital Billboard Advertising Revenue (USD Million) By Applications (2023-2030)
Figure 27 Global Digital Billboard Advertising Revenue Market Share (%) By Applications (2030)
Figure 28 Global Digital Billboard Advertising Market Revenue (USD Million) By Regions (2023-2030)
Figure 29 North America Digital Billboard Advertising Revenue (USD Million) By Country (2023-2030)
Figure 30 North America Digital Billboard Advertising Revenue (USD Million) By Type (2023-2030)
Figure 31 North America Digital Billboard Advertising Revenue (USD Million) By Applications (2023-2030)
Figure 32 Europe Digital Billboard Advertising Revenue (USD Million) By Country (2023-2030)
Figure 33 Europe Digital Billboard Advertising Revenue (USD Million) By Type (2023-2030)
Figure 34 Europe Digital Billboard Advertising Revenue (USD Million) By Applications (2023-2030)
Figure 35 Asia Pacific Digital Billboard Advertising Revenue (USD Million) By Country (2023-2030)
Figure 36 Asia Pacific Digital Billboard Advertising Revenue (USD Million) By Type (2023-2030)
Figure 37 Asia Pacific Digital Billboard Advertising Revenue (USD Million) By Applications (2023-2030)
Figure 38 South America Digital Billboard Advertising Revenue (USD Million) By Country (2023-2030)
Figure 39 South America Digital Billboard Advertising Revenue (USD Million) By Type (2023-2030)
Figure 40 South America Digital Billboard Advertising Revenue (USD Million) By Applications (2023-2030)
Figure 41 Middle East and Africa Digital Billboard Advertising Revenue (USD Million) By Region (2023-2030)
Figure 42 Middle East and Africa Digital Billboard Advertising Revenue (USD Million) By Region (2023-2030)
Figure 43 Middle East and Africa Digital Billboard Advertising Revenue (USD Million) By Type (2023-2030)
Figure 44 Middle East and Africa Digital Billboard Advertising Revenue (USD Million) By Applications (2023-2030)
Figure 45 Bottom-Up and Top-Down Approaches For This Report
Figure 46 Data Triangulation
