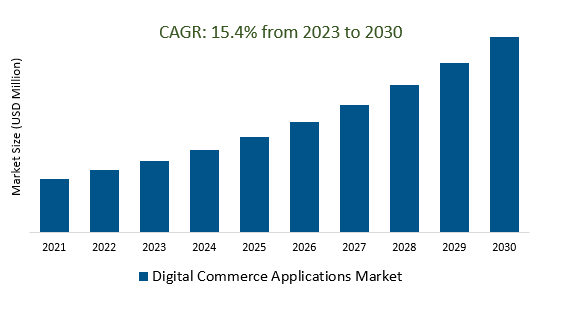
The global Digital Commerce Applications Market Size is estimated to register 15.4% growth over the forecast period from 2023 to 2030.
The market growth is driven predominantly by the increasing use of smartphones and mobile devices, consumers prefer to shop on the go. Mobile apps and optimized mobile websites are becoming crucial for businesses to provide seamless shopping experiences. Leading companies are AI and Automation, Hyper-Personalization, AR, VR, Mixed Reality, Voice and Conversational Commerce, E-Commerce Ecosystem Integration, and others to boost market shares in the industry.
Market Overview
The Digital Commerce Applications Market encompasses software solutions enabling businesses to conduct online transactions, manage e-commerce operations, and provide seamless shopping experiences. It includes e-commerce platforms, payment gateways, mobile commerce, personalization tools, omnichannel integration, AI-driven customer support, and more. Key trends include mobile optimization, AI-powered personalization, omnichannel strategies, the rise of marketplaces, sustainability focus, data privacy concerns, and social media influence. The market is driven by e-commerce growth, mobile adoption, and evolving consumer behaviors, while innovations like AI, blockchain, and data analytics shape its future trajectory.
Market Trends- Companies are launching AR and VR Integration to attract a consumer base
AR (Augmented Reality) and VR (Virtual Reality) integration in the Digital Commerce Applications Market involves the incorporation of these immersive technologies into online shopping experiences. AR enhances the real-world environment by overlaying digital elements, while VR creates entirely immersive virtual environments. Businesses are leveraging AR and VR to transform how customers interact with products, leading to enhanced engagement and informed purchasing decisions. Applications include virtual try-ons for fashion, furniture placement visualization, virtual showrooms, and interactive product demonstrations. These techno shopping markets customers to visualize products before buying, bridging the gap between online and in-store shopping.
Market Drives- Data Security and Privacy demand for efficient Digital Commerce Applications Market
Data security and privacy are critical concerns in the Digital Commerce Applications Market, given the sensitive nature of customer information and online transactions. Businesses must implement robust security measures to protect customer data from cyber threats, unauthorized access, and data breaches. This involves encryption of payment information, secure login processes, and adherence to industry standards like PCI DSS. Moreover, with growing data privacy regulations like GDPR and CCPA, businesses need to obtain explicit user consent for data collection, processing, and sharing. Transparent privacy policies and effective data management practices are essential to build trust with customers. As the market evolves, ensuring data security and respecting customer privacy will remain paramount to maintaining brand reputation and legal compliance.
Market Opportunity Introduction of AI-Powered Customer Support
AI-powered customer support is a prominent feature in the Digital Commerce Applications Market, involving the integration of artificial intelligence to enhance customer service interactions. Businesses utilize AI-driven chatbots and virtual assistants to provide instant and efficient support to customers throughout their shopping journey. These AI systems can answer frequently asked questions, assist with product recommendations, track orders, and even help with troubleshooting. The technology not only offers round-the-clock assistance but also frees up human agents to handle more complex inquiries, improving overall customer satisfaction. The trend contributes to streamlined customer experiences, faster query resolution, and cost-effective support solutions, ultimately bolstering customer loyalty and retention in the competitive digital commerce landscape.
The global Digital Commerce Applications Market is analyzed across Manufacturing and Telecom, Media and entertainment, BFSI, and other types. Of these, Manufacturing is poised to register the fastest growth. Manufacturing for the Digital Commerce Applications Market involves producing hardware components (such as payment processing solutions, AR/VR devices, POS systems, and IoT devices) and software solutions (e-commerce platforms, chatbots, analytics tools) that enable online retail operations. This includes creating technologies for secure transactions, mobile commerce, customer support, logistics, and data analysis. Manufacturers play a pivotal role in shaping the infrastructure and tools that empower businesses to succeed in the digital commerce ecosystem.
Market Share Analysis: Telecom held a significant market share in 2023
The global Digital Commerce Applications Market is analyzed across a wide range of applications Manufacturing, Telecom, Media and entertainment, BFSI, Retail & CPG, Healthcare and pharmaceutical, Travel and hospitality, and Others. Of these, individuals held a significant market share in 2023. Telecom plays a crucial role in the Digital Commerce Applications Market by providing the essential connectivity and communication infrastructure that enables online transactions and seamless digital shopping experiences. Telecom companies offer the internet connectivity that powers e-commerce platforms, mobile apps, and online marketplaces. They facilitate secure data transfer for payment processing, ensure responsive websites and mobile apps for customers, and enable real-time communication channels such as chat support and notifications. Telecom technologies like 4G/5G networks, broadband, and fiber-optic connections are fundamental to delivering fast and reliable online shopping experiences, making them a foundational element in the digital commerce landscape.
Digital Commerce Applications Market Segmentation
By Type
- Hardware
- Software
- Services
By Application
- Manufacturing
- Telecom
- Media & Entertainment
- BFSI
- Retail & CPG
- Healthcare & Pharmaceutical
- Travel & Hospitality
- Others
By Component
- Digital Platforms
- Payment & Order Processing
- Digital Marketing
- Analytics
- Others
By Enterprise Size
- Large Enterprises
- Small & Medium Enterprises
By Region
- North America (United States, Canada, Mexico)
- Europe (Germany, France, United Kingdom, Spain, Italy, Others)
- Asia Pacific (China, India, Japan, South Korea, Australia, Others)
- Latin America (Brazil, Argentina, Others)
- Middle East and Africa (Saudi Arabia, UAE, Kuwait, Other Middle East, South Africa, Nigeria, Other Africa)
Digital Commerce Applications Market Companies
- Tata Consultancy Services
- Infosys
- International Business Machines
- Salesforce
- Cognizant Technology Solution
- Oracle
- Visa
- Shopify
- Tencent Holdings
- Digital Turbine
* List not exhaustive
Digital Commerce Applications Market Outlook 2023
1 Market Overview
1.1 Introduction to the Digital Commerce Applications Market
1.2 Scope of the Study
1.3 Research Objective
1.3.1 Key Market Scope and Segments
1.3.2 Players Covered
1.3.3 Years Considered
2 Executive Summary
2.1 2023 Digital Commerce Applications Industry- Market Statistics
3 Market Dynamics
3.1 Market Drivers
3.2 Market Challenges
3.3 Market Opportunities
3.4 Market Trends
4 Market Factor Analysis
4.1 Porter’s Five Forces
4.2 Market Entropy
4.2.1 Global Digital Commerce Applications Market Companies with Area Served
4.2.2 Products Offerings Global Digital Commerce Applications Market
5 COVID-19 Impact Analysis and Outlook Scenarios
5.1.1 Covid-19 Impact Analysis
5.1.2 Post-COVID-19 Scenario- Low Growth Case
5.1.3 Post-COVID-19 Scenario- Reference Growth Case
5.1.4 Post-COVID-19 Scenario- Low Growth Case
6 Global Digital Commerce Applications Market Trends
6.1 Global Digital Commerce Applications Revenue (USD Million) and CAGR (%) by Type (2018-2030)
6.2 Global Digital Commerce Applications Revenue (USD Million) and CAGR (%) by Applications (2018-2030)
6.3 Global Digital Commerce Applications Revenue (USD Million) and CAGR (%) by Regions (2018-2030)
7 Global Digital Commerce Applications Market Revenue (USD Million) by Type, and Applications (2018-2022)
7.1 Global Digital Commerce Applications Revenue (USD Million) by Type (2018-2022)
7.1.1 Global Digital Commerce Applications Revenue (USD Million), Market Share (%) by Type (2018-2022)
7.2 Global Digital Commerce Applications Revenue (USD Million) by Applications (2018-2022)
7.2.1 Global Digital Commerce Applications Revenue (USD Million), Market Share (%) by Applications (2018-2022)
8 Global Digital Commerce Applications Development Regional Status and Outlook
8.1 Global Digital Commerce Applications Revenue (USD Million) By Regions (2018-2022)
8.2 North America Digital Commerce Applications Revenue (USD Million) by Type, and Application (2018-2022)
8.2.1 North America Digital Commerce Applications Revenue (USD Million) by Country (2018-2022)
8.2.2 North America Digital Commerce Applications Revenue (USD Million) by Type (2018-2022)
8.2.3 North America Digital Commerce Applications Revenue (USD Million) by Applications (2018-2022)
8.3 Europe Digital Commerce Applications Revenue (USD Million), by Type, and Applications (USD Million) (2018-2022)
8.3.1 Europe Digital Commerce Applications Revenue (USD Million), by Country (2018-2022)
8.3.2 Europe Digital Commerce Applications Revenue (USD Million) by Type (2018-2022)
8.3.3 Europe Digital Commerce Applications Revenue (USD Million) by Applications (2018-2022)
8.4 Asia Pacific Digital Commerce Applications Revenue (USD Million), and Revenue (USD Million) by Type, and Applications (2018-2022)
8.4.1 Asia Pacific Digital Commerce Applications Revenue (USD Million) by Country (2018-2022)
8.4.2 Asia Pacific Digital Commerce Applications Revenue (USD Million) by Type (2018-2022)
8.4.3 Asia Pacific Digital Commerce Applications Revenue (USD Million) by Applications (2018-2022)
8.5 South America Digital Commerce Applications Revenue (USD Million), by Type, and Applications (2018-2022)
8.5.1 South America Digital Commerce Applications Revenue (USD Million), by Country (2018-2022)
8.5.2 South America Digital Commerce Applications Revenue (USD Million) by Type (2018-2022)
8.5.3 South America Digital Commerce Applications Revenue (USD Million) by Applications (2018-2022)
8.6 Middle East and Africa Digital Commerce Applications Revenue (USD Million), by Type, Technology, Application, Thickness (2018-2022)
8.6.1 Middle East and Africa Digital Commerce Applications Revenue (USD Million) by Country (2018-2022)
8.6.2 Middle East and Africa Digital Commerce Applications Revenue (USD Million) by Type (2018-2022)
8.6.3 Middle East and Africa Digital Commerce Applications Revenue (USD Million) by Applications (2018-2022)
9 Company Profiles
10 Global Digital Commerce Applications Market Revenue (USD Million), by Type, and Applications (2023-2030)
10.1 Global Digital Commerce Applications Revenue (USD Million) and Market Share (%) by Type (2023-2030)
10.1.1 Global Digital Commerce Applications Revenue (USD Million), and Market Share (%) by Type (2023-2030)
10.2 Global Digital Commerce Applications Revenue (USD Million) and Market Share (%) by Applications (2023-2030)
10.2.1 Global Digital Commerce Applications Revenue (USD Million), and Market Share (%) by Applications (2023-2030)
11 Global Digital Commerce Applications Development Regional Status and Outlook Forecast
11.1 Global Digital Commerce Applications Revenue (USD Million) By Regions (2023-2030)
11.2 North America Digital Commerce Applications Revenue (USD Million) by Type, and Applications (2023-2030)
11.2.1 North America Digital Commerce Applications Revenue (USD) Million by Country (2023-2030)
11.2.2 North America Digital Commerce Applications Revenue (USD Million), by Type (2023-2030)
11.2.3 North America Digital Commerce Applications Revenue (USD Million), Market Share (%) by Applications (2023-2030)
11.3 Europe Digital Commerce Applications Revenue (USD Million), by Type, and Applications (2023-2030)
11.3.1 Europe Digital Commerce Applications Revenue (USD Million), by Country (2023-2030)
11.3.2 Europe Digital Commerce Applications Revenue (USD Million), by Type (2023-2030)
11.3.3 Europe Digital Commerce Applications Revenue (USD Million), by Applications (2023-2030)
11.4 Asia Pacific Digital Commerce Applications Revenue (USD Million) by Type, and Applications (2023-2030)
11.4.1 Asia Pacific Digital Commerce Applications Revenue (USD Million), by Country (2023-2030)
11.4.2 Asia Pacific Digital Commerce Applications Revenue (USD Million), by Type (2023-2030)
11.4.3 Asia Pacific Digital Commerce Applications Revenue (USD Million), by Applications (2023-2030)
11.5 South America Digital Commerce Applications Revenue (USD Million), by Type, and Applications (2023-2030)
11.5.1 South America Digital Commerce Applications Revenue (USD Million), by Country (2023-2030)
11.5.2 South America Digital Commerce Applications Revenue (USD Million), by Type (2023-2030)
11.5.3 South America Digital Commerce Applications Revenue (USD Million), by Applications (2023-2030)
11.6 Middle East and Africa Digital Commerce Applications Revenue (USD Million), by Type, and Applications (2023-2030)
11.6.1 Middle East and Africa Digital Commerce Applications Revenue (USD Million), by Region (2023-2030)
11.6.2 Middle East and Africa Digital Commerce Applications Revenue (USD Million), by Type (2023-2030)
11.6.3 Middle East and Africa Digital Commerce Applications Revenue (USD Million), by Applications (2023-2030)
12 Methodology and Data Sources
12.1 Methodology/Research Approach
12.1.1 Research Programs/Design
12.1.2 Market Size Estimation
12.1.3 Market Breakdown and Data Triangulation
12.2 Data Sources
12.2.1 Secondary Sources
12.2.2 Primary Sources
12.3 Disclaimer
List of Tables
Table 1 Market Segmentation Analysis
Table 2 Global Digital Commerce Applications Market Companies with Areas Served
Table 3 Products Offerings Global Digital Commerce Applications Market
Table 4 Low Growth Scenario Forecasts
Table 5 Reference Case Growth Scenario
Table 6 High Growth Case Scenario
Table 7 Global Digital Commerce Applications Revenue (USD Million) And CAGR (%) By Type (2018-2030)
Table 8 Global Digital Commerce Applications Revenue (USD Million) And CAGR (%) By Applications (2018-2030)
Table 9 Global Digital Commerce Applications Revenue (USD Million) And CAGR (%) By Regions (2018-2030)
Table 10 Global Digital Commerce Applications Revenue (USD Million) By Type (2018-2022)
Table 11 Global Digital Commerce Applications Revenue Market Share (%) By Type (2018-2022)
Table 12 Global Digital Commerce Applications Revenue (USD Million) By Applications (2018-2022)
Table 13 Global Digital Commerce Applications Revenue Market Share (%) By Applications (2018-2022)
Table 14 Global Digital Commerce Applications Market Revenue (USD Million) By Regions (2018-2022)
Table 15 Global Digital Commerce Applications Market Share (%) By Regions (2018-2022)
Table 16 North America Digital Commerce Applications Revenue (USD Million) By Country (2018-2022)
Table 17 North America Digital Commerce Applications Revenue (USD Million) By Type (2018-2022)
Table 18 North America Digital Commerce Applications Revenue (USD Million) By Applications (2018-2022)
Table 19 Europe Digital Commerce Applications Revenue (USD Million) By Country (2018-2022)
Table 20 Europe Digital Commerce Applications Revenue (USD Million) By Type (2018-2022)
Table 21 Europe Digital Commerce Applications Revenue (USD Million) By Applications (2018-2022)
Table 22 Asia Pacific Digital Commerce Applications Revenue (USD Million) By Country (2018-2022)
Table 23 Asia Pacific Digital Commerce Applications Revenue (USD Million) By Type (2018-2022)
Table 24 Asia Pacific Digital Commerce Applications Revenue (USD Million) By Applications (2018-2022)
Table 25 South America Digital Commerce Applications Revenue (USD Million) By Country (2018-2022)
Table 26 South America Digital Commerce Applications Revenue (USD Million) By Type (2018-2022)
Table 27 South America Digital Commerce Applications Revenue (USD Million) By Applications (2018-2022)
Table 28 Middle East and Africa Digital Commerce Applications Revenue (USD Million) By Region (2018-2022)
Table 29 Middle East and Africa Digital Commerce Applications Revenue (USD Million) By Type (2018-2022)
Table 30 Middle East and Africa Digital Commerce Applications Revenue (USD Million) By Applications (2018-2022)
Table 31 Financial Analysis
Table 32 Global Digital Commerce Applications Revenue (USD Million) By Type (2023-2030)
Table 33 Global Digital Commerce Applications Revenue Market Share (%) By Type (2023-2030)
Table 34 Global Digital Commerce Applications Revenue (USD Million) By Applications (2023-2030)
Table 35 Global Digital Commerce Applications Revenue Market Share (%) By Applications (2023-2030)
Table 36 Global Digital Commerce Applications Market Revenue (USD Million), And Revenue (USD Million) By Regions (2023-2030)
Table 37 North America Digital Commerce Applications Revenue (USD)By Country (2023-2030)
Table 38 North America Digital Commerce Applications Revenue (USD Million) By Type (2023-2030)
Table 39 North America Digital Commerce Applications Revenue (USD Million) By Applications (2023-2030)
Table 40 Europe Digital Commerce Applications Revenue (USD Million) By Country (2023-2030)
Table 41 Europe Digital Commerce Applications Revenue (USD Million) By Type (2023-2030)
Table 42 Europe Digital Commerce Applications Revenue (USD Million) By Applications (2023-2030)
Table 43 Asia Pacific Digital Commerce Applications Revenue (USD Million) By Country (2023-2030)
Table 44 Asia Pacific Digital Commerce Applications Revenue (USD Million) By Type (2023-2030)
Table 45 Asia Pacific Digital Commerce Applications Revenue (USD Million) By Applications (2023-2030)
Table 46 South America Digital Commerce Applications Revenue (USD Million) By Country (2023-2030)
Table 47 South America Digital Commerce Applications Revenue (USD Million) By Type (2023-2030)
Table 48 South America Digital Commerce Applications Revenue (USD Million) By Applications (2023-2030)
Table 49 Middle East and Africa Digital Commerce Applications Revenue (USD Million) By Region (2023-2030)
Table 50 Middle East and Africa Digital Commerce Applications Revenue (USD Million) By Region (2023-2030)
Table 51 Middle East and Africa Digital Commerce Applications Revenue (USD Million) By Type (2023-2030)
Table 52 Middle East and Africa Digital Commerce Applications Revenue (USD Million) By Applications (2023-2030)
Table 53 Research Programs/Design for This Report
Table 54 Key Data Information from Secondary Sources
Table 55 Key Data Information from Primary Sources
List of Figures
Figure 1 Market Scope
Figure 2 Porter’s Five Forces
Figure 3 Global Digital Commerce Applications Revenue (USD Million) By Type (2018-2022)
Figure 4 Global Digital Commerce Applications Revenue Market Share (%) By Type (2022)
Figure 5 Global Digital Commerce Applications Revenue (USD Million) By Applications (2018-2022)
Figure 6 Global Digital Commerce Applications Revenue Market Share (%) By Applications (2022)
Figure 7 Global Digital Commerce Applications Market Revenue (USD Million) By Regions (2018-2022)
Figure 8 Global Digital Commerce Applications Market Share (%) By Regions (2022)
Figure 9 North America Digital Commerce Applications Revenue (USD Million) By Country (2018-2022)
Figure 10 North America Digital Commerce Applications Revenue (USD Million) By Type (2018-2022)
Figure 11 North America Digital Commerce Applications Revenue (USD Million) By Applications (2018-2022)
Figure 12 Europe Digital Commerce Applications Revenue (USD Million) By Country (2018-2022)
Figure 13 Europe Digital Commerce Applications Revenue (USD Million) By Type (2018-2022)
Figure 14 Europe Digital Commerce Applications Revenue (USD Million) By Applications (2018-2022)
Figure 15 Asia Pacific Digital Commerce Applications Revenue (USD Million) By Country (2018-2022)
Figure 16 Asia Pacific Digital Commerce Applications Revenue (USD Million) By Type (2018-2022)
Figure 17 Asia Pacific Digital Commerce Applications Revenue (USD Million) By Applications (2018-2022)
Figure 18 South America Digital Commerce Applications Revenue (USD Million) By Country (2018-2022)
Figure 19 South America Digital Commerce Applications Revenue (USD Million) By Type (2018-2022)
Figure 20 South America Digital Commerce Applications Revenue (USD Million) By Applications (2018-2022)
Figure 21 Middle East and Africa Digital Commerce Applications Revenue (USD Million) By Region (2018-2022)
Figure 22 Middle East and Africa Digital Commerce Applications Revenue (USD Million) By Type (2018-2022)
Figure 23 Middle East and Africa Digital Commerce Applications Revenue (USD Million) By Applications (2018-2022)
Figure 24 Global Digital Commerce Applications Revenue (USD Million) By Type (2023-2030)
Figure 25 Global Digital Commerce Applications Revenue Market Share (%) By Type (2030)
Figure 26 Global Digital Commerce Applications Revenue (USD Million) By Applications (2023-2030)
Figure 27 Global Digital Commerce Applications Revenue Market Share (%) By Applications (2030)
Figure 28 Global Digital Commerce Applications Market Revenue (USD Million) By Regions (2023-2030)
Figure 29 North America Digital Commerce Applications Revenue (USD Million) By Country (2023-2030)
Figure 30 North America Digital Commerce Applications Revenue (USD Million) By Type (2023-2030)
Figure 31 North America Digital Commerce Applications Revenue (USD Million) By Applications (2023-2030)
Figure 32 Europe Digital Commerce Applications Revenue (USD Million) By Country (2023-2030)
Figure 33 Europe Digital Commerce Applications Revenue (USD Million) By Type (2023-2030)
Figure 34 Europe Digital Commerce Applications Revenue (USD Million) By Applications (2023-2030)
Figure 35 Asia Pacific Digital Commerce Applications Revenue (USD Million) By Country (2023-2030)
Figure 36 Asia Pacific Digital Commerce Applications Revenue (USD Million) By Type (2023-2030)
Figure 37 Asia Pacific Digital Commerce Applications Revenue (USD Million) By Applications (2023-2030)
Figure 38 South America Digital Commerce Applications Revenue (USD Million) By Country (2023-2030)
Figure 39 South America Digital Commerce Applications Revenue (USD Million) By Type (2023-2030)
Figure 40 South America Digital Commerce Applications Revenue (USD Million) By Applications (2023-2030)
Figure 41 Middle East and Africa Digital Commerce Applications Revenue (USD Million) By Region (2023-2030)
Figure 42 Middle East and Africa Digital Commerce Applications Revenue (USD Million) By Region (2023-2030)
Figure 43 Middle East and Africa Digital Commerce Applications Revenue (USD Million) By Type (2023-2030)
Figure 44 Middle East and Africa Digital Commerce Applications Revenue (USD Million) By Applications (2023-2030)
Figure 45 Bottom-Up and Top-Down Approaches For This Report
Figure 46 Data Triangulation
