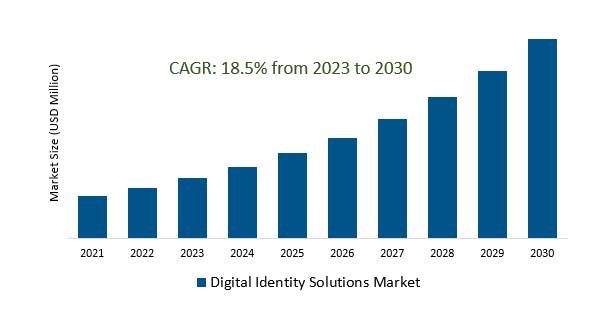
The Digital Identity Solutions Market Size is estimated to register 18.5% growth over the forecast period from 2023 to 2030.
Digital Identity Solutions Market Overview
The rapid growth in online services, e-commerce, and digital transactions are driving the need for secure and seamless digital identity verification solutions. The integration of blockchain technology to create decentralized and more secure digital identity solutions, providing users with more control over their personal data and enhancing privacy and security is propelling the market. Zero-trust security approach, where identity verification is continuously evaluated and authenticated at every stage of accessing digital services or data, enhancing overall security posture. Emerging interest in self-sovereign identity frameworks, allowing individuals to have more control over their digital identities, enhancing privacy and reducing reliance on centralized authorities are the driving factors. Further, the ongoing global digital transformation across industries is driving the need for scalable, interoperable, and trustworthy digital identity solutions to support these changes.
Digital Identity Solutions Market Dynamics
Market Trends- Convergence of Physical and Digital Identities is unifying Identity Experiences in the Digital Identity Solutions Market.
By merging physical and digital identities, users are experiencing a more seamless and convenient authentication process, reducing the need for multiple credentials or verification steps.
Additionally, the convergence of physical and digital identities is promoting interoperability and efficiency, enabling individuals to access services or facilities across various platforms or physical locations with a single, unified identity.
Further, the ongoing digital transformation across industries drives the market to unify physical and digital identities for seamless interactions and transactions in both online and offline environments.
Market Driver- Elevated Cybersecurity Concerns drives the demand for Digital Identity Solutions Market.
Heightened concerns about the vulnerability of digital identity systems due to proliferation of advanced cyber threats, including identity theft, data breaches, and ransomware attacks are driving the market growth.
The rapid expansion of digital services and online transactions are increasing the exposure of personal and sensitive data, making it a prime target for cybercriminals, leading to the adoption of Digital Identity Solutions.
Additionally, the increased reliance on digital platforms for work, communication, and commerce are magnifying the impact of identity-related cyber threats, further emphasizing the importance of robust security measures.
Market Opportunity- Introduction of Biometric Authentication Adoption drives the Digital Identity Solutions Market.
The heightened security features and accuracy compared to traditional authentication methods like passwords or PINs, reducing the risk of identity theft or unauthorized access are the key factors.
Multi-factor authentication (MFA), combining biometrics with other authentication factors, is gaining popularity for its enhanced security measures.
Additionally, the compatibility of biometric authentication with mobile devices and IoT technologies, along with its applications across various industries like finance, healthcare, and government sectors, further drives the widespread of the market.
Market Share Analysis- Facial Recognition will register the fastest growth.
The Digital Identity Solutions Market is analyzed across Fingerprint Recognition, Facial Recognition, Iris Recognition, Voice Recognition, Non-biometric & Others. Facial Recognition is poised to register the fastest growth. It operates by capturing and analyzing facial features from images or video footage to verify an individual's identity. This technology has gained prominence due to its versatility and wide-ranging applications across various industries. In the realm of security, Facial Recognition plays a vital role in access control systems, surveillance, and law enforcement, enabling quick and accurate identification of individuals. Moreover, its integration into mobile devices has facilitated biometric authentication, enhancing device security and user convenience. In retail and marketing, Facial Recognition enables personalized customer experiences, offering tailored services based on identified customer preferences. However, advancements in machine learning and AI algorithms continue to refine Facial Recognition's accuracy and reliability, driving its continual integration into digital identity solutions and broader applications across industries.
Market Share Analysis- Identity Verification held a significant market share in 2023.
The Digital Identity Solutions Market is analyzed across various solutions including Identity Verification, Authentication, Identity Lifecycle Management & Others. Of these, Identity Verification held a significant market share in 2023. This process involves verifying and validating personal information provided by users, ensuring they are who they claim to be. Identity Verification solutions employ diverse approaches such as document authentication, biometric verification, knowledge-based authentication, and behavioral analysis. Document authentication verifies the legitimacy of identity documents like passports or driver's licenses through advanced scanning and verification technologies. Biometric verification utilizes unique biological traits such as fingerprints, facial features, or iris scans for accurate identity confirmation. Knowledge-based methods involve asking individuals specific questions based on personal information to verify their identity. Additionally, behavioral analysis examines patterns in user behavior to establish identity authenticity.
Digital Identity Solutions Market Segmentation
By Type
By Identity Type
- Fingerprint Recognition
- Facial Recognition
- Iris Recognition
- Voice Recognition
- Non-biometric
- Others
By Solution
- Identity Verification
- Authentication
- Identity Lifecycle Management
- Others
By Deployment
By Industry
- BFSI
- Retail and Ecommerce
- Travel & Hospitality
- Government and Défense
- Healthcare
- IT and Telecommunication
- Energy and Utilities
- Others
By Region
- North America (United States, Canada, Mexico)
- Europe (Germany, France, United Kingdom, Spain, Italy, Others)
- Asia Pacific (China, India, Japan, South Korea, Australia, Others)
- Latin America (Brazil, Argentina, Others)
- Middle East and Africa (Saudi Arabia, UAE, Kuwait, Other Middle East, South Africa, Nigeria, Other Africa)
Digital Identity Solutions Market Companies
- NEC (Japan)
- Samsung SDS (South Korea)
- Thales (France)
- Telus (Canada)
- IDEMIA (France)
- GBG (United Kingdom)
- Tessi (France)
- Daon (United States)
- ForgeRock (United States)
- ImageWare (United States)
- Jumio (United States)
- iProov (United Kingdom)
- Refinitiv (United Kingdom)
- OneSpan (United States)
- Smartmatic (United Kingdom)
- Freja EID Group (Sweden)
- Vintegris (Spain)
- AU10TIX (Israel)
- Signicat (Norway)
- Duo Security (United States)
- Syntizen (India)
- Hashcash Consultant (United States)
- Good Digital Identity (Czech Republic)
*List not exhaustive
Digital Identity Solutions Market Outlook 2023
1 Market Overview
1.1 Introduction to the Digital Identity Solutions Market
1.2 Scope of the Study
1.3 Research Objective
1.3.1 Key Market Scope and Segments
1.3.2 Players Covered
1.3.3 Years Considered
2 Executive Summary
2.1 2023 Digital Identity Solutions Industry- Market Statistics
3 Market Dynamics
3.1 Market Drivers
3.2 Market Challenges
3.3 Market Opportunities
3.4 Market Trends
4 Market Factor Analysis
4.1 Porter’s Five Forces
4.2 Market Entropy
4.2.1 Global Digital Identity Solutions Market Companies with Area Served
4.2.2 Products Offerings Global Digital Identity Solutions Market
5 COVID-19 Impact Analysis and Outlook Scenarios
5.1.1 Covid-19 Impact Analysis
5.1.2 post-COVID-19 Scenario- Low Growth Case
5.1.3 post-COVID-19 Scenario- Reference Growth Case
5.1.4 post-COVID-19 Scenario- Low Growth Case
6 Global Digital Identity Solutions Market Trends
6.1 Global Digital Identity Solutions Revenue (USD Million) and CAGR (%) by Type (2018-2030)
6.2 Global Digital Identity Solutions Revenue (USD Million) and CAGR (%) by Applications (2018-2030)
6.3 Global Digital Identity Solutions Revenue (USD Million) and CAGR (%) by regions (2018-2030)
7 Global Digital Identity Solutions Market Revenue (USD Million) by Type, and Applications (2018-2022)
7.1 Global Digital Identity Solutions Revenue (USD Million) by Type (2018-2022)
7.1.1 Global Digital Identity Solutions Revenue (USD Million), Market Share (%) by Type (2018-2022)
7.2 Global Digital Identity Solutions Revenue (USD Million) by Applications (2018-2022)
7.2.1 Global Digital Identity Solutions Revenue (USD Million), Market Share (%) by Applications (2018-2022)
8 Global Digital Identity Solutions Development Regional Status and Outlook
8.1 Global Digital Identity Solutions Revenue (USD Million) By Regions (2018-2022)
8.2 North America Digital Identity Solutions Revenue (USD Million) by Type, and Application (2018-2022)
8.2.1 North America Digital Identity Solutions Revenue (USD Million) by Country (2018-2022)
8.2.2 North America Digital Identity Solutions Revenue (USD Million) by Type (2018-2022)
8.2.3 North America Digital Identity Solutions Revenue (USD Million) by Applications (2018-2022)
8.3 Europe Digital Identity Solutions Revenue (USD Million), by Type, and Applications (USD Million) (2018-2022)
8.3.1 Europe Digital Identity Solutions Revenue (USD Million), by Country (2018-2022)
8.3.2 Europe Digital Identity Solutions Revenue (USD Million) by Type (2018-2022)
8.3.3 Europe Digital Identity Solutions Revenue (USD Million) by Applications (2018-2022)
8.4 Asia Pacific Digital Identity Solutions Revenue (USD Million), and Revenue (USD Million) by Type, and Applications (2018-2022)
8.4.1 Asia Pacific Digital Identity Solutions Revenue (USD Million) by Country (2018-2022)
8.4.2 Asia Pacific Digital Identity Solutions Revenue (USD Million) by Type (2018-2022)
8.4.3 Asia Pacific Digital Identity Solutions Revenue (USD Million) by Applications (2018-2022)
8.5 South America Digital Identity Solutions Revenue (USD Million), by Type, and Applications (2018-2022)
8.5.1 South America Digital Identity Solutions Revenue (USD Million), by Country (2018-2022)
8.5.2 South America Digital Identity Solutions Revenue (USD Million) by Type (2018-2022)
8.5.3 South America Digital Identity Solutions Revenue (USD Million) by Applications (2018-2022)
8.6 Middle East and Africa Digital Identity Solutions Revenue (USD Million), by Type, Technology, Application, Thickness (2018-2022)
8.6.1 Middle East and Africa Digital Identity Solutions Revenue (USD Million) by Country (2018-2022)
8.6.2 Middle East and Africa Digital Identity Solutions Revenue (USD Million) by Type (2018-2022)
8.6.3 Middle East and Africa Digital Identity Solutions Revenue (USD Million) by Applications (2018-2022)
9 Company Profiles
10 Global Digital Identity Solutions Market Revenue (USD Million), by Type, and Applications (2023-2030)
10.1 Global Digital Identity Solutions Revenue (USD Million) and Market Share (%) by Type (2023-2030)
10.1.1 Global Digital Identity Solutions Revenue (USD Million), and Market Share (%) by Type (2023-2030)
10.2 Global Digital Identity Solutions Revenue (USD Million) and Market Share (%) by Applications (2023-2030)
10.2.1 Global Digital Identity Solutions Revenue (USD Million), and Market Share (%) by Applications (2023-2030)
11 Global Digital Identity Solutions Development Regional Status and Outlook Forecast
11.1 Global Digital Identity Solutions Revenue (USD Million) By Regions (2023-2030)
11.2 North America Digital Identity Solutions Revenue (USD Million) by Type, and Applications (2023-2030)
11.2.1 North America Digital Identity Solutions Revenue (USD) Million by Country (2023-2030)
11.2.2 North America Digital Identity Solutions Revenue (USD Million), by Type (2023-2030)
11.2.3 North America Digital Identity Solutions Revenue (USD Million), Market Share (%) by Applications (2023-2030)
11.3 Europe Digital Identity Solutions Revenue (USD Million), by Type, and Applications (2023-2030)
11.3.1 Europe Digital Identity Solutions Revenue (USD Million), by Country (2023-2030)
11.3.2 Europe Digital Identity Solutions Revenue (USD Million), by Type (2023-2030)
11.3.3 Europe Digital Identity Solutions Revenue (USD Million), by Applications (2023-2030)
11.4 Asia Pacific Digital Identity Solutions Revenue (USD Million) by Type, and Applications (2023-2030)
11.4.1 Asia Pacific Digital Identity Solutions Revenue (USD Million), by Country (2023-2030)
11.4.2 Asia Pacific Digital Identity Solutions Revenue (USD Million), by Type (2023-2030)
11.4.3 Asia Pacific Digital Identity Solutions Revenue (USD Million), by Applications (2023-2030)
11.5 South America Digital Identity Solutions Revenue (USD Million), by Type, and Applications (2023-2030)
11.5.1 South America Digital Identity Solutions Revenue (USD Million), by Country (2023-2030)
11.5.2 South America Digital Identity Solutions Revenue (USD Million), by Type (2023-2030)
11.5.3 South America Digital Identity Solutions Revenue (USD Million), by Applications (2023-2030)
11.6 Middle East and Africa Digital Identity Solutions Revenue (USD Million), by Type, and Applications (2023-2030)
11.6.1 Middle East and Africa Digital Identity Solutions Revenue (USD Million), by region (2023-2030)
11.6.2 Middle East and Africa Digital Identity Solutions Revenue (USD Million), by Type (2023-2030)
11.6.3 Middle East and Africa Digital Identity Solutions Revenue (USD Million), by Applications (2023-2030)
12 Methodology and Data Sources
12.1 Methodology/Research Approach
12.1.1 Research Programs/Design
12.1.2 Market Size Estimation
12.1.3 Market Breakdown and Data Triangulation
12.2 Data Sources
12.2.1 Secondary Sources
12.2.2 Primary Sources
12.3 Disclaimer
List of Tables
Table 1 Market Segmentation Analysis
Table 2 Global Digital Identity Solutions Market Companies with Areas Served
Table 3 Products Offerings Global Digital Identity Solutions Market
Table 4 Low Growth Scenario Forecasts
Table 5 Reference Case Growth Scenario
Table 6 High Growth Case Scenario
Table 7 Global Digital Identity Solutions Revenue (USD Million) And CAGR (%) By Type (2018-2030)
Table 8 Global Digital Identity Solutions Revenue (USD Million) And CAGR (%) By Applications (2018-2030)
Table 9 Global Digital Identity Solutions Revenue (USD Million) And CAGR (%) By Regions (2018-2030)
Table 10 Global Digital Identity Solutions Revenue (USD Million) By Type (2018-2022)
Table 11 Global Digital Identity Solutions Revenue Market Share (%) By Type (2018-2022)
Table 12 Global Digital Identity Solutions Revenue (USD Million) By Applications (2018-2022)
Table 13 Global Digital Identity Solutions Revenue Market Share (%) By Applications (2018-2022)
Table 14 Global Digital Identity Solutions Market Revenue (USD Million) By Regions (2018-2022)
Table 15 Global Digital Identity Solutions Market Share (%) By Regions (2018-2022)
Table 16 North America Digital Identity Solutions Revenue (USD Million) By Country (2018-2022)
Table 17 North America Digital Identity Solutions Revenue (USD Million) By Type (2018-2022)
Table 18 North America Digital Identity Solutions Revenue (USD Million) By Applications (2018-2022)
Table 19 Europe Digital Identity Solutions Revenue (USD Million) By Country (2018-2022)
Table 20 Europe Digital Identity Solutions Revenue (USD Million) By Type (2018-2022)
Table 21 Europe Digital Identity Solutions Revenue (USD Million) By Applications (2018-2022)
Table 22 Asia Pacific Digital Identity Solutions Revenue (USD Million) By Country (2018-2022)
Table 23 Asia Pacific Digital Identity Solutions Revenue (USD Million) By Type (2018-2022)
Table 24 Asia Pacific Digital Identity Solutions Revenue (USD Million) By Applications (2018-2022)
Table 25 South America Digital Identity Solutions Revenue (USD Million) By Country (2018-2022)
Table 26 South America Digital Identity Solutions Revenue (USD Million) By Type (2018-2022)
Table 27 South America Digital Identity Solutions Revenue (USD Million) By Applications (2018-2022)
Table 28 Middle East and Africa Digital Identity Solutions Revenue (USD Million) By Region (2018-2022)
Table 29 Middle East and Africa Digital Identity Solutions Revenue (USD Million) By Type (2018-2022)
Table 30 Middle East and Africa Digital Identity Solutions Revenue (USD Million) By Applications (2018-2022)
Table 31 Financial Analysis
Table 32 Global Digital Identity Solutions Revenue (USD Million) By Type (2023-2030)
Table 33 Global Digital Identity Solutions Revenue Market Share (%) By Type (2023-2030)
Table 34 Global Digital Identity Solutions Revenue (USD Million) By Applications (2023-2030)
Table 35 Global Digital Identity Solutions Revenue Market Share (%) By Applications (2023-2030)
Table 36 Global Digital Identity Solutions Market Revenue (USD Million), And Revenue (USD Million) By Regions (2023-2030)
Table 37 North America Digital Identity Solutions Revenue (USD)By Country (2023-2030)
Table 38 North America Digital Identity Solutions Revenue (USD Million) By Type (2023-2030)
Table 39 North America Digital Identity Solutions Revenue (USD Million) By Applications (2023-2030)
Table 40 Europe Digital Identity Solutions Revenue (USD Million) By Country (2023-2030)
Table 41 Europe Digital Identity Solutions Revenue (USD Million) By Type (2023-2030)
Table 42 Europe Digital Identity Solutions Revenue (USD Million) By Applications (2023-2030)
Table 43 Asia Pacific Digital Identity Solutions Revenue (USD Million) By Country (2023-2030)
Table 44 Asia Pacific Digital Identity Solutions Revenue (USD Million) By Type (2023-2030)
Table 45 Asia Pacific Digital Identity Solutions Revenue (USD Million) By Applications (2023-2030)
Table 46 South America Digital Identity Solutions Revenue (USD Million) By Country (2023-2030)
Table 47 South America Digital Identity Solutions Revenue (USD Million) By Type (2023-2030)
Table 48 South America Digital Identity Solutions Revenue (USD Million) By Applications (2023-2030)
Table 49 Middle East and Africa Digital Identity Solutions Revenue (USD Million) By Region (2023-2030)
Table 50 Middle East and Africa Digital Identity Solutions Revenue (USD Million) By Region (2023-2030)
Table 51 Middle East and Africa Digital Identity Solutions Revenue (USD Million) By Type (2023-2030)
Table 52 Middle East and Africa Digital Identity Solutions Revenue (USD Million) By Applications (2023-2030)
Table 53 Research Programs/Design for This Report
Table 54 Key Data Information from Secondary Sources
Table 55 Key Data Information from Primary Sources
List of Figures
Figure 1 Market Scope
Figure 2 Porter’s Five Forces
Figure 3 Global Digital Identity Solutions Revenue (USD Million) By Type (2018-2022)
Figure 4 Global Digital Identity Solutions Revenue Market Share (%) By Type (2022)
Figure 5 Global Digital Identity Solutions Revenue (USD Million) By Applications (2018-2022)
Figure 6 Global Digital Identity Solutions Revenue Market Share (%) By Applications (2022)
Figure 7 Global Digital Identity Solutions Market Revenue (USD Million) By Regions (2018-2022)
Figure 8 Global Digital Identity Solutions Market Share (%) By Regions (2022)
Figure 9 North America Digital Identity Solutions Revenue (USD Million) By Country (2018-2022)
Figure 10 North America Digital Identity Solutions Revenue (USD Million) By Type (2018-2022)
Figure 11 North America Digital Identity Solutions Revenue (USD Million) By Applications (2018-2022)
Figure 12 Europe Digital Identity Solutions Revenue (USD Million) By Country (2018-2022)
Figure 13 Europe Digital Identity Solutions Revenue (USD Million) By Type (2018-2022)
Figure 14 Europe Digital Identity Solutions Revenue (USD Million) By Applications (2018-2022)
Figure 15 Asia Pacific Digital Identity Solutions Revenue (USD Million) By Country (2018-2022)
Figure 16 Asia Pacific Digital Identity Solutions Revenue (USD Million) By Type (2018-2022)
Figure 17 Asia Pacific Digital Identity Solutions Revenue (USD Million) By Applications (2018-2022)
Figure 18 South America Digital Identity Solutions Revenue (USD Million) By Country (2018-2022)
Figure 19 South America Digital Identity Solutions Revenue (USD Million) By Type (2018-2022)
Figure 20 South America Digital Identity Solutions Revenue (USD Million) By Applications (2018-2022)
Figure 21 Middle East and Africa Digital Identity Solutions Revenue (USD Million) By Region (2018-2022)
Figure 22 Middle East and Africa Digital Identity Solutions Revenue (USD Million) By Type (2018-2022)
Figure 23 Middle East and Africa Digital Identity Solutions Revenue (USD Million) By Applications (2018-2022)
Figure 24 Global Digital Identity Solutions Revenue (USD Million) By Type (2023-2030)
Figure 25 Global Digital Identity Solutions Revenue Market Share (%) By Type (2030)
Figure 26 Global Digital Identity Solutions Revenue (USD Million) By Applications (2023-2030)
Figure 27 Global Digital Identity Solutions Revenue Market Share (%) By Applications (2030)
Figure 28 Global Digital Identity Solutions Market Revenue (USD Million) By Regions (2023-2030)
Figure 29 North America Digital Identity Solutions Revenue (USD Million) By Country (2023-2030)
Figure 30 North America Digital Identity Solutions Revenue (USD Million) By Type (2023-2030)
Figure 31 North America Digital Identity Solutions Revenue (USD Million) By Applications (2023-2030)
Figure 32 Europe Digital Identity Solutions Revenue (USD Million) By Country (2023-2030)
Figure 33 Europe Digital Identity Solutions Revenue (USD Million) By Type (2023-2030)
Figure 34 Europe Digital Identity Solutions Revenue (USD Million) By Applications (2023-2030)
Figure 35 Asia Pacific Digital Identity Solutions Revenue (USD Million) By Country (2023-2030)
Figure 36 Asia Pacific Digital Identity Solutions Revenue (USD Million) By Type (2023-2030)
Figure 37 Asia Pacific Digital Identity Solutions Revenue (USD Million) By Applications (2023-2030)
Figure 38 South America Digital Identity Solutions Revenue (USD Million) By Country (2023-2030)
Figure 39 South America Digital Identity Solutions Revenue (USD Million) By Type (2023-2030)
Figure 40 South America Digital Identity Solutions Revenue (USD Million) By Applications (2023-2030)
Figure 41 Middle East and Africa Digital Identity Solutions Revenue (USD Million) By Region (2023-2030)
Figure 42 Middle East and Africa Digital Identity Solutions Revenue (USD Million) By Region (2023-2030)
Figure 43 Middle East and Africa Digital Identity Solutions Revenue (USD Million) By Type (2023-2030)
Figure 44 Middle East and Africa Digital Identity Solutions Revenue (USD Million) By Applications (2023-2030)
Figure 45 Bottom-Up and Top-Down Approaches for This Report
Figure 46 Data Triangulation
