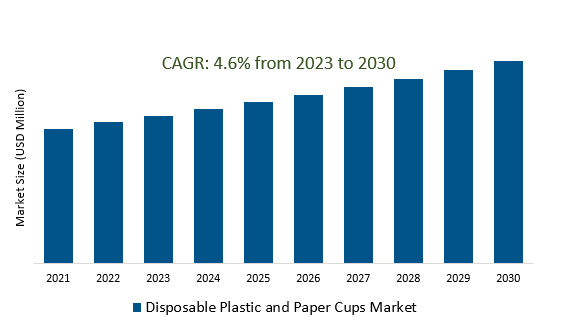
The Disposable Plastic and Paper Cups Market Size is estimated to register 4.6% growth over the forecast period from 2023 to 2030.
Disposable Plastic and Paper Cups Market Overview
The growing global concern regarding environmental pollution has led to a significant trend toward sustainability in the disposable cups market. Consumers and businesses are increasingly demanding eco-friendly alternatives to traditional plastic cups which is increasing the production and use of biodegradable, compostable, or recyclable paper cups as a more environmentally conscious choice. Customized or branded cups featuring logos, designs, or promotional messages are gaining popularity in cafes, events, and marketing activations, serving as an effective means of brand promotion. The expansion of the foodservice industry, including the growth of takeaway, delivery services, and quick-service restaurants, drives the demand for disposable cups. The increasing awareness of environmental issues, especially regarding plastic pollution and its impact on ecosystems is demanding more sustainable cups.
Disposable Plastic and Paper Cups Market Dynamics
Market Trends- Growing impact of Coffee shops and fast Fast-Food Chains on Disposable Plastic and Paper Cups Market.
The expansion of coffee shops and fast-food chains, which rely heavily on disposable cups, is a significant driver of market growth. The use of branded cups featuring logos, designs, or promotional messages as a means of marketing, enhancing brand visibility, and creating a distinct identity is fueling the demand.The substantial increase in the consumption of takeaway beverages, prompting a higher usage of disposable cups designed for portability and ease of use is supporting the market growth.
Further, coffee shops and fast-food chains are increasingly offering single-serve beverages to cater to the busy lifestyles of their customers, and disposable cups are the ideal packaging solution for these individual servings.
Market Driver- Demand for Convenience and Hygiene in Disposable Plastic and Paper Cups market
Practical and hassle-free solutions contribute to the widespread adoption of disposable cups in coffee shops, fast-food chains, and other foodservice establishments.
Further, offering cups made from materials that are safe for food contact, ensuring proper packaging, and communicating about the hygienic properties of their products are strategies employed by companies supporting the demand.
Manufacturers of disposable cups are continuing to focus on innovation and sustainability to meet the evolving needs of consumers and address growing environmental concerns while maintaining the convenience and hygiene aspects that drives the market growth.
Market Opportunity- introduction of Brand Promotion and Consumer Engagement is raising the demand.
Brands are offering limited-edition designs, seasonal themes, or customizable options that resonate with specific consumer preferences are fueling the demand.
Companies are offering cups with heat-sensitive ink, AR features, QR codes, or hidden messages to create an interactive experience for consumers, driving engagement, and enhancing brand recall which supports the revenue.
Consumer engagement with branded cups driving social sharing, generating user-generated content that amplifies brand reach and fosters a sense of community around the brand is rapidly contributing to the market growth.
Market Share Analysis - The mid-range capacity segment of 250 to 750 ml Market is registering as the fastest growth.
The Disposable Plastic and Paper Cups Market is analyzed across Less Than 250 ml, 250 to 750 ml & Above 750 ml. The mid-range capacity segment of 250 to 750 ml is poised to register the fastest growth. Cups falling within this capacity range cater to a diverse array of beverages, including standard servings of coffee, soft drinks, juices, and other popular drinks. This segment's growth was driven by the increased demand for convenient, single-use cups for medium-sized servings across quick-service restaurants, cafes, convenience stores, and takeaway services. Consumers often prefer these cup sizes when purchasing beverages for immediate consumption or to carry with them while traveling or commuting. Its adaptability, convenience, and branding opportunities position it as a key segment driving growth and innovation within the disposable cups market, serving various industries and consumer needs.
Market Share Analysis- Commercial use held a significant market share in 2023.
The Disposable Plastic and Paper Cups Market is analyzed across various Organizations including Commercial Use, Institutional Use & Household Use. Of these, - Commercial use held a significant market share in 2023. Commercial use of disposable cups encompasses various industries such as foodservice, hospitality, events, and retail. These cups are prevalent in cafes, restaurants, fast-food chains, cinemas, and catering services. Customization for branding purposes and the need for standardized, easily disposable options are crucial factors driving the significance of cups in this segment. These cups provide a convenient solution for consumers seeking immediate access to beverages while shopping or traveling. Businesses are exploring eco-friendly alternatives, recyclable materials, and strategies to reduce the environmental impact of disposable cups.
Disposable Plastic and Paper Cups Market Segmentation
By Capacity
- Less Than 250 ml
- 250 to 750 ml
- Above 750 ml
By Sales Channel
- Direct Sales
- Retail
- Distributors
- Online
By End-User
- Commercial Use
- Institutional Use
- Household Use
By Application
- Food and Beverages Industry
- Others
By Region
- North America (United States, Canada, Mexico)
- Europe (Germany, France, United Kingdom, Spain, Italy, Others)
- Asia Pacific (China, India, Japan, South Korea, Australia, Others)
- Latin America (Brazil, Argentina, Others)
- Middle East and Africa (Saudi Arabia, UAE, Kuwait, Other Middle East, South Africa, Nigeria, Other Africa)
Disposable Plastic and Paper Cups Market Companies
- Solo Cup Company (United States)
- International Paper Company (United States)
- Dart Container Corporation (United States)
- Huhtamaki Oyj (Finland)
- Georgia-Pacific LLC (United States)
- Genpak LLC (United States)
- New WinCup Holdings Inc (United States)
- Berry Global Group Inc (United States)
- Eco-Products Inc (United States)
- Duni AB (Sweden)
- Go-Pak UK Ltd (United Kingdom)
- Lollicup USA Inc (United States)
- Fabri-Kal Corporation (United States)
- ConverPack Inc. (United States)
- Detpak (Australia)
*List not exhaustive
Disposable Plastic and Paper Cups Market Outlook 2023
1 Market Overview
1.1 Introduction to the Disposable Plastic and Paper Cups Market
1.2 Scope of the Study
1.3 Research Objective
1.3.1 Key Market Scope and Segments
1.3.2 Players Covered
1.3.3 Years Considered
2 Executive Summary
2.1 2023 Disposable Plastic and Paper Cups Industry- Market Statistics
3 Market Dynamics
3.1 Market Drivers
3.2 Market Challenges
3.3 Market Opportunities
3.4 Market Trends
4 Market Factor Analysis
4.1 Porter’s Five Forces
4.2 Market Entropy
4.2.1 Global Disposable Plastic and Paper Cups Market Companies with Area Served
4.2.2 Products Offerings Global Disposable Plastic and Paper Cups Market
5 COVID-19 Impact Analysis and Outlook Scenarios
5.1.1 Covid-19 Impact Analysis
5.1.2 post-COVID-19 Scenario- Low Growth Case
5.1.3 post-COVID-19 Scenario- Reference Growth Case
5.1.4 post-COVID-19 Scenario- Low Growth Case
6 Global Disposable Plastic and Paper Cups Market Trends
6.1 Global Disposable Plastic and Paper Cups Revenue (USD Million) and CAGR (%) by Type (2018-2030)
6.2 Global Disposable Plastic and Paper Cups Revenue (USD Million) and CAGR (%) by Applications (2018-2030)
6.3 Global Disposable Plastic and Paper Cups Revenue (USD Million) and CAGR (%) by regions (2018-2030)
7 Global Disposable Plastic and Paper Cups Market Revenue (USD Million) by Type, and Applications (2018-2022)
7.1 Global Disposable Plastic and Paper Cups Revenue (USD Million) by Type (2018-2022)
7.1.1 Global Disposable Plastic and Paper Cups Revenue (USD Million), Market Share (%) by Type (2018-2022)
7.2 Global Disposable Plastic and Paper Cups Revenue (USD Million) by Applications (2018-2022)
7.2.1 Global Disposable Plastic and Paper Cups Revenue (USD Million), Market Share (%) by Applications (2018-2022)
8 Global Disposable Plastic and Paper Cups Development Regional Status and Outlook
8.1 Global Disposable Plastic and Paper Cups Revenue (USD Million) By Regions (2018-2022)
8.2 North America Disposable Plastic and Paper Cups Revenue (USD Million) by Type, and Application (2018-2022)
8.2.1 North America Disposable Plastic and Paper Cups Revenue (USD Million) by Country (2018-2022)
8.2.2 North America Disposable Plastic and Paper Cups Revenue (USD Million) by Type (2018-2022)
8.2.3 North America Disposable Plastic and Paper Cups Revenue (USD Million) by Applications (2018-2022)
8.3 Europe Disposable Plastic and Paper Cups Revenue (USD Million), by Type, and Applications (USD Million) (2018-2022)
8.3.1 Europe Disposable Plastic and Paper Cups Revenue (USD Million), by Country (2018-2022)
8.3.2 Europe Disposable Plastic and Paper Cups Revenue (USD Million) by Type (2018-2022)
8.3.3 Europe Disposable Plastic and Paper Cups Revenue (USD Million) by Applications (2018-2022)
8.4 Asia Pacific Disposable Plastic and Paper Cups Revenue (USD Million), and Revenue (USD Million) by Type, and Applications (2018-2022)
8.4.1 Asia Pacific Disposable Plastic and Paper Cups Revenue (USD Million) by Country (2018-2022)
8.4.2 Asia Pacific Disposable Plastic and Paper Cups Revenue (USD Million) by Type (2018-2022)
8.4.3 Asia Pacific Disposable Plastic and Paper Cups Revenue (USD Million) by Applications (2018-2022)
8.5 South America Disposable Plastic and Paper Cups Revenue (USD Million), by Type, and Applications (2018-2022)
8.5.1 South America Disposable Plastic and Paper Cups Revenue (USD Million), by Country (2018-2022)
8.5.2 South America Disposable Plastic and Paper Cups Revenue (USD Million) by Type (2018-2022)
8.5.3 South America Disposable Plastic and Paper Cups Revenue (USD Million) by Applications (2018-2022)
8.6 Middle East and Africa Disposable Plastic and Paper Cups Revenue (USD Million), by Type, Technology, Application, Thickness (2018-2022)
8.6.1 Middle East and Africa Disposable Plastic and Paper Cups Revenue (USD Million) by Country (2018-2022)
8.6.2 Middle East and Africa Disposable Plastic and Paper Cups Revenue (USD Million) by Type (2018-2022)
8.6.3 Middle East and Africa Disposable Plastic and Paper Cups Revenue (USD Million) by Applications (2018-2022)
9 Company Profiles
10 Global Disposable Plastic and Paper Cups Market Revenue (USD Million), by Type, and Applications (2023-2030)
10.1 Global Disposable Plastic and Paper Cups Revenue (USD Million) and Market Share (%) by Type (2023-2030)
10.1.1 Global Disposable Plastic and Paper Cups Revenue (USD Million), and Market Share (%) by Type (2023-2030)
10.2 Global Disposable Plastic and Paper Cups Revenue (USD Million) and Market Share (%) by Applications (2023-2030)
10.2.1 Global Disposable Plastic and Paper Cups Revenue (USD Million), and Market Share (%) by Applications (2023-2030)
11 Global Disposable Plastic and Paper Cups Development Regional Status and Outlook Forecast
11.1 Global Disposable Plastic and Paper Cups Revenue (USD Million) By Regions (2023-2030)
11.2 North America Disposable Plastic and Paper Cups Revenue (USD Million) by Type, and Applications (2023-2030)
11.2.1 North America Disposable Plastic and Paper Cups Revenue (USD) Million by Country (2023-2030)
11.2.2 North America Disposable Plastic and Paper Cups Revenue (USD Million), by Type (2023-2030)
11.2.3 North America Disposable Plastic and Paper Cups Revenue (USD Million), Market Share (%) by Applications (2023-2030)
11.3 Europe Disposable Plastic and Paper Cups Revenue (USD Million), by Type, and Applications (2023-2030)
11.3.1 Europe Disposable Plastic and Paper Cups Revenue (USD Million), by Country (2023-2030)
11.3.2 Europe Disposable Plastic and Paper Cups Revenue (USD Million), by Type (2023-2030)
11.3.3 Europe Disposable Plastic and Paper Cups Revenue (USD Million), by Applications (2023-2030)
11.4 Asia Pacific Disposable Plastic and Paper Cups Revenue (USD Million) by Type, and Applications (2023-2030)
11.4.1 Asia Pacific Disposable Plastic and Paper Cups Revenue (USD Million), by Country (2023-2030)
11.4.2 Asia Pacific Disposable Plastic and Paper Cups Revenue (USD Million), by Type (2023-2030)
11.4.3 Asia Pacific Disposable Plastic and Paper Cups Revenue (USD Million), by Applications (2023-2030)
11.5 South America Disposable Plastic and Paper Cups Revenue (USD Million), by Type, and Applications (2023-2030)
11.5.1 South America Disposable Plastic and Paper Cups Revenue (USD Million), by Country (2023-2030)
11.5.2 South America Disposable Plastic and Paper Cups Revenue (USD Million), by Type (2023-2030)
11.5.3 South America Disposable Plastic and Paper Cups Revenue (USD Million), by Applications (2023-2030)
11.6 Middle East and Africa Disposable Plastic and Paper Cups Revenue (USD Million), by Type, and Applications (2023-2030)
11.6.1 Middle East and Africa Disposable Plastic and Paper Cups Revenue (USD Million), by region (2023-2030)
11.6.2 Middle East and Africa Disposable Plastic and Paper Cups Revenue (USD Million), by Type (2023-2030)
11.6.3 Middle East and Africa Disposable Plastic and Paper Cups Revenue (USD Million), by Applications (2023-2030)
12 Methodology and Data Sources
12.1 Methodology/Research Approach
12.1.1 Research Programs/Design
12.1.2 Market Size Estimation
12.1.3 Market Breakdown and Data Triangulation
12.2 Data Sources
12.2.1 Secondary Sources
12.2.2 Primary Sources
12.3 Disclaimer
List of Tables
Table 1 Market Segmentation Analysis
Table 2 Global Disposable Plastic and Paper Cups Market Companies with Areas Served
Table 3 Products Offerings Global Disposable Plastic and Paper Cups Market
Table 4 Low Growth Scenario Forecasts
Table 5 Reference Case Growth Scenario
Table 6 High Growth Case Scenario
Table 7 Global Disposable Plastic and Paper Cups Revenue (USD Million) And CAGR (%) By Type (2018-2030)
Table 8 Global Disposable Plastic and Paper Cups Revenue (USD Million) And CAGR (%) By Applications (2018-2030)
Table 9 Global Disposable Plastic and Paper Cups Revenue (USD Million) And CAGR (%) By Regions (2018-2030)
Table 10 Global Disposable Plastic and Paper Cups Revenue (USD Million) By Type (2018-2022)
Table 11 Global Disposable Plastic and Paper Cups Revenue Market Share (%) By Type (2018-2022)
Table 12 Global Disposable Plastic and Paper Cups Revenue (USD Million) By Applications (2018-2022)
Table 13 Global Disposable Plastic and Paper Cups Revenue Market Share (%) By Applications (2018-2022)
Table 14 Global Disposable Plastic and Paper Cups Market Revenue (USD Million) By Regions (2018-2022)
Table 15 Global Disposable Plastic and Paper Cups Market Share (%) By Regions (2018-2022)
Table 16 North America Disposable Plastic and Paper Cups Revenue (USD Million) By Country (2018-2022)
Table 17 North America Disposable Plastic and Paper Cups Revenue (USD Million) By Type (2018-2022)
Table 18 North America Disposable Plastic and Paper Cups Revenue (USD Million) By Applications (2018-2022)
Table 19 Europe Disposable Plastic and Paper Cups Revenue (USD Million) By Country (2018-2022)
Table 20 Europe Disposable Plastic and Paper Cups Revenue (USD Million) By Type (2018-2022)
Table 21 Europe Disposable Plastic and Paper Cups Revenue (USD Million) By Applications (2018-2022)
Table 22 Asia Pacific Disposable Plastic and Paper Cups Revenue (USD Million) By Country (2018-2022)
Table 23 Asia Pacific Disposable Plastic and Paper Cups Revenue (USD Million) By Type (2018-2022)
Table 24 Asia Pacific Disposable Plastic and Paper Cups Revenue (USD Million) By Applications (2018-2022)
Table 25 South America Disposable Plastic and Paper Cups Revenue (USD Million) By Country (2018-2022)
Table 26 South America Disposable Plastic and Paper Cups Revenue (USD Million) By Type (2018-2022)
Table 27 South America Disposable Plastic and Paper Cups Revenue (USD Million) By Applications (2018-2022)
Table 28 Middle East and Africa Disposable Plastic and Paper Cups Revenue (USD Million) By Region (2018-2022)
Table 29 Middle East and Africa Disposable Plastic and Paper Cups Revenue (USD Million) By Type (2018-2022)
Table 30 Middle East and Africa Disposable Plastic and Paper Cups Revenue (USD Million) By Applications (2018-2022)
Table 31 Financial Analysis
Table 32 Global Disposable Plastic and Paper Cups Revenue (USD Million) By Type (2023-2030)
Table 33 Global Disposable Plastic and Paper Cups Revenue Market Share (%) By Type (2023-2030)
Table 34 Global Disposable Plastic and Paper Cups Revenue (USD Million) By Applications (2023-2030)
Table 35 Global Disposable Plastic and Paper Cups Revenue Market Share (%) By Applications (2023-2030)
Table 36 Global Disposable Plastic and Paper Cups Market Revenue (USD Million), And Revenue (USD Million) By Regions (2023-2030)
Table 37 North America Disposable Plastic and Paper Cups Revenue (USD)By Country (2023-2030)
Table 38 North America Disposable Plastic and Paper Cups Revenue (USD Million) By Type (2023-2030)
Table 39 North America Disposable Plastic and Paper Cups Revenue (USD Million) By Applications (2023-2030)
Table 40 Europe Disposable Plastic and Paper Cups Revenue (USD Million) By Country (2023-2030)
Table 41 Europe Disposable Plastic and Paper Cups Revenue (USD Million) By Type (2023-2030)
Table 42 Europe Disposable Plastic and Paper Cups Revenue (USD Million) By Applications (2023-2030)
Table 43 Asia Pacific Disposable Plastic and Paper Cups Revenue (USD Million) By Country (2023-2030)
Table 44 Asia Pacific Disposable Plastic and Paper Cups Revenue (USD Million) By Type (2023-2030)
Table 45 Asia Pacific Disposable Plastic and Paper Cups Revenue (USD Million) By Applications (2023-2030)
Table 46 South America Disposable Plastic and Paper Cups Revenue (USD Million) By Country (2023-2030)
Table 47 South America Disposable Plastic and Paper Cups Revenue (USD Million) By Type (2023-2030)
Table 48 South America Disposable Plastic and Paper Cups Revenue (USD Million) By Applications (2023-2030)
Table 49 Middle East and Africa Disposable Plastic and Paper Cups Revenue (USD Million) By Region (2023-2030)
Table 50 Middle East and Africa Disposable Plastic and Paper Cups Revenue (USD Million) By Region (2023-2030)
Table 51 Middle East and Africa Disposable Plastic and Paper Cups Revenue (USD Million) By Type (2023-2030)
Table 52 Middle East and Africa Disposable Plastic and Paper Cups Revenue (USD Million) By Applications (2023-2030)
Table 53 Research Programs/Design for This Report
Table 54 Key Data Information from Secondary Sources
Table 55 Key Data Information from Primary Sources
List of Figures
Figure 1 Market Scope
Figure 2 Porter’s Five Forces
Figure 3 Global Disposable Plastic and Paper Cups Revenue (USD Million) By Type (2018-2022)
Figure 4 Global Disposable Plastic and Paper Cups Revenue Market Share (%) By Type (2022)
Figure 5 Global Disposable Plastic and Paper Cups Revenue (USD Million) By Applications (2018-2022)
Figure 6 Global Disposable Plastic and Paper Cups Revenue Market Share (%) By Applications (2022)
Figure 7 Global Disposable Plastic and Paper Cups Market Revenue (USD Million) By Regions (2018-2022)
Figure 8 Global Disposable Plastic and Paper Cups Market Share (%) By Regions (2022)
Figure 9 North America Disposable Plastic and Paper Cups Revenue (USD Million) By Country (2018-2022)
Figure 10 North America Disposable Plastic and Paper Cups Revenue (USD Million) By Type (2018-2022)
Figure 11 North America Disposable Plastic and Paper Cups Revenue (USD Million) By Applications (2018-2022)
Figure 12 Europe Disposable Plastic and Paper Cups Revenue (USD Million) By Country (2018-2022)
Figure 13 Europe Disposable Plastic and Paper Cups Revenue (USD Million) By Type (2018-2022)
Figure 14 Europe Disposable Plastic and Paper Cups Revenue (USD Million) By Applications (2018-2022)
Figure 15 Asia Pacific Disposable Plastic and Paper Cups Revenue (USD Million) By Country (2018-2022)
Figure 16 Asia Pacific Disposable Plastic and Paper Cups Revenue (USD Million) By Type (2018-2022)
Figure 17 Asia Pacific Disposable Plastic and Paper Cups Revenue (USD Million) By Applications (2018-2022)
Figure 18 South America Disposable Plastic and Paper Cups Revenue (USD Million) By Country (2018-2022)
Figure 19 South America Disposable Plastic and Paper Cups Revenue (USD Million) By Type (2018-2022)
Figure 20 South America Disposable Plastic and Paper Cups Revenue (USD Million) By Applications (2018-2022)
Figure 21 Middle East and Africa Disposable Plastic and Paper Cups Revenue (USD Million) By Region (2018-2022)
Figure 22 Middle East and Africa Disposable Plastic and Paper Cups Revenue (USD Million) By Type (2018-2022)
Figure 23 Middle East and Africa Disposable Plastic and Paper Cups Revenue (USD Million) By Applications (2018-2022)
Figure 24 Global Disposable Plastic and Paper Cups Revenue (USD Million) By Type (2023-2030)
Figure 25 Global Disposable Plastic and Paper Cups Revenue Market Share (%) By Type (2030)
Figure 26 Global Disposable Plastic and Paper Cups Revenue (USD Million) By Applications (2023-2030)
Figure 27 Global Disposable Plastic and Paper Cups Revenue Market Share (%) By Applications (2030)
Figure 28 Global Disposable Plastic and Paper Cups Market Revenue (USD Million) By Regions (2023-2030)
Figure 29 North America Disposable Plastic and Paper Cups Revenue (USD Million) By Country (2023-2030)
Figure 30 North America Disposable Plastic and Paper Cups Revenue (USD Million) By Type (2023-2030)
Figure 31 North America Disposable Plastic and Paper Cups Revenue (USD Million) By Applications (2023-2030)
Figure 32 Europe Disposable Plastic and Paper Cups Revenue (USD Million) By Country (2023-2030)
Figure 33 Europe Disposable Plastic and Paper Cups Revenue (USD Million) By Type (2023-2030)
Figure 34 Europe Disposable Plastic and Paper Cups Revenue (USD Million) By Applications (2023-2030)
Figure 35 Asia Pacific Disposable Plastic and Paper Cups Revenue (USD Million) By Country (2023-2030)
Figure 36 Asia Pacific Disposable Plastic and Paper Cups Revenue (USD Million) By Type (2023-2030)
Figure 37 Asia Pacific Disposable Plastic and Paper Cups Revenue (USD Million) By Applications (2023-2030)
Figure 38 South America Disposable Plastic and Paper Cups Revenue (USD Million) By Country (2023-2030)
Figure 39 South America Disposable Plastic and Paper Cups Revenue (USD Million) By Type (2023-2030)
Figure 40 South America Disposable Plastic and Paper Cups Revenue (USD Million) By Applications (2023-2030)
Figure 41 Middle East and Africa Disposable Plastic and Paper Cups Revenue (USD Million) By Region (2023-2030)
Figure 42 Middle East and Africa Disposable Plastic and Paper Cups Revenue (USD Million) By Region (2023-2030)
Figure 43 Middle East and Africa Disposable Plastic and Paper Cups Revenue (USD Million) By Type (2023-2030)
Figure 44 Middle East and Africa Disposable Plastic and Paper Cups Revenue (USD Million) By Applications (2023-2030)
Figure 45 Bottom-Up and Top-Down Approaches for This Report
Figure 46 Data Triangulation
