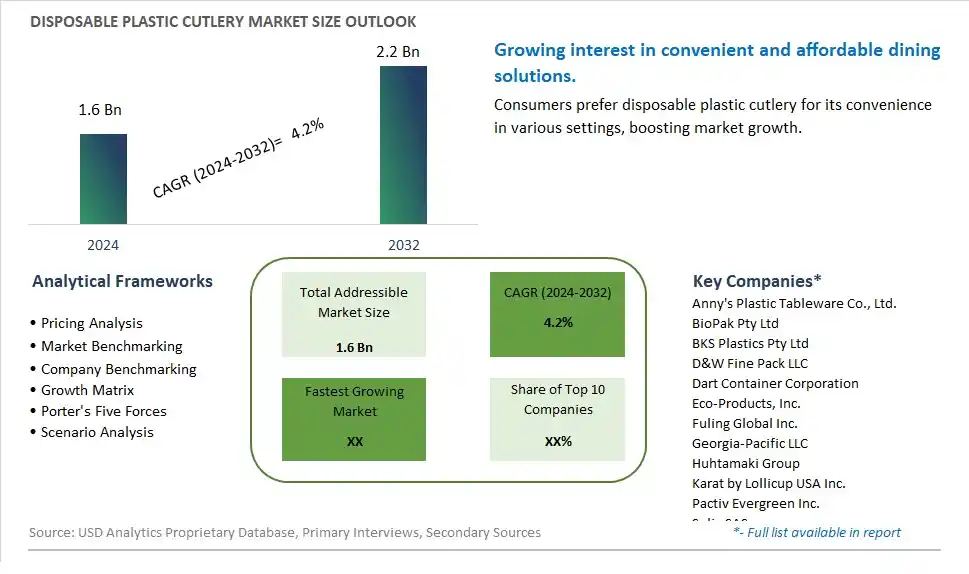
Global Disposable Plastic Cutlery Market Size is valued at $1.6 Billion in 2024 and is forecast to register a growth rate (CAGR) of 4.2% to reach $2.2 Billion by 2032.
The global Disposable Plastic Cutlery Market Comprehensive Study analyzes and forecasts the market size across 6 regions and 24 countries for diverse segments -By Type (Plastic Forks, Plastic Spoon, Plastic Knife), By Application (Food Service/Catering, Food Processing, Household)
An Introduction to Disposable Plastic Cutlery Market
In 2024, the Disposable Plastic Cutlery market is experiencing notable growth, fueled by the rising demand for convenient and single-use utensils in the foodservice and hospitality industries. These products are widely used in quick-service restaurants, events, and catering services. The market is driven by the need for cost-effective, lightweight, and durable cutlery solutions. However, increasing environmental concerns and regulatory pressures are prompting manufacturers to innovate and offer biodegradable and compostable alternatives, ensuring sustainability while meeting consumer demand for convenience.
Disposable Plastic Cutlery Competitive Landscape
The market report analyses the leading companies in the industry including Anny's Plastic Tableware Co., Ltd., BioPak Pty Ltd, BKS Plastics Pty Ltd, D&W Fine Pack LLC, Dart Container Corporation, Eco-Products, Inc., Fuling Global Inc., Georgia-Pacific LLC, Huhtamaki Group, Karat by Lollicup USA Inc., Pactiv Evergreen Inc., Solia SAS, Swantex Europe Ltd., Tair Chu Enterprise Co., Ltd., TrueChoicePack Corp., and Others.
Disposable Plastic Cutlery Market Dynamics
Disposable Plastic Cutlery Market Trend: Shift Towards Sustainable Alternatives in Disposable Cutlery
A prominent trend in the disposable plastic cutlery market is the shift towards sustainable alternatives. With increasing environmental awareness and regulations aimed at reducing plastic waste, there is a growing demand for eco-friendly disposable cutlery made from biodegradable or compostable materials. Consumers and businesses are seeking alternatives to traditional plastic cutlery that can degrade naturally and have a lower impact on the environment. This trend is driven by sustainability initiatives, consumer preferences for eco-conscious products, and the push for greener practices across industries.
Disposable Plastic Cutlery Market Driver: Environmental Concerns and Plastic Waste Reduction Efforts
A key driver influencing the disposable plastic cutlery market is environmental concerns and efforts to reduce plastic waste. The negative impact of plastic pollution on oceans, wildlife, and ecosystems has led to increased awareness and calls for action to minimize single-use plastics. Governments, organizations, and businesses are implementing regulations, bans, and initiatives to reduce the use of disposable plastic items, including cutlery. This driver is fueled by public awareness campaigns, sustainability goals, and the need to transition towards more sustainable materials and practices in the foodservice, hospitality, and catering sectors.
Disposable Plastic Cutlery Market Opportunity: Development and Adoption of Biodegradable Cutlery Solutions
An opportunity in the disposable plastic cutlery market lies in the development and adoption of biodegradable cutlery solutions. Manufacturers can capitalize on the demand for eco-friendly alternatives by innovating with materials such as PLA (polylactic acid), CPLA (crystalized PLA), starch-based plastics, bamboo, sugarcane fiber, or compostable resins to create biodegradable cutlery sets. There is an opportunity to offer a range of disposable cutlery options that are not only environmentally friendly but also meet functional requirements for strength, heat resistance, and usability. Collaborating with foodservice providers, event organizers, and retailers to promote and adopt these biodegradable cutlery solutions can lead to market growth, customer satisfaction, and positive environmental impact.
Disposable Plastic Cutlery Market Share Analysis: Plastic Forks segment generated the highest revenue share in the industry
The Plastic Forks segment emerges as the largest category in the Disposable Plastic Cutlery Market, showcasing rapid growth driven by its practicality, versatility, and widespread usage. Plastic forks are a staple in foodservice establishments, take-out services, catering events, and household settings, offering a convenient and hygienic solution for eating meals. They are commonly used for various types of food, including salads, pasta, meats, and desserts, making them a versatile choice for consumers. Plastic forks are preferred for their lightweight design, ease of use, and disposable nature, eliminating the need for cleaning and maintenance after use. Further, they are cost-effective compared to reusable alternatives, making them a preferred choice for businesses and consumers looking for affordable and convenient utensils. The Plastic Forks segment's dominance in the Disposable Plastic Cutlery Market reflects its widespread adoption and essential role in everyday dining experiences across different sectors and settings.
Disposable Plastic Cutlery Market Share Analysis: Food Service/Catering Application is the fastest growing segment over the forecast period to 2032
The Food Service/Catering Application segment emerges as the fastest-growing category in the Disposable Plastic Cutlery Market, showcasing substantial growth potential and increasing demand by 2032. This surge is primarily driven by the widespread usage of disposable plastic cutlery in foodservice establishments, catering events, and hospitality sectors. Plastic cutlery, including forks, spoons, and knives, plays a crucial role in the food service industry by providing a convenient and hygienic eating solution for customers dining in or ordering take-out and delivery services. The versatility of disposable plastic cutlery makes it suitable for a wide range of food types, from salads and entrees to desserts and snacks, catering to diverse culinary needs. Additionally, the food processing sector also contributes to the growth of this segment, utilizing disposable plastic cutlery for food preparation, packaging, and handling. Further, the convenience and cost-effectiveness of disposable plastic cutlery make it a preferred choice for household use, further driving market growth in the Food Service/Catering Application segment. As consumer lifestyles evolve, with an increasing emphasis on convenience and on-the-go dining experiences, the demand for disposable plastic cutlery in the food service and household sectors is expected to witness rapid expansion, positioning the Food Service/Catering Application segment as a key driver of growth in the Disposable Plastic Cutlery Market.
Disposable Plastic Cutlery Market Segmentation
By Type
Plastic Forks
Plastic Spoon
Plastic Knife
By Application
Food Service/Catering
Food Processing
Household
Countries Analyzed
North America (US, Canada, Mexico)
Europe (Germany, UK, France, Spain, Italy, Russia, Rest of Europe)
Asia Pacific (China, India, Japan, South Korea, Australia, South East Asia, Rest of Asia)
South America (Brazil, Argentina, Rest of South America)
Middle East and Africa (Saudi Arabia, UAE, Rest of Middle East, South Africa, Egypt, Rest of Africa)
Disposable Plastic Cutlery Companies Profiled in the Study
Anny's Plastic Tableware Co., Ltd.
BioPak Pty Ltd
BKS Plastics Pty Ltd
D&W Fine Pack LLC
Dart Container Corporation
Eco-Products, Inc.
Fuling Global Inc.
Georgia-Pacific LLC
Huhtamaki Group
Karat by Lollicup USA Inc.
Pactiv Evergreen Inc.
Solia SAS
Swantex Europe Ltd.
Tair Chu Enterprise Co., Ltd.
TrueChoicePack Corp.
*- List Not Exhaustive
Chapter 1. TABLE OF CONTENTS
Chapter 2. Introduction to Disposable Plastic Cutlery Market
2.1. Market Overview
2.2. Key Statistics and Report Highlights
2.3. Scope of the Comprehensive Study
2.3.1. Market Definition
2.3.2 Countries and Regions Covered
2.3.3 Research Objective
2.3.4 Units, Currency, and Conversions
2.3.5 Industry Value Chain
2.4. Key Market Segments
2.5. Key Companies
2.6. Study Period
Chapter 3. Strategic Analysis Review
3.1. Disposable Plastic Cutlery Pricing Analysis and Forecast
3.2. Porter’s Five Forces
3.3. Market Ecosystem
3.4. SWOT Analysis
3.5. Regulatory Scenario
3.3. Effects of Inflation, Russia-Ukraine War, moderating economic growth, and other macroeconomic factors
Chapter 4. Competitive Landscape
4.1. Market Share Analysis
4.1.1. Global Disposable Plastic Cutlery Market Share by Company, 2023
4.1.2. Product Offerings of Leading Disposable Plastic Cutlery Companies
4.2. Market Entropy
4.2.1. New Product Launches in the Industry
4.2.2. Mergers, Acquisitions, Joint ventures, and Partnerships
4.3. Key Strategies and Best Practices
Chapter 5. Global Market Projections: Best, Reference, and Low Case Scenarios
5.1. Growth Analysis- Case Scenario Definitions
5.2. Low Growth Case Scenario Forecasts
5.3. Reference Growth Case Scenario Forecasts
5.4. High Growth Case Scenario Forecasts
Chapter 6. Market Dynamics
6.1. Disposable Plastic Cutlery Market Drivers
6.2. Disposable Plastic Cutlery Market Challenges
6.6. Disposable Plastic Cutlery Market Opportunities
6.4. Disposable Plastic Cutlery Market Trends
Chapter 7. Global Disposable Plastic Cutlery Market Outlook Trends
7.1. Global Disposable Plastic Cutlery Revenue (USD Million) and CAGR (%) by Type (2021-2032)
7.2. Global Disposable Plastic Cutlery Revenue (USD Million) and CAGR (%) by Application (2021-2032)
7.3. Global Disposable Plastic Cutlery Revenue (USD Million) and CAGR (%) by Product (2021-2032)
By Type
Plastic Forks
Plastic Spoon
Plastic Knife
By Application
Food Service/Catering
Food Processing
Household
Chapter 8. Global Disposable Plastic Cutlery Regional Analysis and Outlook
8.1. Global Disposable Plastic Cutlery Revenue (USD Million) By Regions (2021- 2032)
8.2. North America Disposable Plastic Cutlery Revenue (USD Million) by Country (2021-2032)
8.2.1. United States Disposable Plastic Cutlery Regional Analysis and Outlook
8.2.2. Canada Disposable Plastic Cutlery Regional Analysis and Outlook
8.2.3. Mexico Disposable Plastic Cutlery Regional Analysis and Outlook
8.3. Europe Disposable Plastic Cutlery Revenue (USD Million), by Country (2021-2032)
8.3.1. Germany Disposable Plastic Cutlery Regional Analysis and Outlook
8.3.2. France Disposable Plastic Cutlery Regional Analysis and Outlook
8.3.3. United Kingdom Disposable Plastic Cutlery Regional Analysis and Outlook
8.3.4. Spain Disposable Plastic Cutlery Regional Analysis and Outlook
8.3.5. Italy Disposable Plastic Cutlery Regional Analysis and Outlook
8.3.6. Russia Disposable Plastic Cutlery Regional Analysis and Outlook
8.3.7. Rest of Europe Disposable Plastic Cutlery Regional Analysis and Outlook
8.4. Asia Pacific Disposable Plastic Cutlery Revenue (USD Million) by Country (2021-2032)
8.4.1. China Disposable Plastic Cutlery Regional Analysis and Outlook
8.4.2. Japan Disposable Plastic Cutlery Regional Analysis and Outlook
8.4.3. India Disposable Plastic Cutlery Regional Analysis and Outlook
8.4.4. South Korea Disposable Plastic Cutlery Regional Analysis and Outlook
8.4.5. Australia Disposable Plastic Cutlery Regional Analysis and Outlook
8.4.6. South East Asia Disposable Plastic Cutlery Regional Analysis and Outlook
8.4.7. Rest of Asia Pacific Disposable Plastic Cutlery Regional Analysis and Outlook
8.5. South America Disposable Plastic Cutlery Revenue (USD Million), by Country (2021-2032)
8.5.1. Brazil Disposable Plastic Cutlery Regional Analysis and Outlook
8.5.2. Argentina Disposable Plastic Cutlery Regional Analysis and Outlook
8.5.3. Rest of South America Disposable Plastic Cutlery Regional Analysis and Outlook
8.6. Middle East and Africa Disposable Plastic Cutlery Revenue (USD Million) by Country (2021-2032)
8.6.1. Middle East Disposable Plastic Cutlery Regional Analysis and Outlook
8.6.2. Africa Disposable Plastic Cutlery Regional Analysis and Outlook
Chapter 9. North America Disposable Plastic Cutlery Analysis and Outlook
9.1. North America Disposable Plastic Cutlery Revenue (USD Million) by Segments (2021-2032)
9.1.1. North America Disposable Plastic Cutlery Revenue (USD Million) by Type (2021-2032)
9.1.2. North America Disposable Plastic Cutlery Revenue (USD Million) by Application (2021-2032)
9.1.3. North America Disposable Plastic Cutlery Revenue (USD Million) by Product (2021-2032)
By Type
Plastic Forks
Plastic Spoon
Plastic Knife
By Application
Food Service/Catering
Food Processing
Household
Chapter 10. Europe Disposable Plastic Cutlery Analysis and Outlook
10.1. Europe Disposable Plastic Cutlery Revenue (USD Million), by Segments (USD Million) (2021-2032)
10.1.1. Europe Disposable Plastic Cutlery Revenue (USD Million) by Type (2021-2032)
10.1.2. Europe Disposable Plastic Cutlery Revenue (USD Million) by Application (2021-2032)
10.1.3. Europe Disposable Plastic Cutlery Revenue (USD Million) by Product (2021-2032)
By Type
Plastic Forks
Plastic Spoon
Plastic Knife
By Application
Food Service/Catering
Food Processing
Household
Chapter 11. Asia Pacific Disposable Plastic Cutlery Analysis and Outlook
11.1. Asia Pacific Disposable Plastic Cutlery Revenue (USD Million), and Revenue (USD Million) by Segments (2021-2032)
11.1.1. Asia Pacific Disposable Plastic Cutlery Revenue (USD Million) by Type (2021-2032)
11.1.2. Asia Pacific Disposable Plastic Cutlery Revenue (USD Million) by Application (2021-2032)
11.1.3. Asia Pacific Disposable Plastic Cutlery Revenue (USD Million) by Product (2021-2032)
By Type
Plastic Forks
Plastic Spoon
Plastic Knife
By Application
Food Service/Catering
Food Processing
Household
Chapter 12. South America Disposable Plastic Cutlery Analysis and Outlook
12.1. South America Disposable Plastic Cutlery Revenue (USD Million), by Segments (2021-2032)
12.1.1. South America Disposable Plastic Cutlery Revenue (USD Million) by Type (2021-2032)
12.1.2. South America Disposable Plastic Cutlery Revenue (USD Million) by Application (2021-2032)
12.1.3. South America Disposable Plastic Cutlery Revenue (USD Million) by Product (2021-2032)
By Type
Plastic Forks
Plastic Spoon
Plastic Knife
By Application
Food Service/Catering
Food Processing
Household
Chapter 13. Middle East and Africa Disposable Plastic Cutlery Analysis and Outlook
13.1. Middle East and Africa Disposable Plastic Cutlery Revenue (USD Million), by Segments (2021-2032)
13.1.1. Middle East and Africa Disposable Plastic Cutlery Revenue (USD Million) by Type (2021-2032)
13.1.2. Middle East and Africa Disposable Plastic Cutlery Revenue (USD Million) by Application (2021-2032)
13.1.3. Middle East and Africa Disposable Plastic Cutlery Revenue (USD Million) by Product (2021-2032)
By Type
Plastic Forks
Plastic Spoon
Plastic Knife
By Application
Food Service/Catering
Food Processing
Household
Chapter 14. Disposable Plastic Cutlery Company Profiles
14.1 Business Overview
14.2 Product Profiles
14.3 SWOT Profiles
14.5 Recent Developments
14.6 Financial Profile
List of Companies
Anny's Plastic Tableware Co., Ltd.
BioPak Pty Ltd
BKS Plastics Pty Ltd
D&W Fine Pack LLC
Dart Container Corporation
Eco-Products, Inc.
Fuling Global Inc.
Georgia-Pacific LLC
Huhtamaki Group
Karat by Lollicup USA Inc.
Pactiv Evergreen Inc.
Solia SAS
Swantex Europe Ltd.
Tair Chu Enterprise Co., Ltd.
TrueChoicePack Corp.
15. Methodology and Data Sources
15.1 Customization Offerings
15.2 Subscription Services
15.3 Related Reports
15.4 Publisher Expertise
LIST OF TABLES
Table 1 Market Segmentation Analysis
Table 2 Global Disposable Plastic Cutlery Market Share of Leading Companies, 2023
Table 3 Product Offerings of Leading Companies
Table 4 Low Growth Scenario Forecasts
Table 5 Reference Case Growth Scenario
Table 6 High Growth Case Scenario
Table 7 Global Disposable Plastic Cutlery Revenue (USD Million) And CAGR (%) By Type (2021-2032)
Table 8 Global Disposable Plastic Cutlery Revenue (USD Million) And CAGR (%) By Application (2021-2032)
Table 9 Global Disposable Plastic Cutlery Revenue (USD Million) And CAGR (%) By Product (2021-2032)
Table 10 Global Disposable Plastic Cutlery Market Revenue (USD Million) By Regions (2021-2032)
Table 11 Global Disposable Plastic Cutlery Market Share (%) By Regions (2021-2032)
Table 12 North America Disposable Plastic Cutlery Revenue (USD Million) By Country (2021-2032)
Table 13 Europe Disposable Plastic Cutlery Revenue (USD Million) By Country (2021-2032)
Table 14 Asia Pacific Disposable Plastic Cutlery Revenue (USD Million) By Country (2021-2032)
Table 15 South America Disposable Plastic Cutlery Revenue (USD Million) By Country (2021-2032)
Table 16 Middle East and Africa Disposable Plastic Cutlery Revenue (USD Million) By Region (2021-2032)
Table 17 North America Disposable Plastic Cutlery Revenue (USD Million) By Type (2021-2032)
Table 18 North America Disposable Plastic Cutlery Revenue (USD Million) By Application (2021-2032)
Table 19 North America Disposable Plastic Cutlery Revenue (USD Million) By Product (2021-2032)
Table 20 Europe Disposable Plastic Cutlery Revenue (USD Million) By Type (2021-2032)
Table 21 Europe Disposable Plastic Cutlery Revenue (USD Million) By Application (2021-2032)
Table 22 Europe Disposable Plastic Cutlery Revenue (USD Million) By Product (2021-2032)
Table 23 Asia Pacific Disposable Plastic Cutlery Revenue (USD Million) By Type (2021-2032)
Table 24 Asia Pacific Disposable Plastic Cutlery Revenue (USD Million) By Application (2021-2032)
Table 25 Asia Pacific Disposable Plastic Cutlery Revenue (USD Million) By Product (2021-2032)
Table 26 South America Disposable Plastic Cutlery Revenue (USD Million) By Type (2021-2032)
Table 27 South America Disposable Plastic Cutlery Revenue (USD Million) By Application (2021-2032)
Table 28 South America Disposable Plastic Cutlery Revenue (USD Million) By Product (2021-2032)
Table 29 Middle East and Africa Disposable Plastic Cutlery Revenue (USD Million) By Type (2021-2032)
Table 30 Middle East and Africa Disposable Plastic Cutlery Revenue (USD Million) By Application (2021-2032)
Table 31 Middle East and Africa Disposable Plastic Cutlery Revenue (USD Million) By Product (2021-2032)
LIST OF FIGURES
Figure 1. Market Scope
Figure 2. Pricing Forecasts Per Unit, 2023- 2032
Figure 3. Porter’s Five Forces
Figure 4. Global Disposable Plastic Cutlery Market Revenue (USD Million) By Regions (2021-2032)
Figure 5. Global Disposable Plastic Cutlery Market Share (%) By Regions (2023)
Figure 6. North America Disposable Plastic Cutlery Revenue (USD Million) By Country (2021-2032)
Figure 7. United States Disposable Plastic Cutlery Revenue (USD Million) By Country (2021-2032)
Figure 8. Canada Disposable Plastic Cutlery Revenue (USD Million) By Country (2021-2032)
Figure 9. Mexico Disposable Plastic Cutlery Revenue (USD Million) By Country (2021-2032)
Figure 10. Europe Disposable Plastic Cutlery Revenue (USD Million) By Country (2021-2032)
Figure 11. Germany Disposable Plastic Cutlery Revenue (USD Million) By Country (2021-2032)
Figure 12. France Disposable Plastic Cutlery Revenue (USD Million) By Country (2021-2032)
Figure 13. United Kingdom Disposable Plastic Cutlery Revenue (USD Million) By Country (2021-2032)
Figure 14. Spain Disposable Plastic Cutlery Revenue (USD Million) By Country (2021-2032)
Figure 15. Italy Disposable Plastic Cutlery Revenue (USD Million) By Country (2021-2032)
Figure 16. Russia Disposable Plastic Cutlery Revenue (USD Million) By Country (2021-2032)
Figure 17. Rest of Europe Disposable Plastic Cutlery Revenue (USD Million) By Country (2021-2032)
Figure 11. Asia Pacific Disposable Plastic Cutlery Revenue (USD Million) By Country (2021-2032)
Figure 12. China Disposable Plastic Cutlery Revenue (USD Million) By Country (2021-2032)
Figure 13. Japan Disposable Plastic Cutlery Revenue (USD Million) By Country (2021-2032)
Figure 14. India Disposable Plastic Cutlery Revenue (USD Million) By Country (2021-2032)
Figure 15. South Korea Disposable Plastic Cutlery Revenue (USD Million) By Country (2021-2032)
Figure 16. Australia Disposable Plastic Cutlery Revenue (USD Million) By Country (2021-2032)
Figure 17. South East Asia Disposable Plastic Cutlery Revenue (USD Million) By Country (2021-2032)
Figure 18. South America Disposable Plastic Cutlery Revenue (USD Million) By Country (2021-2032)
Figure 19. Brazil Disposable Plastic Cutlery Revenue (USD Million) By Country (2021-2032)
Figure 20. Argentina Disposable Plastic Cutlery Revenue (USD Million) By Country (2021-2032)
Figure 21. Rest of Asia Pacific Disposable Plastic Cutlery Revenue (USD Million) By Country (2021-2032)
Figure 22. Middle East and Africa Disposable Plastic Cutlery Revenue (USD Million) By Region (2021-2032)
Figure 23. Saudi Arabia Disposable Plastic Cutlery Revenue (USD Million) By Region (2021-2032)
Figure 24. The UAE Disposable Plastic Cutlery Revenue (USD Million) By Region (2021-2032)
Figure 25. Rest of Middle East Disposable Plastic Cutlery Revenue (USD Million) By Region (2021-2032)
Figure 26. South Africa Disposable Plastic Cutlery Revenue (USD Million) By Region (2021-2032)
Figure 27. Africa Disposable Plastic Cutlery Revenue (USD Million) By Region (2021-2032)
Figure 28. North America Disposable Plastic Cutlery Revenue (USD Million) By Type (2021-2032)
Figure 29. North America Disposable Plastic Cutlery Revenue (USD Million) By Application (2021-2032)
Figure 30. North America Disposable Plastic Cutlery Revenue (USD Million) By Product (2021-2032)
Figure 31. Europe Disposable Plastic Cutlery Revenue (USD Million) By Type (2021-2032)
Figure 32. Europe Disposable Plastic Cutlery Revenue (USD Million) By Application (2021-2032)
Figure 33. Europe Disposable Plastic Cutlery Revenue (USD Million) By Product (2021-2032)
Figure 34. Asia Pacific Disposable Plastic Cutlery Revenue (USD Million) By Type (2021-2032)
Figure 35. Asia Pacific Disposable Plastic Cutlery Revenue (USD Million) By Application (2021-2032)
Figure 36. Asia Pacific Disposable Plastic Cutlery Revenue (USD Million) By Product (2021-2032)
Figure 37. South America Disposable Plastic Cutlery Revenue (USD Million) By Type (2021-2032)
Figure 38. South America Disposable Plastic Cutlery Revenue (USD Million) By Application (2021-2032)
Figure 39. South America Disposable Plastic Cutlery Revenue (USD Million) By Product (2021-2032)
Figure 40. Middle East and Africa Disposable Plastic Cutlery Revenue (USD Million) By Type (2021-2032)
Figure 41. Middle East and Africa Disposable Plastic Cutlery Revenue (USD Million) By Application (2021-2032)
Figure 42. Middle East and Africa Disposable Plastic Cutlery Revenue (USD Million) By Product (2021-2032)
By Type
Plastic Forks
Plastic Spoon
Plastic Knife
By Application
Food Service/Catering
Food Processing
Household
Countries Analyzed
North America (US, Canada, Mexico)
Europe (Germany, UK, France, Spain, Italy, Russia, Rest of Europe)
Asia Pacific (China, India, Japan, South Korea, Australia, South East Asia, Rest of Asia)
South America (Brazil, Argentina, Rest of South America)
Middle East and Africa (Saudi Arabia, UAE, Rest of Middle East, South Africa, Egypt, Rest of Africa)
