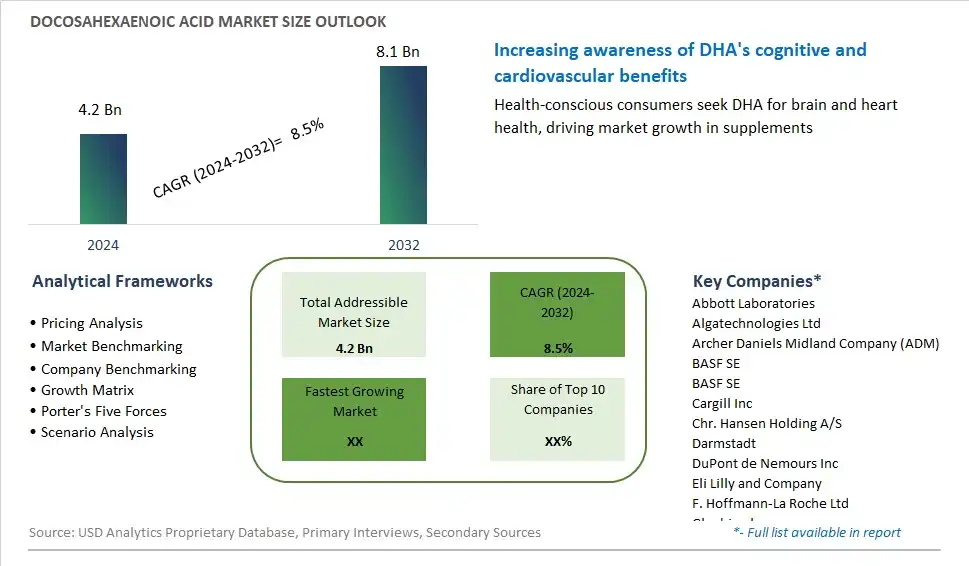
Global Docosahexaenoic Acid Market Size is valued at $4.2 Billion in 2024 and is forecast to register a growth rate (CAGR) of 8.5% to reach $8.1 Billion by 2032.
The global Docosahexaenoic Acid Market Comprehensive Study analyzes and forecasts the market size across 6 regions and 24 countries for diverse segments -By Source (Marine, Vegetable), By Application (Infant Formula, Nutritional Supplements, Food and Beverages, Pharmaceuticals), By End-User (Food and Beverage, Infant Nutrition, Pharmaceuticals, Nutraceutical)
An Introduction to Docosahexaenoic Acid Market
The Docosahexaenoic Acid (DHA) Market focuses on the production and sale of DHA, an omega-3 fatty acid essential for brain and eye health. DHA is widely used in infant formulas, dietary supplements, and functional foods. The market is driven by increasing awareness about the health benefits of omega-3 fatty acids, rising prevalence of lifestyle-related health conditions, and growing demand for nutritional supplements. Additionally, advancements in DHA production from algae and fish oil, and its expanding applications in various industries, support market growth.
Docosahexaenoic Acid Competitive Landscape
The market report analyses the leading companies in the industry including Abbott Laboratories, Algatechnologies Ltd, Archer Daniels Midland Company (ADM), BASF SE, BASF SE, Cargill Inc, Chr. Hansen Holding A/S, Darmstadt, DuPont de Nemours Inc, Eli Lilly and Company, F. Hoffmann-La Roche Ltd, Glanbia plc, Koninklijke DSM N.V., Lonza Group AG, Merck KGaA, Royal DSM N.V., and Others.
Docosahexaenoic Acid Market Dynamics
Docosahexaenoic Acid Market Trend: Growing Demand for Omega-3 Fatty Acids in Health and Wellness Products
A significant trend in the docosahexaenoic acid (DHA) market is the increasing demand for omega-3 fatty acids in health and wellness products, driven by rising consumer awareness of the health benefits associated with DHA consumption. DHA, an essential omega-3 fatty acid, plays a crucial role in brain health, cognitive function, cardiovascular health, and prenatal development. As consumers become more proactive about maintaining their health and well-being, there is a growing interest in incorporating DHA-rich foods and supplements into their diets. This trend is particularly pronounced among demographic groups such as pregnant women, infants, children, and aging populations, who have specific dietary needs and are seeking products that support optimal health outcomes. Manufacturers are responding to this demand by fortifying a wide range of food and beverage products, including infant formula, functional foods, dietary supplements, and fortified beverages, with DHA to cater to the evolving preferences and nutritional requirements of health-conscious consumers.
Market Driver: Rising Incidence of Chronic Diseases and Focus on Preventative Healthcare
A key driver of the DHA market is the rising incidence of chronic diseases and the growing focus on preventative healthcare, which has led to increased awareness of the importance of omega-3 fatty acids in disease prevention and management. Chronic conditions such as cardiovascular disease, cognitive decline, eye disorders, and inflammatory conditions are prevalent worldwide and are driving consumers to seek dietary interventions to reduce their risk factors and improve their overall health outcomes. DHA, as a vital nutrient with anti-inflammatory, neuroprotective, and cardioprotective properties, is recognized for its role in supporting cardiovascular health, cognitive function, eye health, and inflammatory response. Healthcare professionals, nutritionists, and public health organizations are advocating for increased DHA intake through dietary recommendations, supplementation, and education initiatives to address nutritional deficiencies and promote optimal health. This growing emphasis on preventative healthcare and the role of nutrition in disease prevention is driving demand for DHA-rich products and supplements as part of a holistic approach to wellness and disease management.
Market Opportunity: Expansion into Functional Food and Beverage Applications
An opportunity for the DHA market lies in expanding into functional food and beverage applications to capitalize on the growing demand for fortified products that offer targeted health benefits. Functional foods and beverages, fortified with bioactive ingredients such as DHA, are gaining popularity as consumers seek convenient and enjoyable ways to incorporate health-promoting nutrients into their diets. Manufacturers can leverage this opportunity by developing innovative DHA-fortified products across various categories, including dairy alternatives, breakfast cereals, snack bars, fruit juices, and sports drinks, to meet the diverse needs and preferences of consumers. By formulating products with clinically relevant doses of DHA and communicating the associated health benefits effectively, manufacturers can differentiate their offerings, enhance consumer appeal, and tap into new market segments seeking functional and health-enhancing food and beverage options. Additionally, partnerships with healthcare professionals, nutritionists, and wellness experts can help validate the efficacy of DHA-fortified products and strengthen consumer trust in their health-promoting properties, driving further market penetration and growth.
Docosahexaenoic Acid Market Share Analysis: Marine Docosahexaenoic Acid (DHA) Market held the dominant market share in 2024
Among the segmentation of the Docosahexaenoic Acid (DHA) Market by Source, the Marine segment is the largest, driven by several factors contributing to its dominance in the market. Marine sources, such as fish oil and algae, are rich natural sources of DHA, a vital omega-3 fatty acid essential for human health, particularly brain development and cardiovascular function. Marine-derived DHA is renowned for its high bioavailability and concentration, making it a preferred choice for dietary supplements, infant formulas, and functional foods targeting consumers seeking to enhance their cognitive health and overall well-being. Additionally, marine-derived DHA supplements are often perceived as more potent and efficacious than their vegetable-derived counterparts, further driving their popularity among health-conscious consumers. Further, the sustainable sourcing practices and technological advancements in marine DHA production have expanded the availability and affordability of marine-derived DHA products, contributing to their widespread adoption across global markets. As consumers increasingly prioritize omega-3 supplementation and functional foods enriched with DHA for their health benefits, the Marine DHA segment maintains its lead in the market, supported by its superior quality, efficacy, and consumer trust.
Docosahexaenoic Acid Market Share Analysis: Infant Formula Application market is poised to register the fastest growth rae over the forecast period to 2032
Among the segmentation of the Docosahexaenoic Acid (DHA) Market by Application, the Infant Formula segment is the fastest-growing, propelled by several factors contributing to its rapid expansion. DHA is a crucial nutrient for infant development, particularly for the development of the brain and eyes. Recognizing the importance of early-life nutrition, parents and caregivers increasingly seek infant formulas fortified with DHA to ensure optimal cognitive and visual development in infants. Additionally, healthcare providers and regulatory bodies worldwide recommend the supplementation of infant formulas with DHA, further driving demand. Further, advancements in formulation technology and ingredient sourcing have enabled manufacturers to produce infant formulas with higher concentrations of DHA, offering parents a wider selection of products to meet their infants' nutritional needs. As awareness of the benefits of DHA-fortified infant formulas continues to grow among consumers and healthcare professionals, the Infant Formula segment experiences robust growth, positioning it as the fastest-growing segment in the Docosahexaenoic Acid Market.
Docosahexaenoic Acid Market Share Analysis: Food and Beverage End-User Segment held the dominant market share in 2024
Among the segmentation of the Docosahexaenoic Acid (DHA) Market by End-User, the Food and Beverage segment is the largest, driven by several factors contributing to its dominance in the market. DHA is increasingly recognized for its health benefits, particularly its role in supporting cognitive function, cardiovascular health, and eye health. As consumers become more health-conscious and seek out functional foods and beverages that offer added nutritional benefits, manufacturers are incorporating DHA into a wide range of food and beverage products. These include dairy products, juices, cereals, and snack bars, among others, catering to diverse consumer preferences and dietary needs. Further, the availability of DHA-fortified food and beverage products in supermarkets, grocery stores, and online platforms further enhances their accessibility and appeal to consumers seeking convenient ways to incorporate DHA into their diets. As the demand for functional foods and beverages continues to rise, driven by increasing consumer awareness of the health benefits of DHA, the Food and Beverage segment maintains its lead in the Docosahexaenoic Acid Market, supported by its widespread adoption and versatility across a variety of product categories.
Docosahexaenoic Acid Market Segmentation
By Source
Marine
Vegetable
By Application
Infant Formula
Nutritional Supplements
Food and Beverages
Pharmaceuticals
By End-User
Food and Beverage
Infant Nutrition
Pharmaceuticals
Nutraceutical
Countries Analyzed
North America (US, Canada, Mexico)
Europe (Germany, UK, France, Spain, Italy, Russia, Rest of Europe)
Asia Pacific (China, India, Japan, South Korea, Australia, South East Asia, Rest of Asia)
South America (Brazil, Argentina, Rest of South America)
Middle East and Africa (Saudi Arabia, UAE, Rest of Middle East, South Africa, Egypt, Rest of Africa)
Docosahexaenoic Acid Companies Profiled in the Study
Abbott Laboratories
Algatechnologies Ltd
Archer Daniels Midland Company (ADM)
BASF SE
BASF SE
Cargill Inc
Chr. Hansen Holding A/S
Darmstadt
DuPont de Nemours Inc
Eli Lilly and Company
F. Hoffmann-La Roche Ltd
Glanbia plc
Koninklijke DSM N.V.
Lonza Group AG
Merck KGaA
Royal DSM N.V.
*- List Not Exhaustive
Chapter 1. TABLE OF CONTENTS
Chapter 2. Introduction to Docosahexaenoic Acid Market
2.1. Market Overview
2.2. Key Statistics and Report Highlights
2.3. Scope of the Comprehensive Study
2.3.1. Market Definition
2.3.2 Countries and Regions Covered
2.3.3 Research Objective
2.3.4 Units, Currency, and Conversions
2.3.5 Industry Value Chain
2.4. Key Market Segments
2.5. Key Companies
2.6. Study Period
Chapter 3. Strategic Analysis Review
3.1. Docosahexaenoic Acid Pricing Analysis and Forecast
3.2. Porter’s Five Forces
3.3. Market Ecosystem
3.4. SWOT Analysis
3.5. Regulatory Scenario
3.3. Effects of Inflation, Russia-Ukraine War, moderating economic growth, and other macroeconomic factors
Chapter 4. Competitive Landscape
4.1. Market Share Analysis
4.1.1. Global Docosahexaenoic Acid Market Share by Company, 2023
4.1.2. Product Offerings of Leading Docosahexaenoic Acid Companies
4.2. Market Entropy
4.2.1. New Product Launches in the Industry
4.2.2. Mergers, Acquisitions, Joint ventures, and Partnerships
4.3. Key Strategies and Best Practices
Chapter 5. Global Market Projections: Best, Reference, and Low Case Scenarios
5.1. Growth Analysis- Case Scenario Definitions
5.2. Low Growth Case Scenario Forecasts
5.3. Reference Growth Case Scenario Forecasts
5.4. High Growth Case Scenario Forecasts
Chapter 6. Market Dynamics
6.1. Docosahexaenoic Acid Market Drivers
6.2. Docosahexaenoic Acid Market Challenges
6.6. Docosahexaenoic Acid Market Opportunities
6.4. Docosahexaenoic Acid Market Trends
Chapter 7. Global Docosahexaenoic Acid Market Outlook Trends
7.1. Global Docosahexaenoic Acid Revenue (USD Million) and CAGR (%) by Type (2021-2032)
7.2. Global Docosahexaenoic Acid Revenue (USD Million) and CAGR (%) by Application (2021-2032)
7.3. Global Docosahexaenoic Acid Revenue (USD Million) and CAGR (%) by Product (2021-2032)
By Source
Marine
Vegetable
By Application
Infant Formula
Nutritional Supplements
Food and Beverages
Pharmaceuticals
By End-User
Food and Beverage
Infant Nutrition
Pharmaceuticals
Nutraceutical
Chapter 8. Global Docosahexaenoic Acid Regional Analysis and Outlook
8.1. Global Docosahexaenoic Acid Revenue (USD Million) By Regions (2021- 2032)
8.2. North America Docosahexaenoic Acid Revenue (USD Million) by Country (2021-2032)
8.2.1. United States Docosahexaenoic Acid Regional Analysis and Outlook
8.2.2. Canada Docosahexaenoic Acid Regional Analysis and Outlook
8.2.3. Mexico Docosahexaenoic Acid Regional Analysis and Outlook
8.3. Europe Docosahexaenoic Acid Revenue (USD Million), by Country (2021-2032)
8.3.1. Germany Docosahexaenoic Acid Regional Analysis and Outlook
8.3.2. France Docosahexaenoic Acid Regional Analysis and Outlook
8.3.3. United Kingdom Docosahexaenoic Acid Regional Analysis and Outlook
8.3.4. Spain Docosahexaenoic Acid Regional Analysis and Outlook
8.3.5. Italy Docosahexaenoic Acid Regional Analysis and Outlook
8.3.6. Russia Docosahexaenoic Acid Regional Analysis and Outlook
8.3.7. Rest of Europe Docosahexaenoic Acid Regional Analysis and Outlook
8.4. Asia Pacific Docosahexaenoic Acid Revenue (USD Million) by Country (2021-2032)
8.4.1. China Docosahexaenoic Acid Regional Analysis and Outlook
8.4.2. Japan Docosahexaenoic Acid Regional Analysis and Outlook
8.4.3. India Docosahexaenoic Acid Regional Analysis and Outlook
8.4.4. South Korea Docosahexaenoic Acid Regional Analysis and Outlook
8.4.5. Australia Docosahexaenoic Acid Regional Analysis and Outlook
8.4.6. South East Asia Docosahexaenoic Acid Regional Analysis and Outlook
8.4.7. Rest of Asia Pacific Docosahexaenoic Acid Regional Analysis and Outlook
8.5. South America Docosahexaenoic Acid Revenue (USD Million), by Country (2021-2032)
8.5.1. Brazil Docosahexaenoic Acid Regional Analysis and Outlook
8.5.2. Argentina Docosahexaenoic Acid Regional Analysis and Outlook
8.5.3. Rest of South America Docosahexaenoic Acid Regional Analysis and Outlook
8.6. Middle East and Africa Docosahexaenoic Acid Revenue (USD Million) by Country (2021-2032)
8.6.1. Middle East Docosahexaenoic Acid Regional Analysis and Outlook
8.6.2. Africa Docosahexaenoic Acid Regional Analysis and Outlook
Chapter 9. North America Docosahexaenoic Acid Analysis and Outlook
9.1. North America Docosahexaenoic Acid Revenue (USD Million) by Segments (2021-2032)
9.1.1. North America Docosahexaenoic Acid Revenue (USD Million) by Type (2021-2032)
9.1.2. North America Docosahexaenoic Acid Revenue (USD Million) by Application (2021-2032)
9.1.3. North America Docosahexaenoic Acid Revenue (USD Million) by Product (2021-2032)
By Source
Marine
Vegetable
By Application
Infant Formula
Nutritional Supplements
Food and Beverages
Pharmaceuticals
By End-User
Food and Beverage
Infant Nutrition
Pharmaceuticals
Nutraceutical
Chapter 10. Europe Docosahexaenoic Acid Analysis and Outlook
10.1. Europe Docosahexaenoic Acid Revenue (USD Million), by Segments (USD Million) (2021-2032)
10.1.1. Europe Docosahexaenoic Acid Revenue (USD Million) by Type (2021-2032)
10.1.2. Europe Docosahexaenoic Acid Revenue (USD Million) by Application (2021-2032)
10.1.3. Europe Docosahexaenoic Acid Revenue (USD Million) by Product (2021-2032)
By Source
Marine
Vegetable
By Application
Infant Formula
Nutritional Supplements
Food and Beverages
Pharmaceuticals
By End-User
Food and Beverage
Infant Nutrition
Pharmaceuticals
Nutraceutical
Chapter 11. Asia Pacific Docosahexaenoic Acid Analysis and Outlook
11.1. Asia Pacific Docosahexaenoic Acid Revenue (USD Million), and Revenue (USD Million) by Segments (2021-2032)
11.1.1. Asia Pacific Docosahexaenoic Acid Revenue (USD Million) by Type (2021-2032)
11.1.2. Asia Pacific Docosahexaenoic Acid Revenue (USD Million) by Application (2021-2032)
11.1.3. Asia Pacific Docosahexaenoic Acid Revenue (USD Million) by Product (2021-2032)
By Source
Marine
Vegetable
By Application
Infant Formula
Nutritional Supplements
Food and Beverages
Pharmaceuticals
By End-User
Food and Beverage
Infant Nutrition
Pharmaceuticals
Nutraceutical
Chapter 12. South America Docosahexaenoic Acid Analysis and Outlook
12.1. South America Docosahexaenoic Acid Revenue (USD Million), by Segments (2021-2032)
12.1.1. South America Docosahexaenoic Acid Revenue (USD Million) by Type (2021-2032)
12.1.2. South America Docosahexaenoic Acid Revenue (USD Million) by Application (2021-2032)
12.1.3. South America Docosahexaenoic Acid Revenue (USD Million) by Product (2021-2032)
By Source
Marine
Vegetable
By Application
Infant Formula
Nutritional Supplements
Food and Beverages
Pharmaceuticals
By End-User
Food and Beverage
Infant Nutrition
Pharmaceuticals
Nutraceutical
Chapter 13. Middle East and Africa Docosahexaenoic Acid Analysis and Outlook
13.1. Middle East and Africa Docosahexaenoic Acid Revenue (USD Million), by Segments (2021-2032)
13.1.1. Middle East and Africa Docosahexaenoic Acid Revenue (USD Million) by Type (2021-2032)
13.1.2. Middle East and Africa Docosahexaenoic Acid Revenue (USD Million) by Application (2021-2032)
13.1.3. Middle East and Africa Docosahexaenoic Acid Revenue (USD Million) by Product (2021-2032)
By Source
Marine
Vegetable
By Application
Infant Formula
Nutritional Supplements
Food and Beverages
Pharmaceuticals
By End-User
Food and Beverage
Infant Nutrition
Pharmaceuticals
Nutraceutical
Chapter 14. Docosahexaenoic Acid Company Profiles
14.1 Business Overview
14.2 Product Profiles
14.3 SWOT Profiles
14.5 Recent Developments
14.6 Financial Profile
List of Companies
Abbott Laboratories
Algatechnologies Ltd
Archer Daniels Midland Company (ADM)
BASF SE
BASF SE
Cargill Inc
Chr. Hansen Holding A/S
Darmstadt
DuPont de Nemours Inc
Eli Lilly and Company
F. Hoffmann-La Roche Ltd
Glanbia plc
Koninklijke DSM N.V.
Lonza Group AG
Merck KGaA
Royal DSM N.V.
15. Methodology and Data Sources
15.1 Customization Offerings
15.2 Subscription Services
15.3 Related Reports
15.4 Publisher Expertise
LIST OF TABLES
Table 1 Market Segmentation Analysis
Table 2 Global Docosahexaenoic Acid Market Share of Leading Companies, 2023
Table 3 Product Offerings of Leading Companies
Table 4 Low Growth Scenario Forecasts
Table 5 Reference Case Growth Scenario
Table 6 High Growth Case Scenario
Table 7 Global Docosahexaenoic Acid Revenue (USD Million) And CAGR (%) By Type (2021-2032)
Table 8 Global Docosahexaenoic Acid Revenue (USD Million) And CAGR (%) By Application (2021-2032)
Table 9 Global Docosahexaenoic Acid Revenue (USD Million) And CAGR (%) By Product (2021-2032)
Table 10 Global Docosahexaenoic Acid Market Revenue (USD Million) By Regions (2021-2032)
Table 11 Global Docosahexaenoic Acid Market Share (%) By Regions (2021-2032)
Table 12 North America Docosahexaenoic Acid Revenue (USD Million) By Country (2021-2032)
Table 13 Europe Docosahexaenoic Acid Revenue (USD Million) By Country (2021-2032)
Table 14 Asia Pacific Docosahexaenoic Acid Revenue (USD Million) By Country (2021-2032)
Table 15 South America Docosahexaenoic Acid Revenue (USD Million) By Country (2021-2032)
Table 16 Middle East and Africa Docosahexaenoic Acid Revenue (USD Million) By Region (2021-2032)
Table 17 North America Docosahexaenoic Acid Revenue (USD Million) By Type (2021-2032)
Table 18 North America Docosahexaenoic Acid Revenue (USD Million) By Application (2021-2032)
Table 19 North America Docosahexaenoic Acid Revenue (USD Million) By Product (2021-2032)
Table 20 Europe Docosahexaenoic Acid Revenue (USD Million) By Type (2021-2032)
Table 21 Europe Docosahexaenoic Acid Revenue (USD Million) By Application (2021-2032)
Table 22 Europe Docosahexaenoic Acid Revenue (USD Million) By Product (2021-2032)
Table 23 Asia Pacific Docosahexaenoic Acid Revenue (USD Million) By Type (2021-2032)
Table 24 Asia Pacific Docosahexaenoic Acid Revenue (USD Million) By Application (2021-2032)
Table 25 Asia Pacific Docosahexaenoic Acid Revenue (USD Million) By Product (2021-2032)
Table 26 South America Docosahexaenoic Acid Revenue (USD Million) By Type (2021-2032)
Table 27 South America Docosahexaenoic Acid Revenue (USD Million) By Application (2021-2032)
Table 28 South America Docosahexaenoic Acid Revenue (USD Million) By Product (2021-2032)
Table 29 Middle East and Africa Docosahexaenoic Acid Revenue (USD Million) By Type (2021-2032)
Table 30 Middle East and Africa Docosahexaenoic Acid Revenue (USD Million) By Application (2021-2032)
Table 31 Middle East and Africa Docosahexaenoic Acid Revenue (USD Million) By Product (2021-2032)
LIST OF FIGURES
Figure 1. Market Scope
Figure 2. Pricing Forecasts Per Unit, 2023- 2032
Figure 3. Porter’s Five Forces
Figure 4. Global Docosahexaenoic Acid Market Revenue (USD Million) By Regions (2021-2032)
Figure 5. Global Docosahexaenoic Acid Market Share (%) By Regions (2023)
Figure 6. North America Docosahexaenoic Acid Revenue (USD Million) By Country (2021-2032)
Figure 7. United States Docosahexaenoic Acid Revenue (USD Million) By Country (2021-2032)
Figure 8. Canada Docosahexaenoic Acid Revenue (USD Million) By Country (2021-2032)
Figure 9. Mexico Docosahexaenoic Acid Revenue (USD Million) By Country (2021-2032)
Figure 10. Europe Docosahexaenoic Acid Revenue (USD Million) By Country (2021-2032)
Figure 11. Germany Docosahexaenoic Acid Revenue (USD Million) By Country (2021-2032)
Figure 12. France Docosahexaenoic Acid Revenue (USD Million) By Country (2021-2032)
Figure 13. United Kingdom Docosahexaenoic Acid Revenue (USD Million) By Country (2021-2032)
Figure 14. Spain Docosahexaenoic Acid Revenue (USD Million) By Country (2021-2032)
Figure 15. Italy Docosahexaenoic Acid Revenue (USD Million) By Country (2021-2032)
Figure 16. Russia Docosahexaenoic Acid Revenue (USD Million) By Country (2021-2032)
Figure 17. Rest of Europe Docosahexaenoic Acid Revenue (USD Million) By Country (2021-2032)
Figure 11. Asia Pacific Docosahexaenoic Acid Revenue (USD Million) By Country (2021-2032)
Figure 12. China Docosahexaenoic Acid Revenue (USD Million) By Country (2021-2032)
Figure 13. Japan Docosahexaenoic Acid Revenue (USD Million) By Country (2021-2032)
Figure 14. India Docosahexaenoic Acid Revenue (USD Million) By Country (2021-2032)
Figure 15. South Korea Docosahexaenoic Acid Revenue (USD Million) By Country (2021-2032)
Figure 16. Australia Docosahexaenoic Acid Revenue (USD Million) By Country (2021-2032)
Figure 17. South East Asia Docosahexaenoic Acid Revenue (USD Million) By Country (2021-2032)
Figure 18. South America Docosahexaenoic Acid Revenue (USD Million) By Country (2021-2032)
Figure 19. Brazil Docosahexaenoic Acid Revenue (USD Million) By Country (2021-2032)
Figure 20. Argentina Docosahexaenoic Acid Revenue (USD Million) By Country (2021-2032)
Figure 21. Rest of Asia Pacific Docosahexaenoic Acid Revenue (USD Million) By Country (2021-2032)
Figure 22. Middle East and Africa Docosahexaenoic Acid Revenue (USD Million) By Region (2021-2032)
Figure 23. Saudi Arabia Docosahexaenoic Acid Revenue (USD Million) By Region (2021-2032)
Figure 24. The UAE Docosahexaenoic Acid Revenue (USD Million) By Region (2021-2032)
Figure 25. Rest of Middle East Docosahexaenoic Acid Revenue (USD Million) By Region (2021-2032)
Figure 26. South Africa Docosahexaenoic Acid Revenue (USD Million) By Region (2021-2032)
Figure 27. Africa Docosahexaenoic Acid Revenue (USD Million) By Region (2021-2032)
Figure 28. North America Docosahexaenoic Acid Revenue (USD Million) By Type (2021-2032)
Figure 29. North America Docosahexaenoic Acid Revenue (USD Million) By Application (2021-2032)
Figure 30. North America Docosahexaenoic Acid Revenue (USD Million) By Product (2021-2032)
Figure 31. Europe Docosahexaenoic Acid Revenue (USD Million) By Type (2021-2032)
Figure 32. Europe Docosahexaenoic Acid Revenue (USD Million) By Application (2021-2032)
Figure 33. Europe Docosahexaenoic Acid Revenue (USD Million) By Product (2021-2032)
Figure 34. Asia Pacific Docosahexaenoic Acid Revenue (USD Million) By Type (2021-2032)
Figure 35. Asia Pacific Docosahexaenoic Acid Revenue (USD Million) By Application (2021-2032)
Figure 36. Asia Pacific Docosahexaenoic Acid Revenue (USD Million) By Product (2021-2032)
Figure 37. South America Docosahexaenoic Acid Revenue (USD Million) By Type (2021-2032)
Figure 38. South America Docosahexaenoic Acid Revenue (USD Million) By Application (2021-2032)
Figure 39. South America Docosahexaenoic Acid Revenue (USD Million) By Product (2021-2032)
Figure 40. Middle East and Africa Docosahexaenoic Acid Revenue (USD Million) By Type (2021-2032)
Figure 41. Middle East and Africa Docosahexaenoic Acid Revenue (USD Million) By Application (2021-2032)
Figure 42. Middle East and Africa Docosahexaenoic Acid Revenue (USD Million) By Product (2021-2032)
By Source
Marine
Vegetable
By Application
Infant Formula
Nutritional Supplements
Food and Beverages
Pharmaceuticals
By End-User
Food and Beverage
Infant Nutrition
Pharmaceuticals
Nutraceutical
Countries Analyzed
North America (US, Canada, Mexico)
Europe (Germany, UK, France, Spain, Italy, Russia, Rest of Europe)
Asia Pacific (China, India, Japan, South Korea, Australia, South East Asia, Rest of Asia)
South America (Brazil, Argentina, Rest of South America)
Middle East and Africa (Saudi Arabia, UAE, Rest of Middle East, South Africa, Egypt, Rest of Africa)
