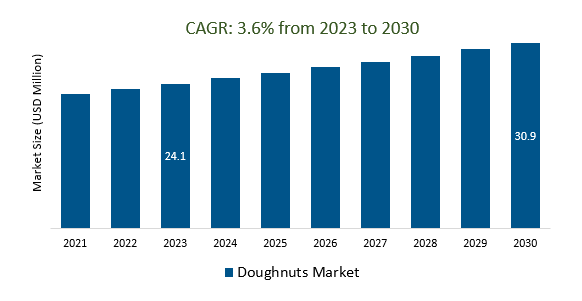
The Global Doughnuts Market Size is estimated to be US 24.1 Billion in 2023 and is poised to register 3.6% growth over the forecast period from 2023 to 2030 to reach US $ 30.9 billion in 2030.
The market growth is driven by the increasing Consumers who are increasingly looking for healthier alternatives, leading to the rise of baked, gluten-free, vegan, and lower-sugar doughnuts. This caters to health-conscious and dietary-restricted individuals. Leading companies that are focused on Healthy and Functional Doughnuts, Plant-Based and Alternative Ingredients, Global Fusion Flavors, Digital Transformation, and others to boost market shares in the industry.
Market Overview
The global doughnut market, characterized by steady growth, diverse product offerings, and a focus on innovation, caters to changing consumer tastes and preferences. Key players like Dunkin', Krispy Kreme, and Tim Hortons compete with a rising number of independent artisanal doughnut shops. Noteworthy trends include healthier doughnut options, unique flavors, online ordering and delivery, sustainability, and the pairing of doughnuts with quality coffee. The market's future outlook involves further innovation, expansion into new regions, and the increasing use of technology for online operations and marketing.
Market Dynamics
Market Trends - Doughnuts with a Healthier Twist
Doughnuts with a Healthier Twist" represents a significant trend in the doughnut market, responding to consumer demands for healthier options. This trend involves the creation of doughnuts with reduced sugar content, baked instead of fried and made with ingredients that cater to dietary restrictions such as gluten-free or vegan. Health-conscious consumers are increasingly seeking out these alternatives, and businesses in the doughnut market are adapting by offering options that align with these preferences.
Market Driver- Digital Marketing Demand Doughnuts Market
Digital marketing is in high demand in the doughnuts market, serving as a crucial tool for promoting doughnut businesses, engaging customers, and boosting sales. This demand is driven by the need to reach a competitive audience and take advantage of online ordering and delivery platforms. Effective digital marketing strategies, such as social media campaigns, email marketing, SEO, and online advertising, help doughnut shops showcase their products, run promotions, and foster customer loyalty, thereby facilitating growth and brand awareness in the doughnut market.
Market Opportunity-Introduction of Artisanal and Craft Doughnuts
The emergence of artisanal and craft doughnuts is reshaping the doughnut market, focusing on quality, creativity, and unique offerings. These handcrafted treats, known for gourmet flavors, seasonal ingredients, and visually appealing designs, respond to consumers' desire for premium and personalized culinary experiences, enhancing taste and aesthetics. This trend adds diversity and innovation to the doughnut market, catering to a discerning audience seeking distinctive and high-quality doughnut options.
Market Share Analysis- Gourmet Donuts Doughnuts Market will register the fastest growth
The Global Doughnuts Market is analyzed across Gourmet Donuts, Cruller, Yeast Donuts, Cake Donuts, and others. Gourmet Donuts is poised to register the fastest growth. Gourmet donuts are a notable addition to the doughnuts market, characterized by premium ingredients, creative flavors, and intricate designs. This trend caters to consumers seeking a more refined and indulgent doughnut experience, often involving collaborations with local or artisanal suppliers for high-quality ingredients. Gourmet donuts enhance market diversification and offer a unique option for discerning consumers looking for elevated and distinctive sweet treats.
Market Share Analysis- Retail held a significant market share in 2023
The Global Doughnuts Market is analyzed across various applications including Food Services, Retail, and others. Of these, Retail held a significant market share in 2023. Retail is a pivotal distribution channel in the doughnut market, encompassing various outlets such as standalone doughnut shops, coffee shops, bakeries, supermarkets, convenience stores, and gas stations. These locations offer both freshly made and pre-packaged doughnuts, meeting consumer demands for on-the-go snacks, breakfast choices, and desserts. Additionally, the retail segment includes online sales and delivery services, enabling consumers to order doughnuts through e-commerce platforms and food delivery apps, enhancing market accessibility and convenience.
Doughnuts Market Segmentation
By Type
- Gourmet Donuts
- Cruller
- Yeast Donuts
- Cake Donuts
- Others
By Application
By Distribution Channel
- Supermarkets/Hypermarkets
- Specialty Store
- Convenience Store
- Online
By Region
- North America (United States, Canada, Mexico)
- Europe (Germany, France, United Kingdom, Spain, Italy, Others)
- Asia Pacific (China, India, Japan, South Korea, Australia, Others)
- Latin America (Brazil, Argentina, Others)
- Middle East and Africa (Saudi Arabia, UAE, Kuwait, Other Middle East, South Africa, Nigeria, Other Africa)
Doughnuts Market Companies
- Dunkin' Brands Group Inc (United States)
- Tim Hortons Inc (Canada)
- Daylight Donuts (United States)
- Krispy Kreme Doughnuts (United States)
- J.CO Donuts & Coffee (Indonesia)
- Mad Over Donuts (Singapore)
- Mister Donut (Japan)
- Donut King (Australia)
- Honey Dew Donuts (United States)
- Go Nuts Donuts (Philippines)
*List not exhaustive
Doughnuts Market Outlook 2023
1 Market Overview
1.1 Introduction to the Doughnuts Market
1.2 Scope of the Study
1.3 Research Objective
1.3.1 Key Market Scope and Segments
1.3.2 Players Covered
1.3.3 Years Considered
2 Executive Summary
2.1 2023 Doughnuts Industry- Market Statistics
3 Market Dynamics
3.1 Market Drivers
3.2 Market Challenges
3.3 Market Opportunities
3.4 Market Trends
4 Market Factor Analysis
4.1 Porter’s Five Forces
4.2 Market Entropy
4.2.1 Global Doughnuts Market Companies with Area Served
4.2.2 Products Offerings Global Doughnuts Market
5 COVID-19 Impact Analysis and Outlook Scenarios
5.1.1 Covid-19 Impact Analysis
5.1.2 post-COVID-19 Scenario- Low Growth Case
5.1.3 post-COVID-19 Scenario- Reference Growth Case
5.1.4 post-COVID-19 Scenario- Low Growth Case
6 Global Doughnuts Market Trends
6.1 Global Doughnuts Revenue (USD Million) and CAGR (%) by Type (2018-2030)
6.2 Global Doughnuts Revenue (USD Million) and CAGR (%) by Applications (2018-2030)
6.3 Global Doughnuts Revenue (USD Million) and CAGR (%) by regions (2018-2030)
7 Global Doughnuts Market Revenue (USD Million) by Type, and Applications (2018-2022)
7.1 Global Doughnuts Revenue (USD Million) by Type (2018-2022)
7.1.1 Global Doughnuts Revenue (USD Million), Market Share (%) by Type (2018-2022)
7.2 Global Doughnuts Revenue (USD Million) by Applications (2018-2022)
7.2.1 Global Doughnuts Revenue (USD Million), Market Share (%) by Applications (2018-2022)
8 Global Doughnuts Development Regional Status and Outlook
8.1 Global Doughnuts Revenue (USD Million) By Regions (2018-2022)
8.2 North America Doughnuts Revenue (USD Million) by Type, and Application (2018-2022)
8.2.1 North America Doughnuts Revenue (USD Million) by Country (2018-2022)
8.2.2 North America Doughnuts Revenue (USD Million) by Type (2018-2022)
8.2.3 North America Doughnuts Revenue (USD Million) by Applications (2018-2022)
8.3 Europe Doughnuts Revenue (USD Million), by Type, and Applications (USD Million) (2018-2022)
8.3.1 Europe Doughnuts Revenue (USD Million), by Country (2018-2022)
8.3.2 Europe Doughnuts Revenue (USD Million) by Type (2018-2022)
8.3.3 Europe Doughnuts Revenue (USD Million) by Applications (2018-2022)
8.4 Asia Pacific Doughnuts Revenue (USD Million), and Revenue (USD Million) by Type, and Applications (2018-2022)
8.4.1 Asia Pacific Doughnuts Revenue (USD Million) by Country (2018-2022)
8.4.2 Asia Pacific Doughnuts Revenue (USD Million) by Type (2018-2022)
8.4.3 Asia Pacific Doughnuts Revenue (USD Million) by Applications (2018-2022)
8.5 South America Doughnuts Revenue (USD Million), by Type, and Applications (2018-2022)
8.5.1 South America Doughnuts Revenue (USD Million), by Country (2018-2022)
8.5.2 South America Doughnuts Revenue (USD Million) by Type (2018-2022)
8.5.3 South America Doughnuts Revenue (USD Million) by Applications (2018-2022)
8.6 Middle East and Africa Doughnuts Revenue (USD Million), by Type, Technology, Application, Thickness (2018-2022)
8.6.1 Middle East and Africa Doughnuts Revenue (USD Million) by Country (2018-2022)
8.6.2 Middle East and Africa Doughnuts Revenue (USD Million) by Type (2018-2022)
8.6.3 Middle East and Africa Doughnuts Revenue (USD Million) by Applications (2018-2022)
9 Company Profiles
10 Global Doughnuts Market Revenue (USD Million), by Type, and Applications (2023-2030)
10.1 Global Doughnuts Revenue (USD Million) and Market Share (%) by Type (2023-2030)
10.1.1 Global Doughnuts Revenue (USD Million), and Market Share (%) by Type (2023-2030)
10.2 Global Doughnuts Revenue (USD Million) and Market Share (%) by Applications (2023-2030)
10.2.1 Global Doughnuts Revenue (USD Million), and Market Share (%) by Applications (2023-2030)
11 Global Doughnuts Development Regional Status and Outlook Forecast
11.1 Global Doughnuts Revenue (USD Million) By Regions (2023-2030)
11.2 North America Doughnuts Revenue (USD Million) by Type, and Applications (2023-2030)
11.2.1 North America Doughnuts Revenue (USD) Million by Country (2023-2030)
11.2.2 North America Doughnuts Revenue (USD Million), by Type (2023-2030)
11.2.3 North America Doughnuts Revenue (USD Million), Market Share (%) by Applications (2023-2030)
11.3 Europe Doughnuts Revenue (USD Million), by Type, and Applications (2023-2030)
11.3.1 Europe Doughnuts Revenue (USD Million), by Country (2023-2030)
11.3.2 Europe Doughnuts Revenue (USD Million), by Type (2023-2030)
11.3.3 Europe Doughnuts Revenue (USD Million), by Applications (2023-2030)
11.4 Asia Pacific Doughnuts Revenue (USD Million) by Type, and Applications (2023-2030)
11.4.1 Asia Pacific Doughnuts Revenue (USD Million), by Country (2023-2030)
11.4.2 Asia Pacific Doughnuts Revenue (USD Million), by Type (2023-2030)
11.4.3 Asia Pacific Doughnuts Revenue (USD Million), by Applications (2023-2030)
11.5 South America Doughnuts Revenue (USD Million), by Type, and Applications (2023-2030)
11.5.1 South America Doughnuts Revenue (USD Million), by Country (2023-2030)
11.5.2 South America Doughnuts Revenue (USD Million), by Type (2023-2030)
11.5.3 South America Doughnuts Revenue (USD Million), by Applications (2023-2030)
11.6 Middle East and Africa Doughnuts Revenue (USD Million), by Type, and Applications (2023-2030)
11.6.1 Middle East and Africa Doughnuts Revenue (USD Million), by region (2023-2030)
11.6.2 Middle East and Africa Doughnuts Revenue (USD Million), by Type (2023-2030)
11.6.3 Middle East and Africa Doughnuts Revenue (USD Million), by Applications (2023-2030)
12 Methodology and Data Sources
12.1 Methodology/Research Approach
12.1.1 Research Programs/Design
12.1.2 Market Size Estimation
12.1.3 Market Breakdown and Data Triangulation
12.2 Data Sources
12.2.1 Secondary Sources
12.2.2 Primary Sources
12.3 Disclaimer
List of Tables
Table 1 Market Segmentation Analysis
Table 2 Global Doughnuts Market Companies with Areas Served
Table 3 Products Offerings Global Doughnuts Market
Table 4 Low Growth Scenario Forecasts
Table 5 Reference Case Growth Scenario
Table 6 High Growth Case Scenario
Table 7 Global Doughnuts Revenue (USD Million) And CAGR (%) By Type (2018-2030)
Table 8 Global Doughnuts Revenue (USD Million) And CAGR (%) By Applications (2018-2030)
Table 9 Global Doughnuts Revenue (USD Million) And CAGR (%) By Regions (2018-2030)
Table 10 Global Doughnuts Revenue (USD Million) By Type (2018-2022)
Table 11 Global Doughnuts Revenue Market Share (%) By Type (2018-2022)
Table 12 Global Doughnuts Revenue (USD Million) By Applications (2018-2022)
Table 13 Global Doughnuts Revenue Market Share (%) By Applications (2018-2022)
Table 14 Global Doughnuts Market Revenue (USD Million) By Regions (2018-2022)
Table 15 Global Doughnuts Market Share (%) By Regions (2018-2022)
Table 16 North America Doughnuts Revenue (USD Million) By Country (2018-2022)
Table 17 North America Doughnuts Revenue (USD Million) By Type (2018-2022)
Table 18 North America Doughnuts Revenue (USD Million) By Applications (2018-2022)
Table 19 Europe Doughnuts Revenue (USD Million) By Country (2018-2022)
Table 20 Europe Doughnuts Revenue (USD Million) By Type (2018-2022)
Table 21 Europe Doughnuts Revenue (USD Million) By Applications (2018-2022)
Table 22 Asia Pacific Doughnuts Revenue (USD Million) By Country (2018-2022)
Table 23 Asia Pacific Doughnuts Revenue (USD Million) By Type (2018-2022)
Table 24 Asia Pacific Doughnuts Revenue (USD Million) By Applications (2018-2022)
Table 25 South America Doughnuts Revenue (USD Million) By Country (2018-2022)
Table 26 South America Doughnuts Revenue (USD Million) By Type (2018-2022)
Table 27 South America Doughnuts Revenue (USD Million) By Applications (2018-2022)
Table 28 Middle East and Africa Doughnuts Revenue (USD Million) By Region (2018-2022)
Table 29 Middle East and Africa Doughnuts Revenue (USD Million) By Type (2018-2022)
Table 30 Middle East and Africa Doughnuts Revenue (USD Million) By Applications (2018-2022)
Table 31 Financial Analysis
Table 32 Global Doughnuts Revenue (USD Million) By Type (2023-2030)
Table 33 Global Doughnuts Revenue Market Share (%) By Type (2023-2030)
Table 34 Global Doughnuts Revenue (USD Million) By Applications (2023-2030)
Table 35 Global Doughnuts Revenue Market Share (%) By Applications (2023-2030)
Table 36 Global Doughnuts Market Revenue (USD Million), And Revenue (USD Million) By Regions (2023-2030)
Table 37 North America Doughnuts Revenue (USD)By Country (2023-2030)
Table 38 North America Doughnuts Revenue (USD Million) By Type (2023-2030)
Table 39 North America Doughnuts Revenue (USD Million) By Applications (2023-2030)
Table 40 Europe Doughnuts Revenue (USD Million) By Country (2023-2030)
Table 41 Europe Doughnuts Revenue (USD Million) By Type (2023-2030)
Table 42 Europe Doughnuts Revenue (USD Million) By Applications (2023-2030)
Table 43 Asia Pacific Doughnuts Revenue (USD Million) By Country (2023-2030)
Table 44 Asia Pacific Doughnuts Revenue (USD Million) By Type (2023-2030)
Table 45 Asia Pacific Doughnuts Revenue (USD Million) By Applications (2023-2030)
Table 46 South America Doughnuts Revenue (USD Million) By Country (2023-2030)
Table 47 South America Doughnuts Revenue (USD Million) By Type (2023-2030)
Table 48 South America Doughnuts Revenue (USD Million) By Applications (2023-2030)
Table 49 Middle East and Africa Doughnuts Revenue (USD Million) By Region (2023-2030)
Table 50 Middle East and Africa Doughnuts Revenue (USD Million) By Region (2023-2030)
Table 51 Middle East and Africa Doughnuts Revenue (USD Million) By Type (2023-2030)
Table 52 Middle East and Africa Doughnuts Revenue (USD Million) By Applications (2023-2030)
Table 53 Research Programs/Design for This Report
Table 54 Key Data Information from Secondary Sources
Table 55 Key Data Information from Primary Sources
List of Figures
Figure 1 Market Scope
Figure 2 Porter’s Five Forces
Figure 3 Global Doughnuts Revenue (USD Million) By Type (2018-2022)
Figure 4 Global Doughnuts Revenue Market Share (%) By Type (2022)
Figure 5 Global Doughnuts Revenue (USD Million) By Applications (2018-2022)
Figure 6 Global Doughnuts Revenue Market Share (%) By Applications (2022)
Figure 7 Global Doughnuts Market Revenue (USD Million) By Regions (2018-2022)
Figure 8 Global Doughnuts Market Share (%) By Regions (2022)
Figure 9 North America Doughnuts Revenue (USD Million) By Country (2018-2022)
Figure 10 North America Doughnuts Revenue (USD Million) By Type (2018-2022)
Figure 11 North America Doughnuts Revenue (USD Million) By Applications (2018-2022)
Figure 12 Europe Doughnuts Revenue (USD Million) By Country (2018-2022)
Figure 13 Europe Doughnuts Revenue (USD Million) By Type (2018-2022)
Figure 14 Europe Doughnuts Revenue (USD Million) By Applications (2018-2022)
Figure 15 Asia Pacific Doughnuts Revenue (USD Million) By Country (2018-2022)
Figure 16 Asia Pacific Doughnuts Revenue (USD Million) By Type (2018-2022)
Figure 17 Asia Pacific Doughnuts Revenue (USD Million) By Applications (2018-2022)
Figure 18 South America Doughnuts Revenue (USD Million) By Country (2018-2022)
Figure 19 South America Doughnuts Revenue (USD Million) By Type (2018-2022)
Figure 20 South America Doughnuts Revenue (USD Million) By Applications (2018-2022)
Figure 21 Middle East and Africa Doughnuts Revenue (USD Million) By Region (2018-2022)
Figure 22 Middle East and Africa Doughnuts Revenue (USD Million) By Type (2018-2022)
Figure 23 Middle East and Africa Doughnuts Revenue (USD Million) By Applications (2018-2022)
Figure 24 Global Doughnuts Revenue (USD Million) By Type (2023-2030)
Figure 25 Global Doughnuts Revenue Market Share (%) By Type (2030)
Figure 26 Global Doughnuts Revenue (USD Million) By Applications (2023-2030)
Figure 27 Global Doughnuts Revenue Market Share (%) By Applications (2030)
Figure 28 Global Doughnuts Market Revenue (USD Million) By Regions (2023-2030)
Figure 29 North America Doughnuts Revenue (USD Million) By Country (2023-2030)
Figure 30 North America Doughnuts Revenue (USD Million) By Type (2023-2030)
Figure 31 North America Doughnuts Revenue (USD Million) By Applications (2023-2030)
Figure 32 Europe Doughnuts Revenue (USD Million) By Country (2023-2030)
Figure 33 Europe Doughnuts Revenue (USD Million) By Type (2023-2030)
Figure 34 Europe Doughnuts Revenue (USD Million) By Applications (2023-2030)
Figure 35 Asia Pacific Doughnuts Revenue (USD Million) By Country (2023-2030)
Figure 36 Asia Pacific Doughnuts Revenue (USD Million) By Type (2023-2030)
Figure 37 Asia Pacific Doughnuts Revenue (USD Million) By Applications (2023-2030)
Figure 38 South America Doughnuts Revenue (USD Million) By Country (2023-2030)
Figure 39 South America Doughnuts Revenue (USD Million) By Type (2023-2030)
Figure 40 South America Doughnuts Revenue (USD Million) By Applications (2023-2030)
Figure 41 Middle East and Africa Doughnuts Revenue (USD Million) By Region (2023-2030)
Figure 42 Middle East and Africa Doughnuts Revenue (USD Million) By Region (2023-2030)
Figure 43 Middle East and Africa Doughnuts Revenue (USD Million) By Type (2023-2030)
Figure 44 Middle East and Africa Doughnuts Revenue (USD Million) By Applications (2023-2030)
Figure 45 Bottom-Up and Top-Down Approaches for This Report
Figure 46 Data Triangulation
