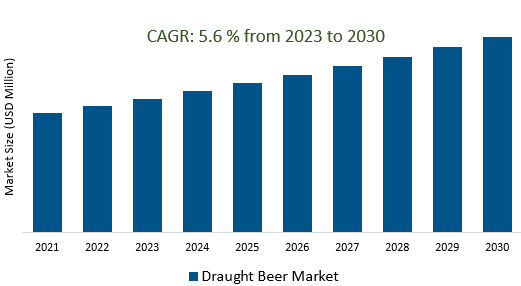
The Draught Beer Market Size is estimated to register 5.6% growth over the forecast period from 2023 to 2030.
Draught Beer Market Overview
Shifting consumer tastes towards unique and flavorful beer experiences, including craft and artisanal varieties are driving the demand for draught beer. Effective branding and marketing strategies contribute to market expansion. Innovations in packaging, such as eco-friendly kegs and reusable containers, aim to reduce waste and offer convenient, portable options for draught beer consumption, catering to on-the-go lifestyles. Its increasing availability in diverse venues such as restaurants, hotels, sports arenas, and music festivals are fueling the demand. Urbanization, coupled with the growth of the hospitality sector in urban areas, contributes significantly to the demand for draught beer. Its unique and social atmosphere, attracting patrons to establishments and encouraging repeat visits are fueling the market growth.
Draught Beer Market Dynamics
Market Trends- Impact of the Craft Beer Revolution on the Draught Beer Market.
There's a significant shift in consumer preferences toward craft beer due to its unique flavors, diverse styles, and artisanal brewing techniques.
Businesses are showcasing a diverse selection of locally crafted draught beers to attract consumers seeking unique, small-batch brews. Additionally, businesses are collaborating with local establishments, and participating in beer festivals to showcase their unique brews.
Further, establishments are focusing on marketing stories and brand narratives, creating an emotional connection with consumers, and boosting the appeal of craft draught beers.
Market Driver- Experiential Dining and Social Gathering drives the market demand.
The freshness, flavor, and social interaction associated with draught beer are contributing to creating a memorable and engaging dining experience, thereby increasing the market growth.
Businesses are aiming to attract patrons seeking not only quality beverages but also an atmosphere conducive to socializing and creating lasting memories. Furthe, Brewpubs, bars, and restaurants, offering diverse and curated draught beer selections are fueling the demand.
Establishing draught beer menus that cater to diverse tastes, offering food pairings with draught beer selections, and hosting beer-related events are further enhancing the market growth.
Market Opportunity- Expanding Distribution Channels drives Draught Beer Market.
A surge in availability across a wide array of venues, including hotels, restaurants, music festivals, sports arenas, and even unconventional locations like theaters or art galleries are the key factors.
By leveraging diverse distribution channels, breweries and establishments are extending their market reach, accessing new consumer segments, and creating additional sales opportunities, thereby increasing the revenue.
Embracing multiple distribution channels is not only adapting businesses to changing consumer behaviors but also fostering consumer engagement by offering varied experiences, ultimately driving growth.
Market Share Analysis- Keg Beer will register the fastest growth.
The Draught Beer Market is analyzed across Keg Beer & Cask Beer. Keg Beer is poised to register the fastest growth. This type of beer is favored by bars, restaurants, and large-scale events for its practicality and efficiency in dispensing. Kegs provide a sealed, pressurized environment that helps preserve the beer's freshness and carbonation, ensuring a consistent taste when served. It allows easy storage, transportation, and efficient dispensing through draught systems, making it a popular choice for establishments serving a high volume of beer to patrons. Further, they represent a broader range of beer styles and brands, catering to a diverse consumer base and offering a variety of options for different preferences. Its versatility and widespread adoption across various venues contribute significantly to its prominence within the Draught Beer Market.
Market Share Analysis- Super Premium held a significant market share in 2023.
The Draught Beer Market is analyzed across various categories including Super Premium, Premium & Regular. Of these, Super Premium held a significant market share in 2023. Super Premium beers in the Draught Beer Market represent a segment known for its exceptional quality, distinctive flavors, and higher price points compared to other beer categories. These beers cater to a niche market of enthusiasts seeking exclusive and top-tier brews. They are crafted with meticulous attention to detail, often using premium ingredients, unique brewing methods, and sometimes, limited production runs. Further, they showcase a diverse range of styles and flavors, appealing to discerning consumers interested in exploring distinctive and sometimes experimental brews. Their relatively higher price points reflect the craftsmanship, exclusivity, and often higher production costs associated with these premium brews.
Draught Beer Market Segmentation
By Type
By Category
- Super Premium
- Premium
- Regular
By End-user
By Production
- Macro Breweries
- Microbreweries
By Region
- North America (United States, Canada, Mexico)
- Europe (Germany, France, United Kingdom, Spain, Italy, Others)
- Asia Pacific (China, India, Japan, South Korea, Australia, Others)
- Latin America (Brazil, Argentina, Others)
- Middle East and Africa (Saudi Arabia, UAE, Kuwait, Other Middle East, South Africa, Nigeria, Other Africa)
Draught Beer Market Companies
- Diageo plc (United Kingdom)
- Heineken N.V. (Netherlands)
- SABMiller plc (United Kingdom)
- Carlsberg Group (Denmark)
- ABK Beer (Germany)
- Scottish & Newcastle (United Kingdom)
- Brasseries Kronenbourg (France)
- Efes Beverage Group (Turkey)
- MillerCoors LLC (United States)
- Hite Jinro Co Ltd (South Korea)
- Thai Beverage Public Company Limited (Thailand)
- San Miguel Corporation (Philippines)
- United Breweries Ltd (India)
- Kirin Holdings Company Ltd (Japan)
- Beijing Yanjing Brewery Co Ltd (China)
- Constellation Brands Inc (United States)
*List not exhaustive
Draught Beer Market Outlook 2023
1 Market Overview
1.1 Introduction to the Draught Beer Market
1.2 Scope of the Study
1.3 Research Objective
1.3.1 Key Market Scope and Segments
1.3.2 Players Covered
1.3.3 Years Considered
2 Executive Summary
2.1 2023 Draught Beer Industry- Market Statistics
3 Market Dynamics
3.1 Market Drivers
3.2 Market Challenges
3.3 Market Opportunities
3.4 Market Trends
4 Market Factor Analysis
4.1 Porter’s Five Forces
4.2 Market Entropy
4.2.1 Global Draught Beer Market Companies with Area Served
4.2.2 Products Offerings Global Draught Beer Market
5 COVID-19 Impact Analysis and Outlook Scenarios
5.1.1 Covid-19 Impact Analysis
5.1.2 post-COVID-19 Scenario- Low Growth Case
5.1.3 post-COVID-19 Scenario- Reference Growth Case
5.1.4 post-COVID-19 Scenario- Low Growth Case
6 Global Draught Beer Market Trends
6.1 Global Draught Beer Revenue (USD Million) and CAGR (%) by Type (2018-2030)
6.2 Global Draught Beer Revenue (USD Million) and CAGR (%) by Applications (2018-2030)
6.3 Global Draught Beer Revenue (USD Million) and CAGR (%) by regions (2018-2030)
7 Global Draught Beer Market Revenue (USD Million) by Type, and Applications (2018-2022)
7.1 Global Draught Beer Revenue (USD Million) by Type (2018-2022)
7.1.1 Global Draught Beer Revenue (USD Million), Market Share (%) by Type (2018-2022)
7.2 Global Draught Beer Revenue (USD Million) by Applications (2018-2022)
7.2.1 Global Draught Beer Revenue (USD Million), Market Share (%) by Applications (2018-2022)
8 Global Draught Beer Development Regional Status and Outlook
8.1 Global Draught Beer Revenue (USD Million) By Regions (2018-2022)
8.2 North America Draught Beer Revenue (USD Million) by Type, and Application (2018-2022)
8.2.1 North America Draught Beer Revenue (USD Million) by Country (2018-2022)
8.2.2 North America Draught Beer Revenue (USD Million) by Type (2018-2022)
8.2.3 North America Draught Beer Revenue (USD Million) by Applications (2018-2022)
8.3 Europe Draught Beer Revenue (USD Million), by Type, and Applications (USD Million) (2018-2022)
8.3.1 Europe Draught Beer Revenue (USD Million), by Country (2018-2022)
8.3.2 Europe Draught Beer Revenue (USD Million) by Type (2018-2022)
8.3.3 Europe Draught Beer Revenue (USD Million) by Applications (2018-2022)
8.4 Asia Pacific Draught Beer Revenue (USD Million), and Revenue (USD Million) by Type, and Applications (2018-2022)
8.4.1 Asia Pacific Draught Beer Revenue (USD Million) by Country (2018-2022)
8.4.2 Asia Pacific Draught Beer Revenue (USD Million) by Type (2018-2022)
8.4.3 Asia Pacific Draught Beer Revenue (USD Million) by Applications (2018-2022)
8.5 South America Draught Beer Revenue (USD Million), by Type, and Applications (2018-2022)
8.5.1 South America Draught Beer Revenue (USD Million), by Country (2018-2022)
8.5.2 South America Draught Beer Revenue (USD Million) by Type (2018-2022)
8.5.3 South America Draught Beer Revenue (USD Million) by Applications (2018-2022)
8.6 Middle East and Africa Draught Beer Revenue (USD Million), by Type, Technology, Application, Thickness (2018-2022)
8.6.1 Middle East and Africa Draught Beer Revenue (USD Million) by Country (2018-2022)
8.6.2 Middle East and Africa Draught Beer Revenue (USD Million) by Type (2018-2022)
8.6.3 Middle East and Africa Draught Beer Revenue (USD Million) by Applications (2018-2022)
9 Company Profiles
10 Global Draught Beer Market Revenue (USD Million), by Type, and Applications (2023-2030)
10.1 Global Draught Beer Revenue (USD Million) and Market Share (%) by Type (2023-2030)
10.1.1 Global Draught Beer Revenue (USD Million), and Market Share (%) by Type (2023-2030)
10.2 Global Draught Beer Revenue (USD Million) and Market Share (%) by Applications (2023-2030)
10.2.1 Global Draught Beer Revenue (USD Million), and Market Share (%) by Applications (2023-2030)
11 Global Draught Beer Development Regional Status and Outlook Forecast
11.1 Global Draught Beer Revenue (USD Million) By Regions (2023-2030)
11.2 North America Draught Beer Revenue (USD Million) by Type, and Applications (2023-2030)
11.2.1 North America Draught Beer Revenue (USD) Million by Country (2023-2030)
11.2.2 North America Draught Beer Revenue (USD Million), by Type (2023-2030)
11.2.3 North America Draught Beer Revenue (USD Million), Market Share (%) by Applications (2023-2030)
11.3 Europe Draught Beer Revenue (USD Million), by Type, and Applications (2023-2030)
11.3.1 Europe Draught Beer Revenue (USD Million), by Country (2023-2030)
11.3.2 Europe Draught Beer Revenue (USD Million), by Type (2023-2030)
11.3.3 Europe Draught Beer Revenue (USD Million), by Applications (2023-2030)
11.4 Asia Pacific Draught Beer Revenue (USD Million) by Type, and Applications (2023-2030)
11.4.1 Asia Pacific Draught Beer Revenue (USD Million), by Country (2023-2030)
11.4.2 Asia Pacific Draught Beer Revenue (USD Million), by Type (2023-2030)
11.4.3 Asia Pacific Draught Beer Revenue (USD Million), by Applications (2023-2030)
11.5 South America Draught Beer Revenue (USD Million), by Type, and Applications (2023-2030)
11.5.1 South America Draught Beer Revenue (USD Million), by Country (2023-2030)
11.5.2 South America Draught Beer Revenue (USD Million), by Type (2023-2030)
11.5.3 South America Draught Beer Revenue (USD Million), by Applications (2023-2030)
11.6 Middle East and Africa Draught Beer Revenue (USD Million), by Type, and Applications (2023-2030)
11.6.1 Middle East and Africa Draught Beer Revenue (USD Million), by region (2023-2030)
11.6.2 Middle East and Africa Draught Beer Revenue (USD Million), by Type (2023-2030)
11.6.3 Middle East and Africa Draught Beer Revenue (USD Million), by Applications (2023-2030)
12 Methodology and Data Sources
12.1 Methodology/Research Approach
12.1.1 Research Programs/Design
12.1.2 Market Size Estimation
12.1.3 Market Breakdown and Data Triangulation
12.2 Data Sources
12.2.1 Secondary Sources
12.2.2 Primary Sources
12.3 Disclaimer
List of Tables
Table 1 Market Segmentation Analysis
Table 2 Global Draught Beer Market Companies with Areas Served
Table 3 Products Offerings Global Draught Beer Market
Table 4 Low Growth Scenario Forecasts
Table 5 Reference Case Growth Scenario
Table 6 High Growth Case Scenario
Table 7 Global Draught Beer Revenue (USD Million) And CAGR (%) By Type (2018-2030)
Table 8 Global Draught Beer Revenue (USD Million) And CAGR (%) By Applications (2018-2030)
Table 9 Global Draught Beer Revenue (USD Million) And CAGR (%) By Regions (2018-2030)
Table 10 Global Draught Beer Revenue (USD Million) By Type (2018-2022)
Table 11 Global Draught Beer Revenue Market Share (%) By Type (2018-2022)
Table 12 Global Draught Beer Revenue (USD Million) By Applications (2018-2022)
Table 13 Global Draught Beer Revenue Market Share (%) By Applications (2018-2022)
Table 14 Global Draught Beer Market Revenue (USD Million) By Regions (2018-2022)
Table 15 Global Draught Beer Market Share (%) By Regions (2018-2022)
Table 16 North America Draught Beer Revenue (USD Million) By Country (2018-2022)
Table 17 North America Draught Beer Revenue (USD Million) By Type (2018-2022)
Table 18 North America Draught Beer Revenue (USD Million) By Applications (2018-2022)
Table 19 Europe Draught Beer Revenue (USD Million) By Country (2018-2022)
Table 20 Europe Draught Beer Revenue (USD Million) By Type (2018-2022)
Table 21 Europe Draught Beer Revenue (USD Million) By Applications (2018-2022)
Table 22 Asia Pacific Draught Beer Revenue (USD Million) By Country (2018-2022)
Table 23 Asia Pacific Draught Beer Revenue (USD Million) By Type (2018-2022)
Table 24 Asia Pacific Draught Beer Revenue (USD Million) By Applications (2018-2022)
Table 25 South America Draught Beer Revenue (USD Million) By Country (2018-2022)
Table 26 South America Draught Beer Revenue (USD Million) By Type (2018-2022)
Table 27 South America Draught Beer Revenue (USD Million) By Applications (2018-2022)
Table 28 Middle East and Africa Draught Beer Revenue (USD Million) By Region (2018-2022)
Table 29 Middle East and Africa Draught Beer Revenue (USD Million) By Type (2018-2022)
Table 30 Middle East and Africa Draught Beer Revenue (USD Million) By Applications (2018-2022)
Table 31 Financial Analysis
Table 32 Global Draught Beer Revenue (USD Million) By Type (2023-2030)
Table 33 Global Draught Beer Revenue Market Share (%) By Type (2023-2030)
Table 34 Global Draught Beer Revenue (USD Million) By Applications (2023-2030)
Table 35 Global Draught Beer Revenue Market Share (%) By Applications (2023-2030)
Table 36 Global Draught Beer Market Revenue (USD Million), And Revenue (USD Million) By Regions (2023-2030)
Table 37 North America Draught Beer Revenue (USD)By Country (2023-2030)
Table 38 North America Draught Beer Revenue (USD Million) By Type (2023-2030)
Table 39 North America Draught Beer Revenue (USD Million) By Applications (2023-2030)
Table 40 Europe Draught Beer Revenue (USD Million) By Country (2023-2030)
Table 41 Europe Draught Beer Revenue (USD Million) By Type (2023-2030)
Table 42 Europe Draught Beer Revenue (USD Million) By Applications (2023-2030)
Table 43 Asia Pacific Draught Beer Revenue (USD Million) By Country (2023-2030)
Table 44 Asia Pacific Draught Beer Revenue (USD Million) By Type (2023-2030)
Table 45 Asia Pacific Draught Beer Revenue (USD Million) By Applications (2023-2030)
Table 46 South America Draught Beer Revenue (USD Million) By Country (2023-2030)
Table 47 South America Draught Beer Revenue (USD Million) By Type (2023-2030)
Table 48 South America Draught Beer Revenue (USD Million) By Applications (2023-2030)
Table 49 Middle East and Africa Draught Beer Revenue (USD Million) By Region (2023-2030)
Table 50 Middle East and Africa Draught Beer Revenue (USD Million) By Region (2023-2030)
Table 51 Middle East and Africa Draught Beer Revenue (USD Million) By Type (2023-2030)
Table 52 Middle East and Africa Draught Beer Revenue (USD Million) By Applications (2023-2030)
Table 53 Research Programs/Design for This Report
Table 54 Key Data Information from Secondary Sources
Table 55 Key Data Information from Primary Sources
List of Figures
Figure 1 Market Scope
Figure 2 Porter’s Five Forces
Figure 3 Global Draught Beer Revenue (USD Million) By Type (2018-2022)
Figure 4 Global Draught Beer Revenue Market Share (%) By Type (2022)
Figure 5 Global Draught Beer Revenue (USD Million) By Applications (2018-2022)
Figure 6 Global Draught Beer Revenue Market Share (%) By Applications (2022)
Figure 7 Global Draught Beer Market Revenue (USD Million) By Regions (2018-2022)
Figure 8 Global Draught Beer Market Share (%) By Regions (2022)
Figure 9 North America Draught Beer Revenue (USD Million) By Country (2018-2022)
Figure 10 North America Draught Beer Revenue (USD Million) By Type (2018-2022)
Figure 11 North America Draught Beer Revenue (USD Million) By Applications (2018-2022)
Figure 12 Europe Draught Beer Revenue (USD Million) By Country (2018-2022)
Figure 13 Europe Draught Beer Revenue (USD Million) By Type (2018-2022)
Figure 14 Europe Draught Beer Revenue (USD Million) By Applications (2018-2022)
Figure 15 Asia Pacific Draught Beer Revenue (USD Million) By Country (2018-2022)
Figure 16 Asia Pacific Draught Beer Revenue (USD Million) By Type (2018-2022)
Figure 17 Asia Pacific Draught Beer Revenue (USD Million) By Applications (2018-2022)
Figure 18 South America Draught Beer Revenue (USD Million) By Country (2018-2022)
Figure 19 South America Draught Beer Revenue (USD Million) By Type (2018-2022)
Figure 20 South America Draught Beer Revenue (USD Million) By Applications (2018-2022)
Figure 21 Middle East and Africa Draught Beer Revenue (USD Million) By Region (2018-2022)
Figure 22 Middle East and Africa Draught Beer Revenue (USD Million) By Type (2018-2022)
Figure 23 Middle East and Africa Draught Beer Revenue (USD Million) By Applications (2018-2022)
Figure 24 Global Draught Beer Revenue (USD Million) By Type (2023-2030)
Figure 25 Global Draught Beer Revenue Market Share (%) By Type (2030)
Figure 26 Global Draught Beer Revenue (USD Million) By Applications (2023-2030)
Figure 27 Global Draught Beer Revenue Market Share (%) By Applications (2030)
Figure 28 Global Draught Beer Market Revenue (USD Million) By Regions (2023-2030)
Figure 29 North America Draught Beer Revenue (USD Million) By Country (2023-2030)
Figure 30 North America Draught Beer Revenue (USD Million) By Type (2023-2030)
Figure 31 North America Draught Beer Revenue (USD Million) By Applications (2023-2030)
Figure 32 Europe Draught Beer Revenue (USD Million) By Country (2023-2030)
Figure 33 Europe Draught Beer Revenue (USD Million) By Type (2023-2030)
Figure 34 Europe Draught Beer Revenue (USD Million) By Applications (2023-2030)
Figure 35 Asia Pacific Draught Beer Revenue (USD Million) By Country (2023-2030)
Figure 36 Asia Pacific Draught Beer Revenue (USD Million) By Type (2023-2030)
Figure 37 Asia Pacific Draught Beer Revenue (USD Million) By Applications (2023-2030)
Figure 38 South America Draught Beer Revenue (USD Million) By Country (2023-2030)
Figure 39 South America Draught Beer Revenue (USD Million) By Type (2023-2030)
Figure 40 South America Draught Beer Revenue (USD Million) By Applications (2023-2030)
Figure 41 Middle East and Africa Draught Beer Revenue (USD Million) By Region (2023-2030)
Figure 42 Middle East and Africa Draught Beer Revenue (USD Million) By Region (2023-2030)
Figure 43 Middle East and Africa Draught Beer Revenue (USD Million) By Type (2023-2030)
Figure 44 Middle East and Africa Draught Beer Revenue (USD Million) By Applications (2023-2030)
Figure 45 Bottom-Up and Top-Down Approaches for This Report
Figure 46 Data Triangulation
